In this tutorial, you’ll learn how to format lists in Power BI Paginated Reports. Specifically, you’ll learn how to add texts and create dynamic table headers.
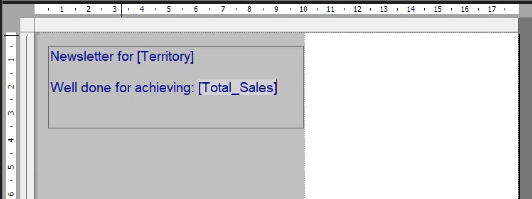
The goal of this tutorial is to create a list in a paginated report that looks similar to this:
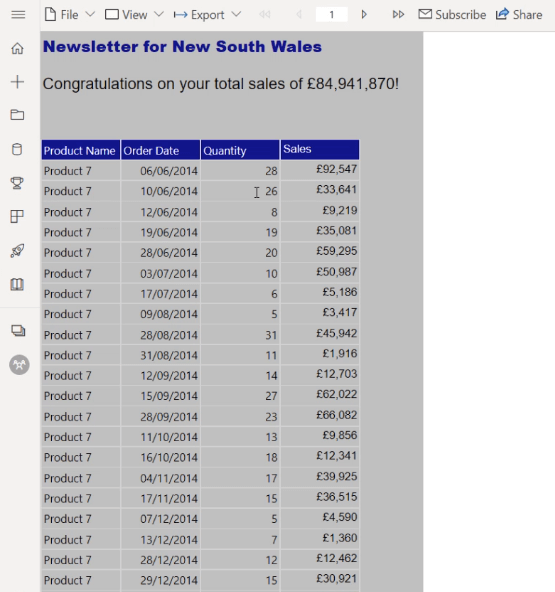
A Dynamic List Header In Power BI Paginated Reports
Insert a textbox in your list by right-clicking on it and selecting Insert > Textbox. Then, type in the list header you want in your report.
Drag the Territory field next to the header.
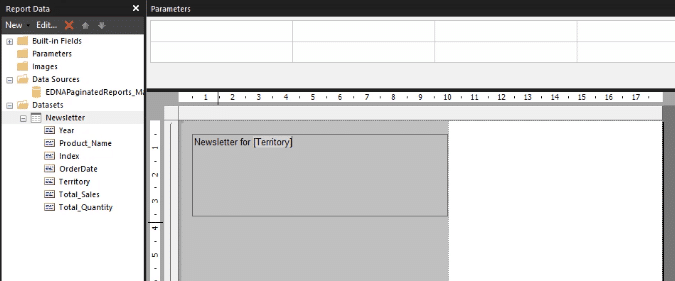
In this case, the Territory field is grouped by region. So when you Run the report, you’ll see that each page contains a heading unique to each region.
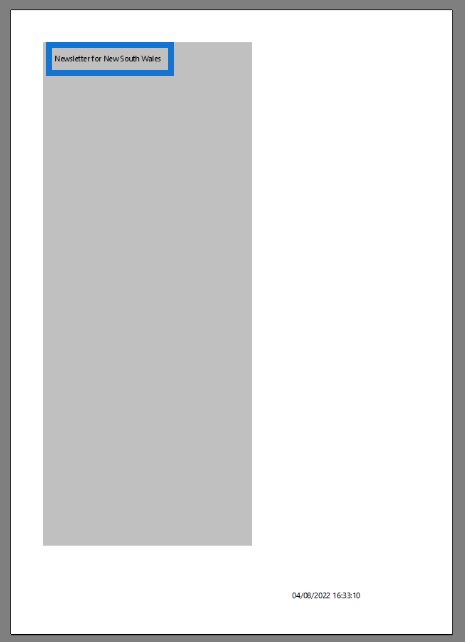

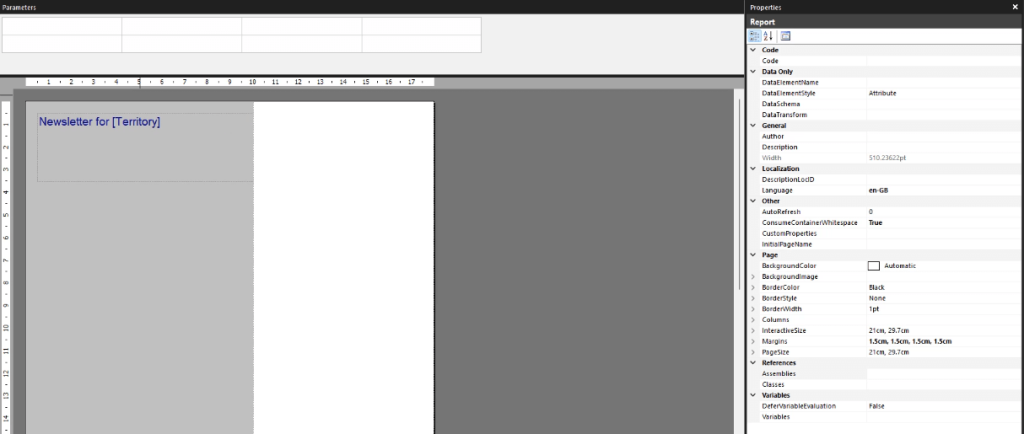
The next thing you need to do is format the heading so that there’s a distinction between the elements in the list. You can further change the font, font size, font color, alignment, and position.
You can also add a text showing how much you’ve achieved for each region by dragging the Total Sales field in the textbox.
When you Run the report, each page will show a different Total Sales amount depending on the region.
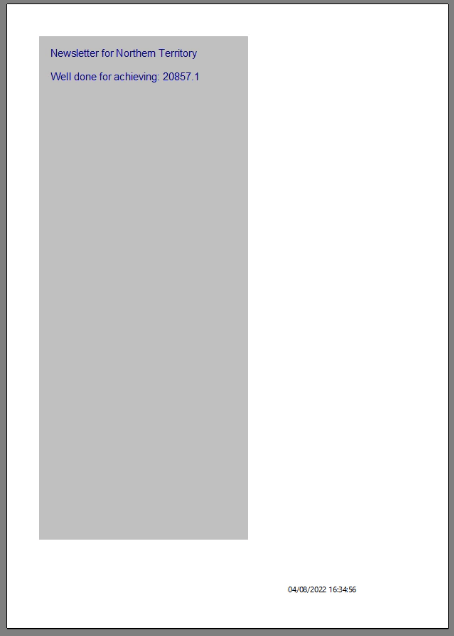
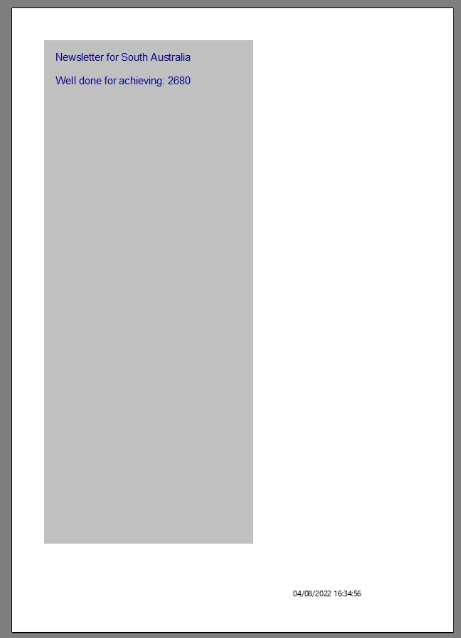
You can format the Total Sales into a currency by inputting C0 in the Number Format option in the Properties pane.

Assign A Dataset To An Element In A List
Right-click on your list and click Insert > Table. Rename it and adjust its size and position.
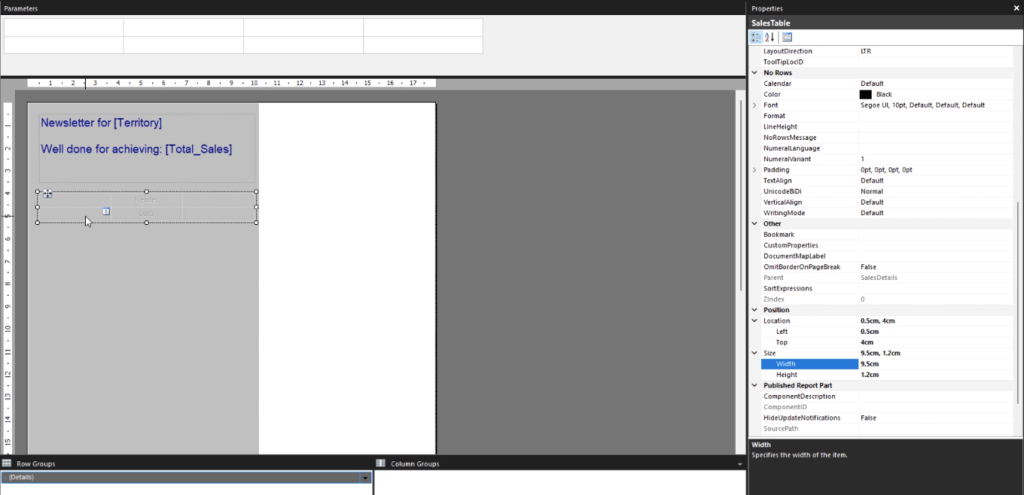
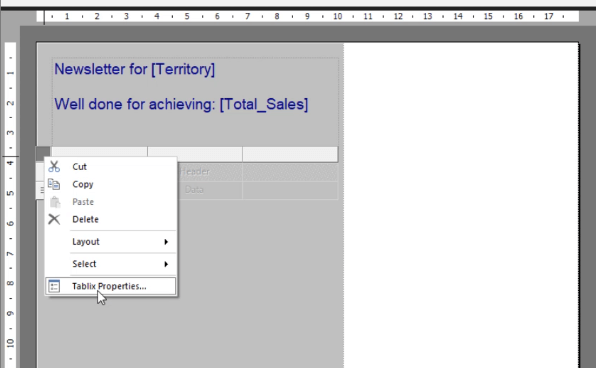
To assign a data set to the table, click on the top-left square and select Tablix Properties.
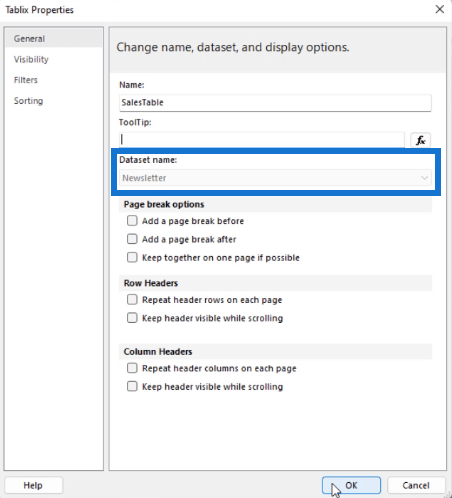
In the Tablix Properties window, select the data set you want in your table.
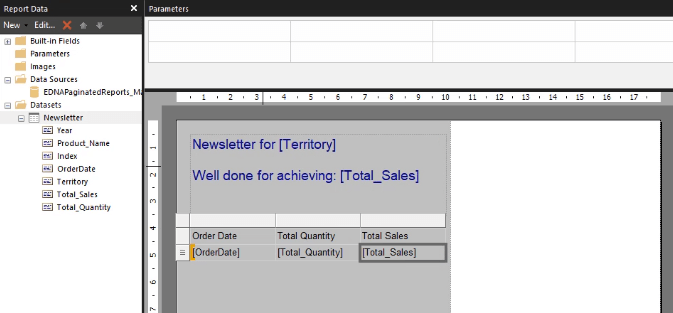
Then, drag the data fields from the Report Data pane to your table.
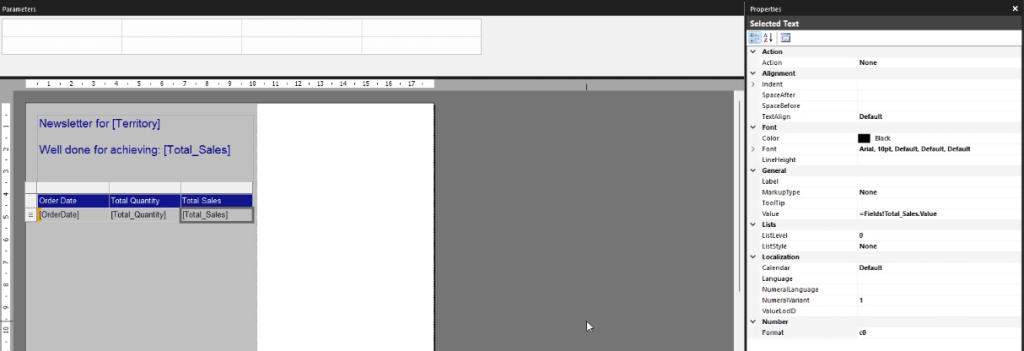
Change the table’s formatting style to make it more comprehensible to end users.
Repeating Table Header In Power BI Paginated Reports
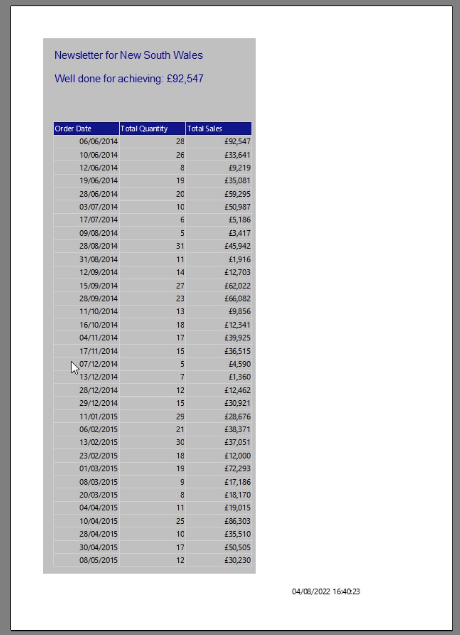
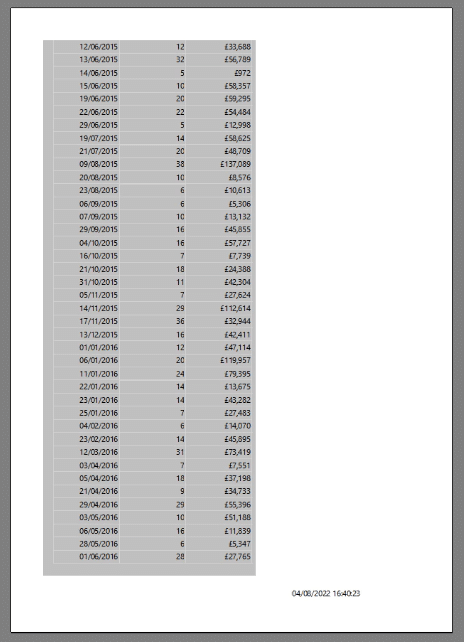
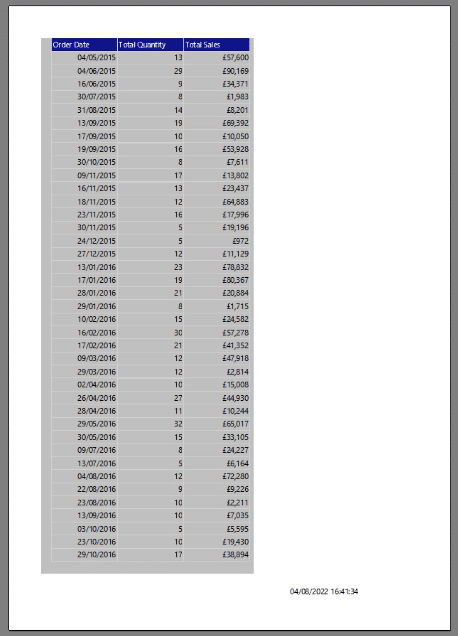
When you Run the report, you’ll see that the succeeding pages only contain the table data. The headers can only be seen on the front page.
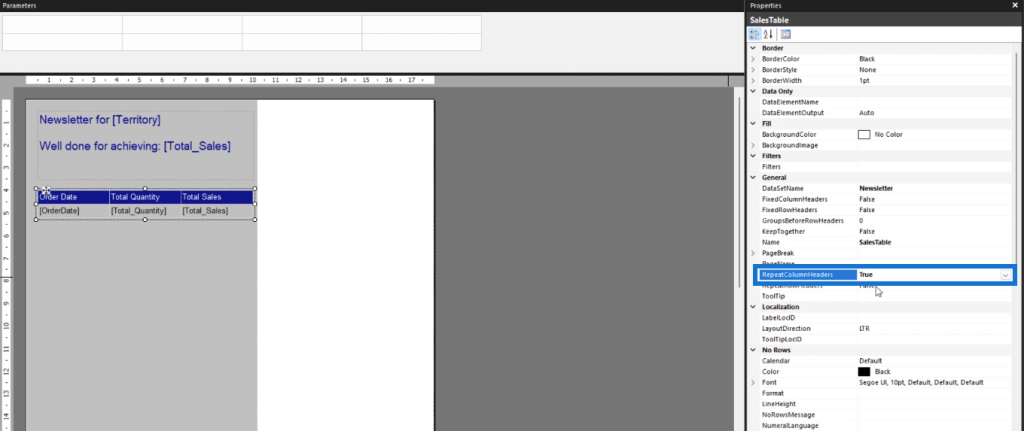
To create a repeating column within a group, select the table and go to the Properties pane. Change the RepeatColumnHeaders option to True.
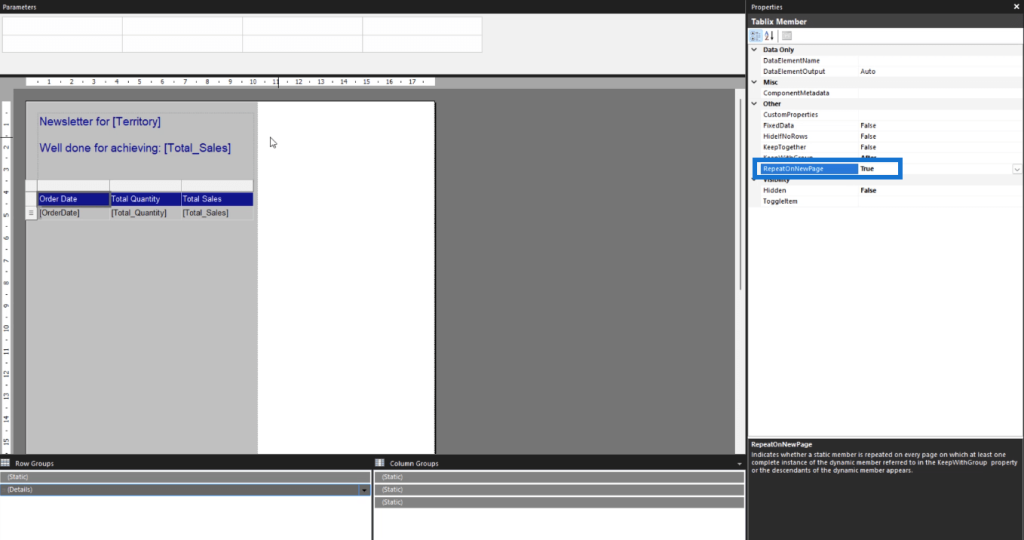
Next, enable the Advanced mode option by clicking the drop-down arrow beside Column Groups. Then, click Static under Row Groups.

This will show different formatting settings in the Properties Pane. Change the ReportOnNewPage option to True.
When you Run your report, you’ll see that each page now shows the table headers.
***** Related Links *****
How To Import Datasets Into Report Builder
Create A Blank Report Using Power BI Report Builder
SharePoint List Formatting Walkthrough
Conclusion
This tutorial demonstrated how to create dynamic texts and table headers in a list in Power BI paginated reports. Some formatting techniques are also discussed.
Lists allow you to create free form sections in your report. Since data is presented in a clustered manner, it’s important to make sure that they can be easily understood by the end user.
All the best,
Sue Bayes


