
The first pillar of Power BI development is data loading and data transformations. In this tutorial, you’ll learn about the 12 Power BI data predevelopment items you need to set up and remember before creating your report.
This checklist is important to do prior to anything else as it ensures a smooth report development. Make sure to observe these best practices.

1. Disable Specific Features
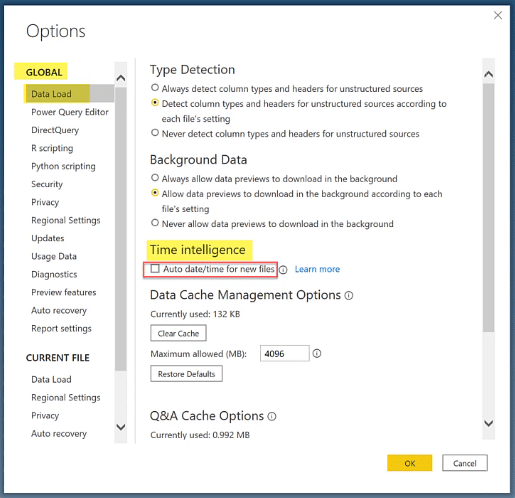
First of all, it’s recommended to disable the auto date/time feature in Power BI. There are two ways to do this: you can either disable this feature globally or disable it for the current file.
To disable it globally means that the current and all future files won’t have this feature. Do this by going to File then Options and settings. Under Global and Data Load, uncheck the Auto day/time for new files box under Time Intelligence.
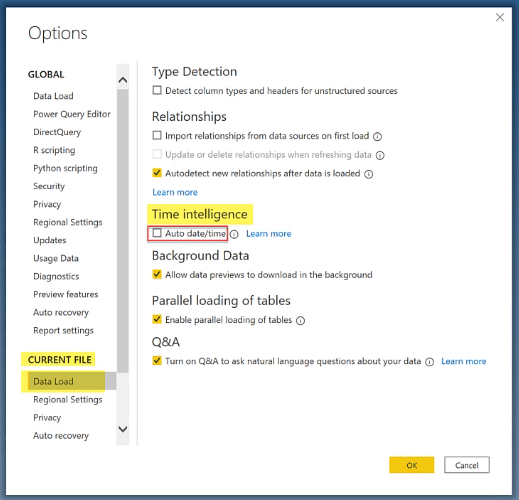
To disable only the current file, access the same Options tab and look for Current File. In the Data Load tab, uncheck the Auto date/time box.
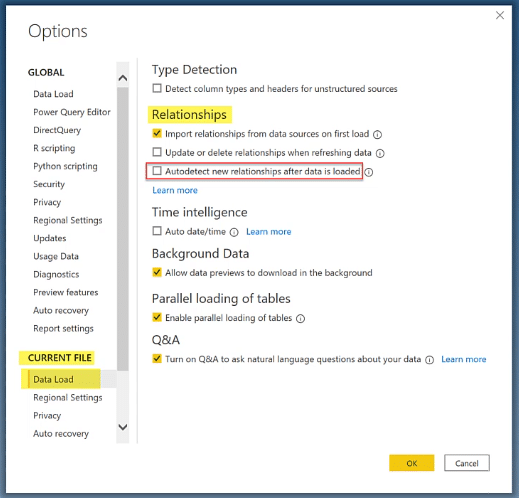
Another feature to disable is Autodetect new relationships. It’s also located in Current File under Relationships.
2. Cross Highlighting Vs Cross Filtering
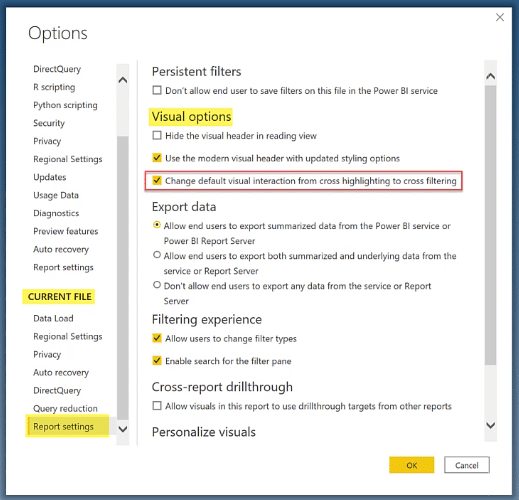
There are two ways of interacting with visuals in Power BI reports. These interactions can be cross filtered or cross highlighted. Cross highlighting is enabled by default in Power BI.
To change this option, go again to File and then Options and settings. Under the Current File in the Report settings section, you can change the default visual interaction from cross highlighting to cross-filtering.
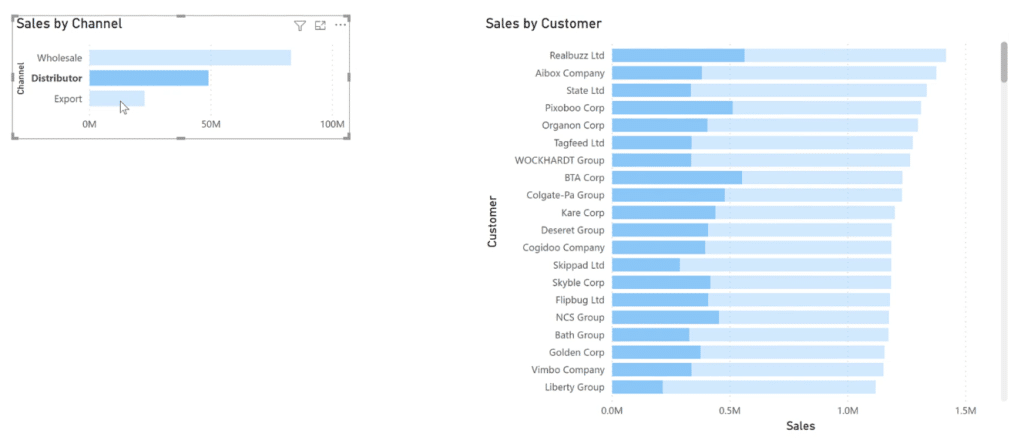
Here’s what that will look like. For cross highlighting, you can see that when you click one channel in the first bar chart, the second bar chart highlights a selected portion for each bar.

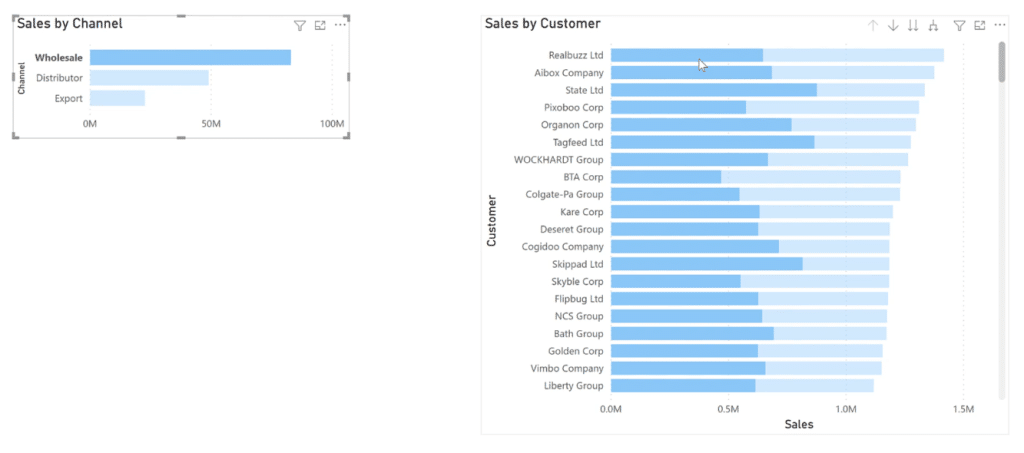
The highlighted portion remains in a dark color while the unselected portion stays in a light color.
If you click a different channel, you’ll see that the length of each light-colored bar in the second bar chart doesn’t change. Only the highlighted portions shift depending on the channel selected.
On the other hand, for cross filtering, the length of each bar changes when you shift from one channel to another.
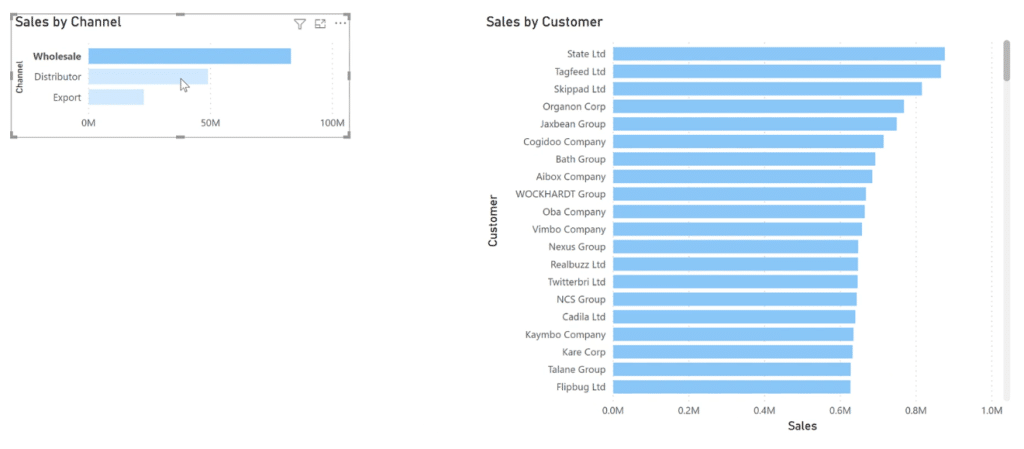
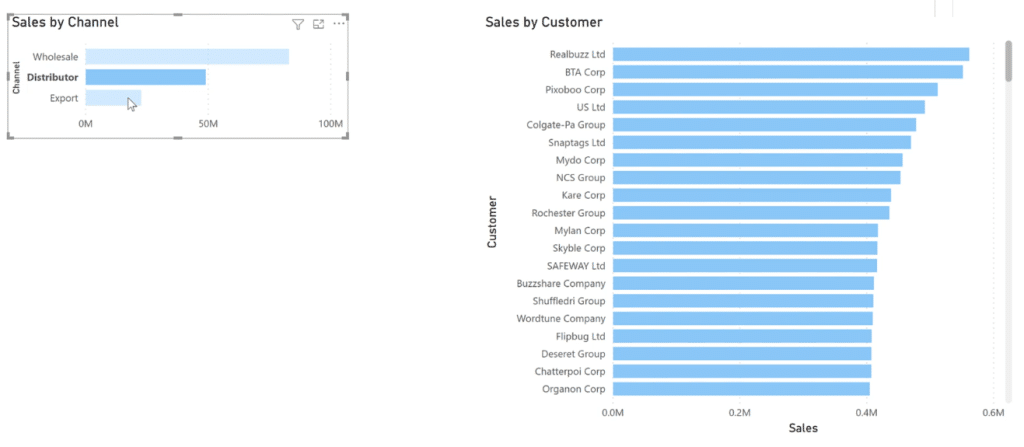
This is the recommended option to use when creating reports in Power BI.
3. Separating Power BI Datasets From The Report
You need to develop and publish datasets in a standalone PBIX file.
One of the advantages of publishing datasets separately is that you can use the endorsement process in Power BI Service to promote and certify datasets.
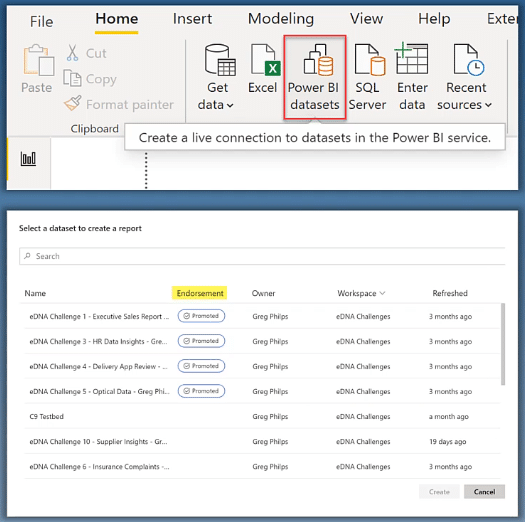
It’s an ideal practice to select and endorse a dataset, preferably a certified one, when developing a new report.
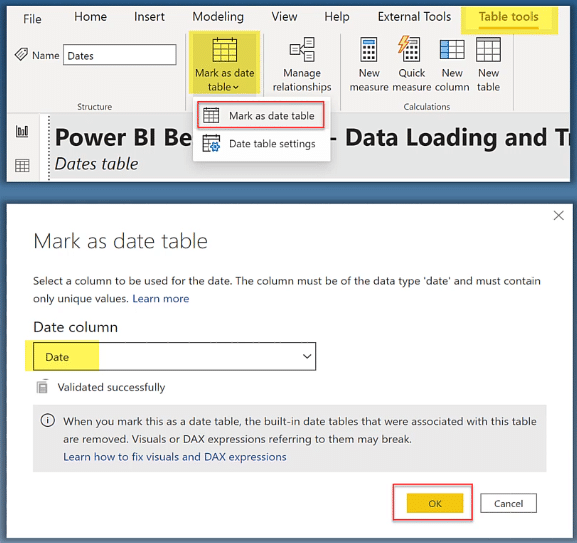
4. Dedicated Dates Table
The next predevelopment setup you need to do is to make sure that your report has dedicated Dates table.
As an example, you can use the extended Dates table available in the Enterprise DNA forum which you can access using this link. Once you’ve accessed it, copy and paste the M code into a blank query.
Another thing to do is to mark the Dates table as a date table to enable the use of time intelligence calculations in Power BI.
You also need to ensure that your Dates table is contiguous (one row per day) and fully covers the edges of your Fact table.
Remember to always add full years to the Dates table. It’s also a best practice to add an additional future year to the Dates table to enable forecasting using time intelligence calculations.
If your Dates table has more days than you want shown in your report, you can control visuals using slicers. You can use the IsAfterToday column or the Offset column in the Filter pane.
5. Checking Before Creating
Before starting and creating a report, you first need to check whether you need to be doing a report at all. Ask yourself these questions:
- Is there an existing report?
- Is there an existing data model?
- Is there an existing certified dataset?
- Is there an existing promoted dataset?
- Is there an existing dataset?
And most importantly, do you really need to start from scratch?

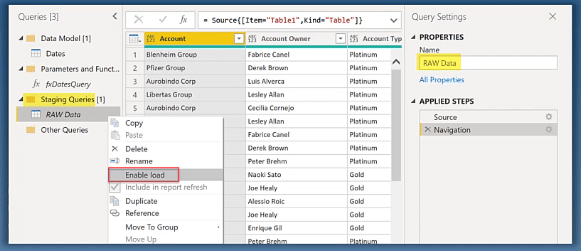
6. Staging And Referencing Power BI Data
When you’re loading a flat data table, you may have facts and dimensions in another table, such as, in an Excel file. If this is the case, move it into a Staging Query section and rename it. Once done, you can uncheck Enable load.
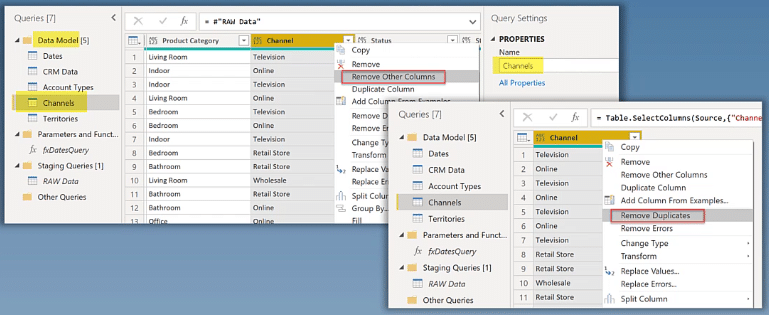
Next, create a reference for each Fact and Lookup table and rename them appropriately.
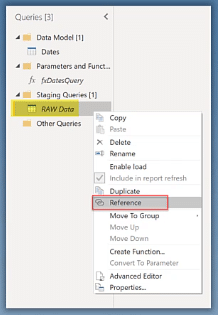
Edit each reference and only keep the needed columns. Make sure to remove duplicates.
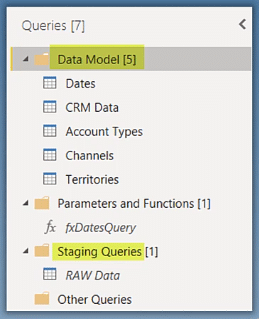
And lastly, organize your data model. Put similar data in their own groups.
7. Report Performance
One of the biggest factors that impacts performance is data volume.
Reduce the amount of data to be loaded as much as possible. Always follow the axiom: if you don’t need it, don’t retrieve it. It’s easier to add new things to a report than it is to take things out.
When you put too many things in a report, you’re paying a penalty for performance. So it’s recommended to do your filtering at the source.
If you can’t do it at the source, you can use Power Query. Use the auto-filter option for loading necessary rows. And use the Choose Columns or Remove Columns options for loading necessary columns.
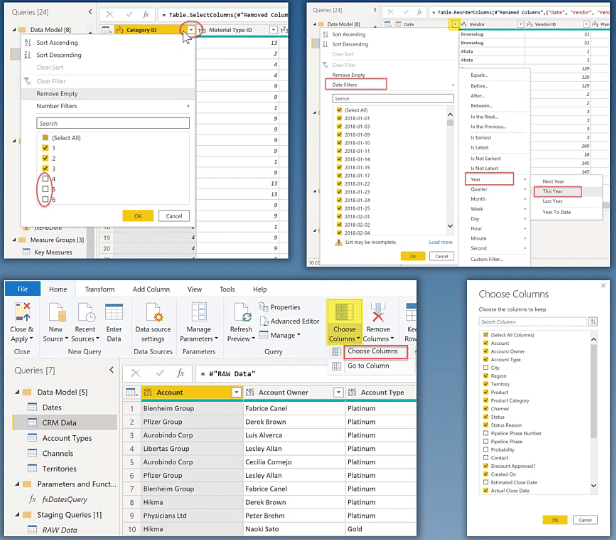
Between Choose Columns and Remove Columns, it’s best to use the former. Choose Columns makes it easier to retrieve additional columns within Power BI if ever you need to do so in the future.
8. Query Folding For Power BI Data
Query folding is an attempt by Power BI to combine several data selection and transformation steps into a single data source query.
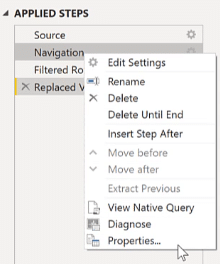
To determine if a query is being folded, you need to right-click on the Applied Steps pane and then look at the View Native Query option.
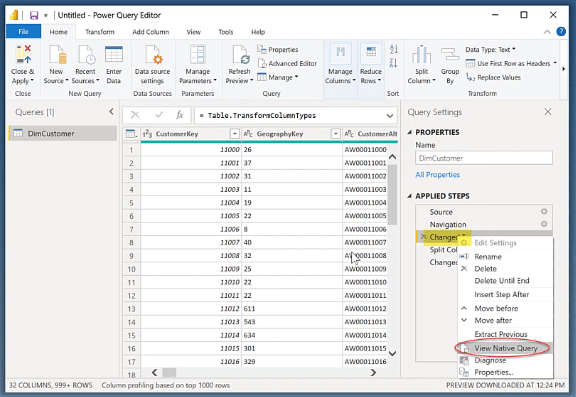
If this option is not grayed out when right-clicking a Power Query step, then query folding is being used. If it’s grayed out, then the query is not being folded.
Here’s an example of what this looks like. The Navigation step in this demo doesn’t have the View Native Query option grayed out. Thus, query folding is being used.
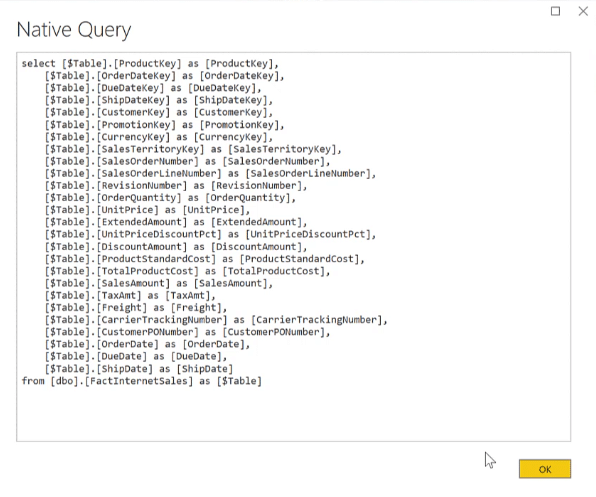
If this is selected, it will show a simple SQL select statement.
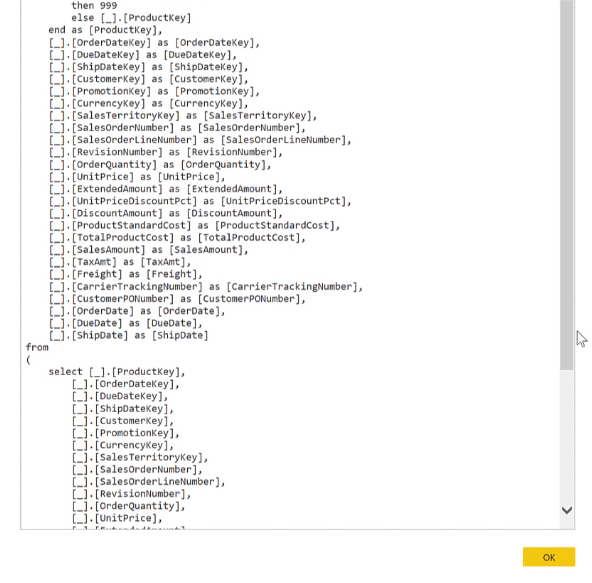
For this example, the Filtered Rows and Replaced Value steps already have their data filtered out. So when viewing the Native Query of the Filtered Rows and Replaced Value steps, the statements will show a greater collapse of three queries into one.
This is Power BI saying that the best way to get data into your model is to have the source do the work for you.
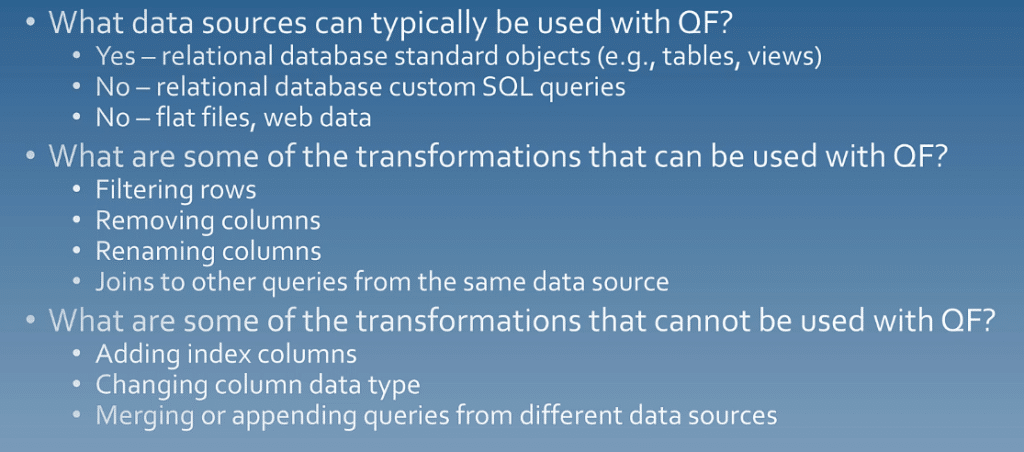
Here are other important points to remember about query folding:
9. Connectivity Mode
Before starting your report, choose the correct connectivity mode. Import mode is the default setting and should be used when possible as it offers the best report performance. Direct Query mode can be used if up-to-the-minute data is desired, but it can negatively impact performance.
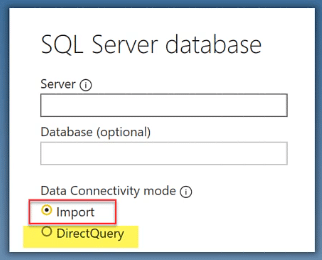
Live Connection mode can be accessed with existing Data Warehouse models (e.g., SSAS multi-dimensional cubes).
10. Location For Data Transformations
It’s also important to know the proper location for data transformations.
The best place to do them is in the source. If you can’t do them in the source, do them in Power Query. If you can’t do them in Power Query, then do them in DAX.

Perform your data transformations as far upstream as possible, and as far downstream as necessary.
If you can do adjustments in Power Query, then that would be better than in DAX. If it’s not dynamic within the context of a report session, consider doing it in Power Query to simplify your DAX and increase report performance.
And as far as the shape of your tables go, strive to make Fact tables long and thin, while Dimension tables should be short and wide.
11. Naming And Data Types
A few best practices for naming are using consistent naming schemes that’s easy to understand. Rename all your report elements as necessary to conform to a consistent naming standard. These elements include tables, queries, columns, and Power Query steps, among many others.
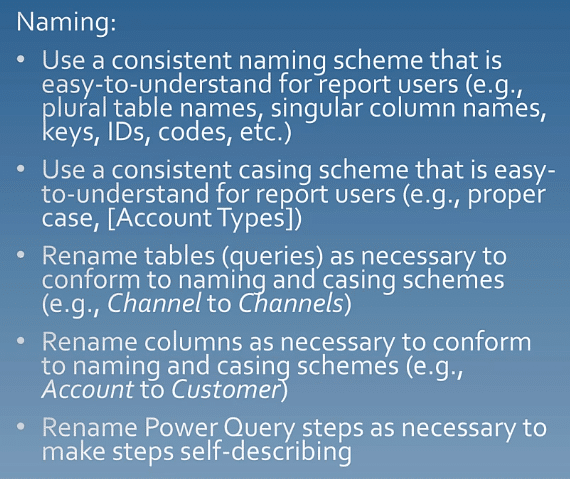
This is important to do as it allows users not involved in the report development process to easily understand what’s going on in the report.
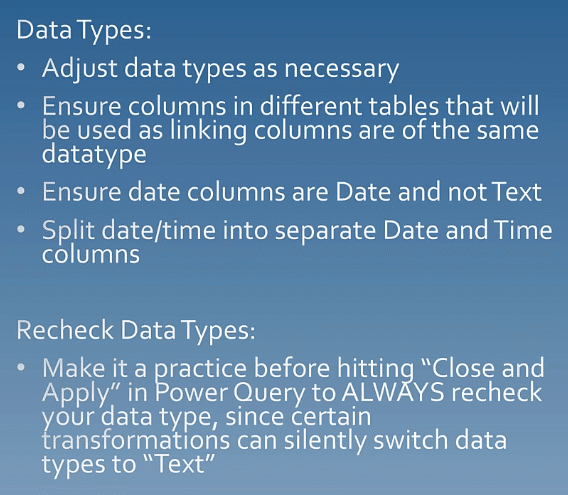
Though Power BI does an excellent job of assigning the correct data types, some adjustments may be needed. Here are important points to remember for Data Types:
12. Granularity Of Power BI Data
The last item in this predevelopment setup checklist is granularity.
You should strive to source your data at a consistent granularity. When combining different granularities in your solution, use Power Query or DAX to allocate the reference data appropriately.
Here’s an example:
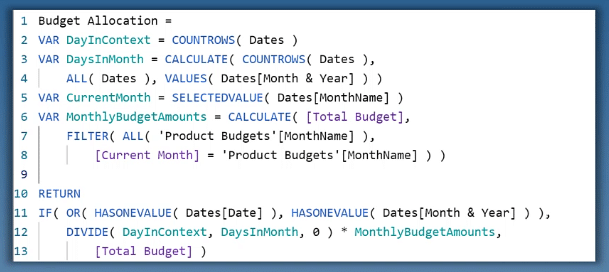
The main Sales data is at the daily level, which means that its granularity is day. The budget reference data is at a monthly level, so its granularity is monthly. You need to make this consistent. Both data should either be in days or in months.
***** Related Links *****
Best Practices For Power BI Report Development
Creating Power BI Reports Effectively & Avoiding Hidden Pitfalls
Create Power BI Reports With These Techniques & Examples
Conclusion
This detailed checklist has everything you need to get report development right from the start. There will be times when you want to start right away with your report.
But rushing through may most likely be more time consuming. There’s greater possibility of encountering bumps and pitfalls. Going through each item beforehand will save you a lot of time in the long run.
Greg


