
In this blog tutorial, I’ll show you how to use Power BI calculation groups to create custom groupings and an insightful visualization particularly if you are unable to add new tables and columns to your Power BI desktop. You can watch the full video of this tutorial at the bottom of this blog.
This was basically a query on the Enterprise DNA forum by one of our members and he wanted to see how many employees have been absent from work and wanted to create custom groupings based on the number of days of absence. He cannot add tables and columns, so we’re going to use calculation groups in this case.
Calculation groups are a Power BI modeling feature that you can use through the External Tools, Tabular Editor. Calculation groups are special tables with DAX expressions representing each calculation items you placed in.

This is not difficult to do at all, so we can jump right in.
Creating Custom Groupings
The member wanted to have custom groupings. One group for employees that have been absent for less than 25 days, another for less than 50 days, and one for less than 75 days.
To create a custom grouping, we go to our tables and just add a custom group. For this example, it’s under the Injuries table.
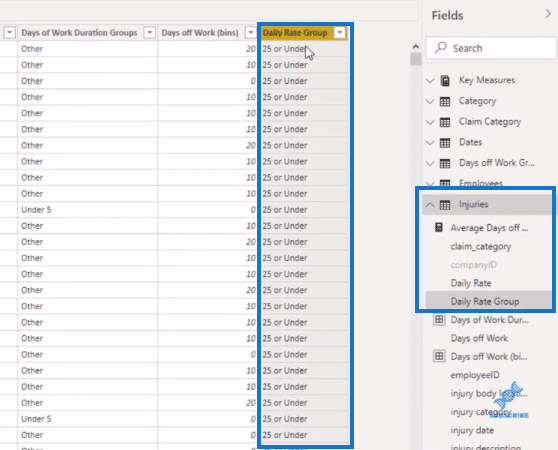
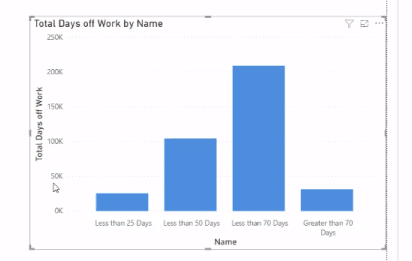
Then, we can use that new column to achieve a visualization like this.
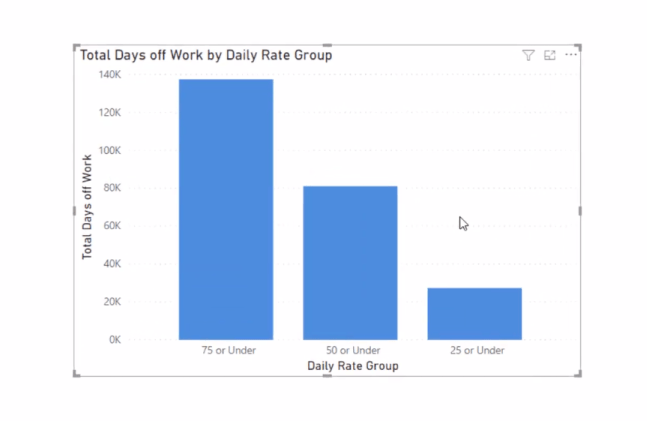
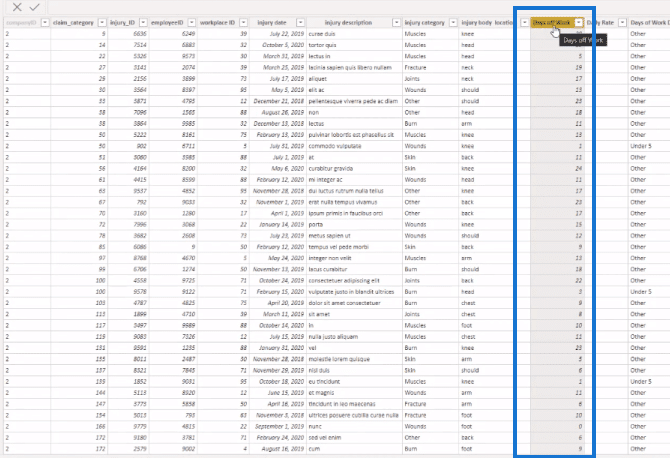
The measure that I’m using here is what I called Total Days Off Work. It’s a pretty straightforward measure, using the SUM function.

It is simply adding all the Injuries Days off Work from the Injuries table. We’ll use this measure within another measure, which we will use in our calculation items.

Now, the problem was that it was not possible for the member to create new tables or new columns as they were grayed out because he was connected to a different PBI model. This is where calculation groups come to the rescue.
Creating Power BI Calculation Groups
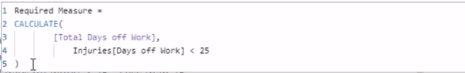
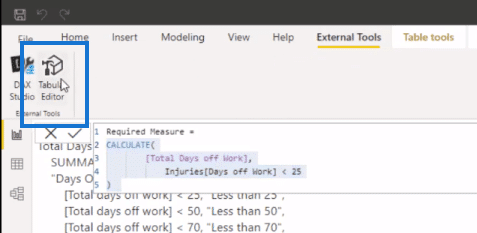
The measure that we’ll be using is pretty simple. In this formula, we have the CALCULATE function and we’ll be grouping Total Days Off Work (our core measure) in 25 days, or under 50 days, or any type of custom grouping we want.
So we’ll copy this measure because I have already created it here, and then we’ll go to External Tools, then to Tabular Editor.
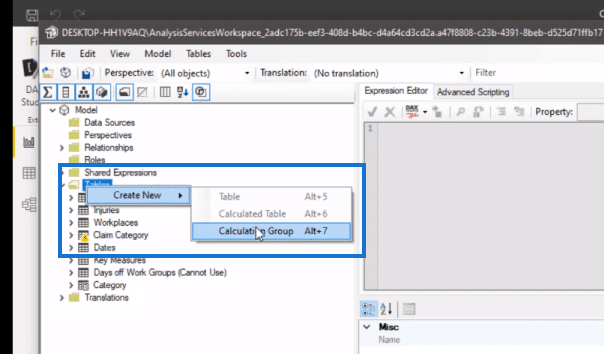
We then go to Tables then right-click and select create new – calculation group.
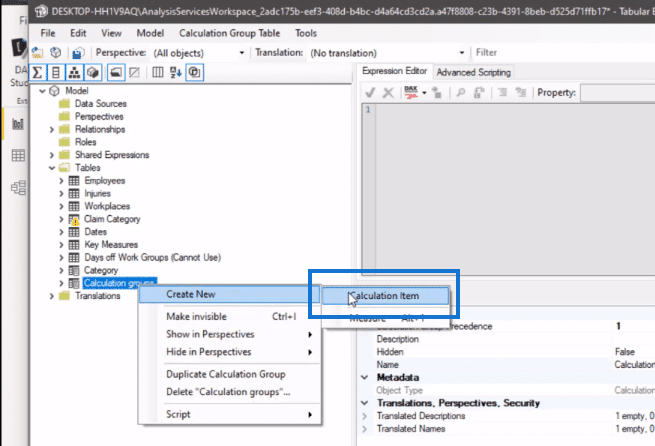
Let’s name this as Calculation groups. Next, we’ll create a calculation item. To do that, we right-click on the calculation group we’ve just created and then go create new – calculation item.
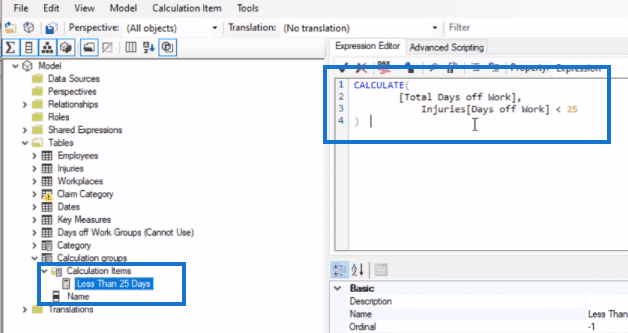
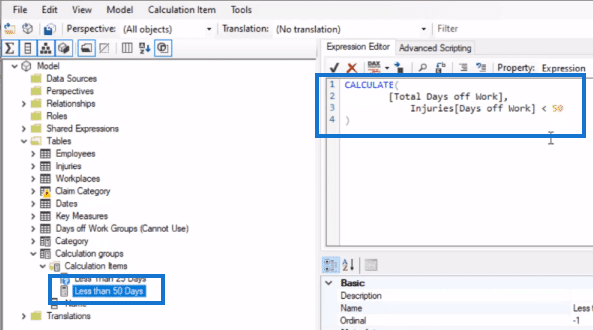
Let’s call this one Less than 25 Days. Then we go to the Expression Editor section and paste in the measure we copied.
Now we’re going to create another calculation item and we’ll call it, Less than 50 Days. We’ll use the same measure, but only change the grouping criteria from 25 to 50.
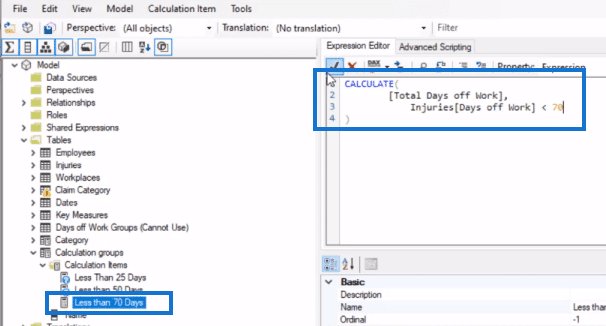
The next calculation item is for Less than 70 Days. We do the same steps and just change the grouping criteria to 70.
Lastly, we’ll create a calculation item for Greater than 70 Days. In the DAX expression, we’ll change the grouping criteria to greater than (>) 70.
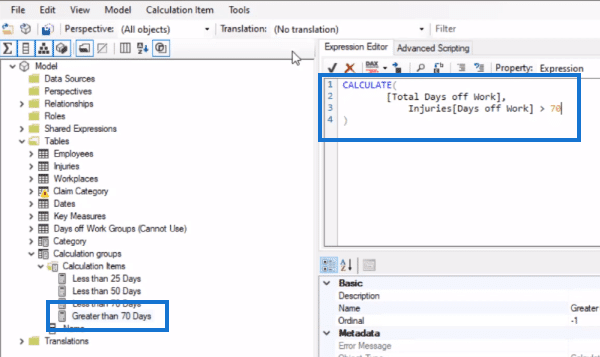
Lastly, we’ll create a calculation item for Greater than 70 Days. In the DAX expression, we’ll change the grouping criteria to greater than (>) 70.
Click on save and then refresh it on the Power BI desktop. Now we can bring our calculation group into the visualization, and we can see the groupings we created.
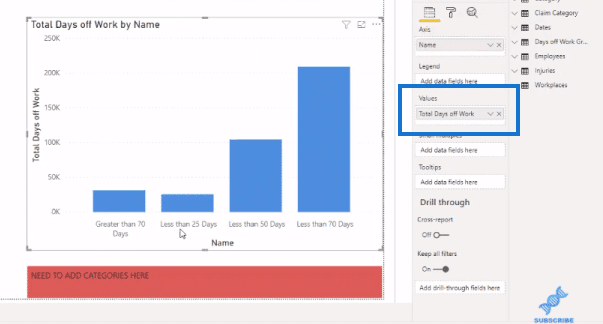
Click on save and then refresh it on the Power BI desktop. Now we can bring our calculation group into the visualization and we can see the groupings we’ve created.
Changing The Grouping Order
If we wish to change the order of the groupings in the visualization, we can easily do so with the help of the Tabular Editor.
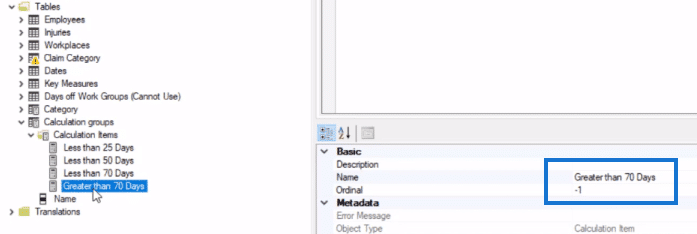
In the Tabular Editor, we go to our calculation group and then click on the calculation items. You’ll see here that in every calculation item, the ordinality has been set to -1 by default.
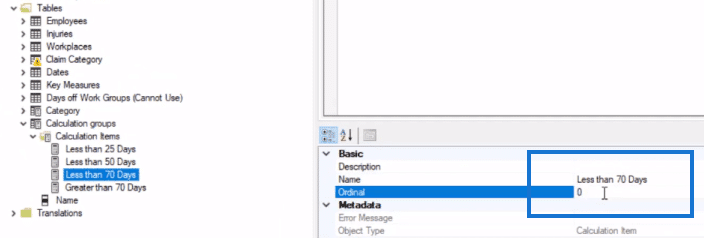
So for example, we want our Less than 70 Days to be on top here or to be the first on the left side of the visualization. We can simply change the ordinality to 0 or do the drag-and-drop.

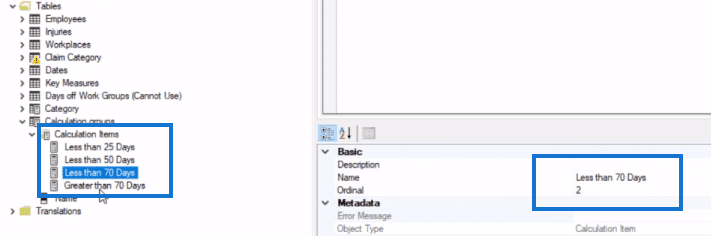
Now, what I want to do here is to have the Less than 25 Days at the top, then the Less than 50 Days, followed by the Less than 70 Days, and finally the Greater than 70 Days; so I’ll just drag-and-drop each of them to the order that I wanted. You will be able to see that the ordinality has changed automatically.
Then, save the changes and refresh the page. Now we have the order of the calculation groupings that we wanted.
***** Related Links *****
Conditional Formatting In Calculation Groups – Power BI
Small Multiples With Calculation Groups In Power BI
Level Up Your External Tools Menu In Power BI
Conclusion
This is a great example of how you can utilize Power BI calculation groups. As you can see, this is a quick and easy fix technique when you are unable to add new tables and new columns in your Power BI desktop.
I hope you’ve found this tutorial helpful and that you’re able to apply it to your own work. Check out the links below for more related content.
All the best,
Mudassir
[youtube https://www.youtube.com/watch?v=Vc3_Q4izDpU?rel=0&w=784&h=441]


