
In today’s blog, I will demonstrate an approach to Access Analytic’s Start Stop Challenge where, using Power BI, between-dates total working hours will be calculated. You can watch the full video of this tutorial at the bottom of this blog.
The task is to calculate the total number of hours for a staff member on each month and date. I presented start and end dates that can cross over months and take the status into account dealing with possible typos.


Dataset For Power BI Between-Dates Working Hours
Let’s go to the Power Query editor.
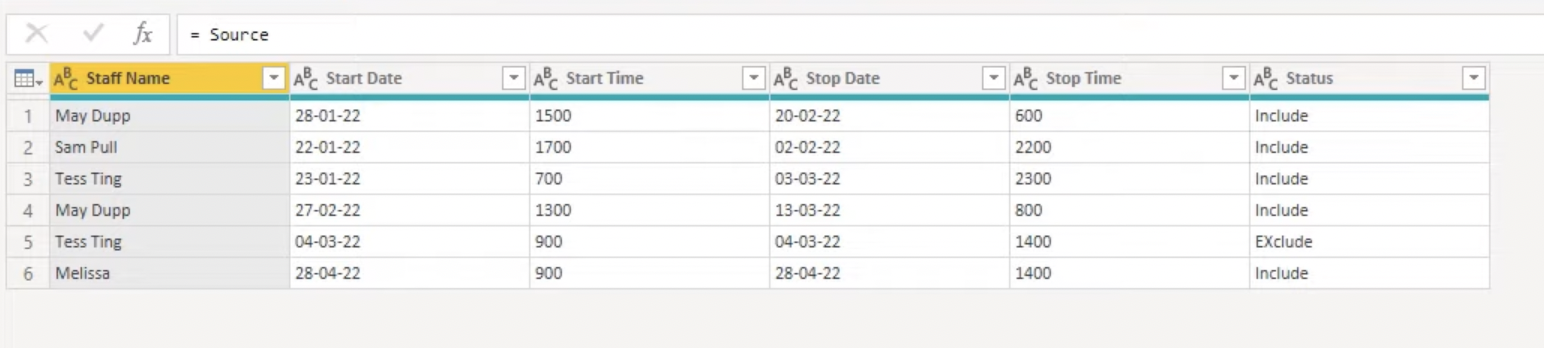
Here’s our data for this challenge. We have a table with columns for the Staff Name, Start Date, Start Time, Stop Date, Stop Time, and Status.
Filtering The Rows
Let’s start by selecting the rows based on their status, and Query editor can help us with this logic. Click the dropdown arrow beside Status. Select Text Filters and choose Does Not Begin With.

In the Filter Rows window that will show up, write “e”. Then click OK.

Nothing will happen yet and that’s fine because we write a lowercase “e” and the “Exclude” in our data that starts with an uppercase “E”.
To fix that, we’ll use the optional third parameter of Text.StartsWith. In the formula bar, go to the end of the Text.StartsWith function. Add a comma and let’s enter our Comparer.OrdinalIgnoreCase. Click the check mark and that should remove the Exclude rows.

Of course, we could have someone who have erroneously typed “Exclude” without an initial “E.” In that case, we can create some additional logic to go along with the situation.

We can test if the word does not include an “X” by extending our function and using Text.Contains. To do that, add or Text.Contains ([Status], “x”, Comparer.OrdinalIgnoreCase.
Notice that compared to the first clause, we replaced “e” with an “x.” We keep ignoring the case, and wrap a set of parentheses around both our clauses. Click the check mark and we should get a table without the rows containing Exclude or Xclude status.

Adding A Custom Column
Let’s now head to the main part of this challenge. We’ll add a custom column using the UI and then switch to the editor.
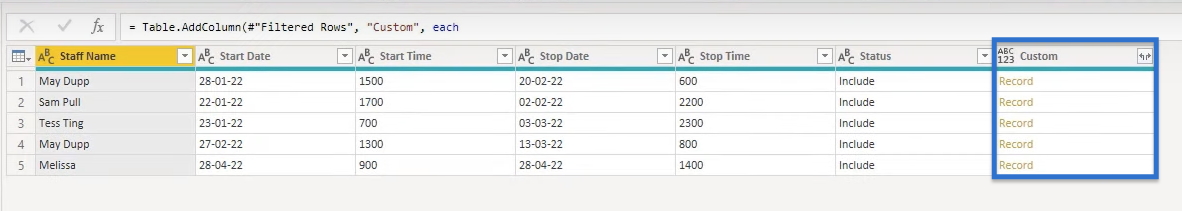
Start with the mini table icon in the upper left corner of the table. Click on it and in the dropdown, select Add Custom Column.

At this point, we’re only interested in bringing the data that we’ll need later on. And because we’ll work with multiple fields, let’s create a record using the record initializers, represented with square brackets.
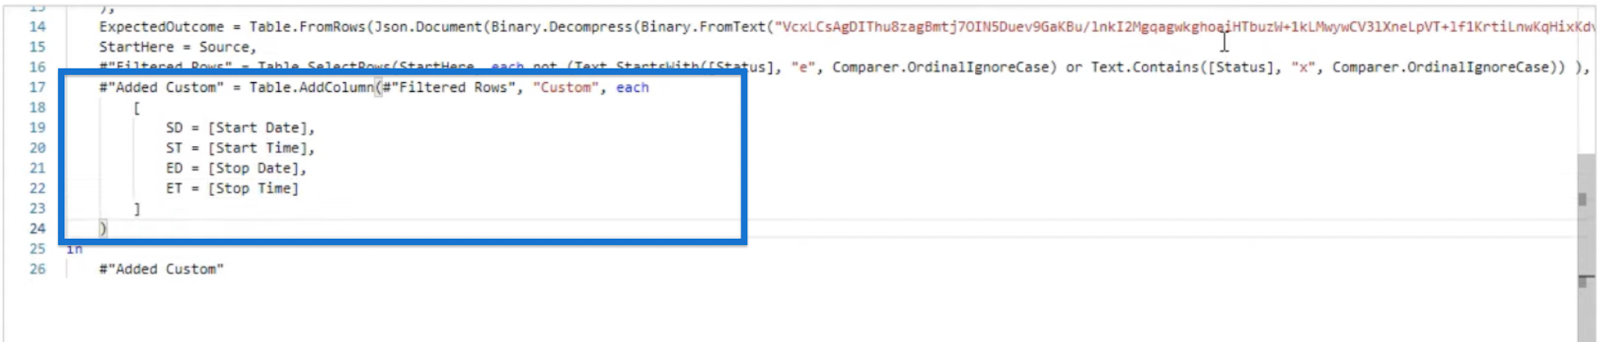
Let’s create variables and assign the available columns. Start by typing SD which we’ll equate to the Start Date. We can do that by clicking Start Date on the column on the right.
We’ll do the same for the variables ST, ED, and ET to be assigned to Start Time, Stop Date, and Stop Time, respectively. Then, close off the record with a closing bracket. Click OK.

A custom column with the records will be added to the table. Click on the white space beside Record and a preview pane will open. This will bring in all the values from this row.

Power BI Between-Dates Working Hours: The Variables
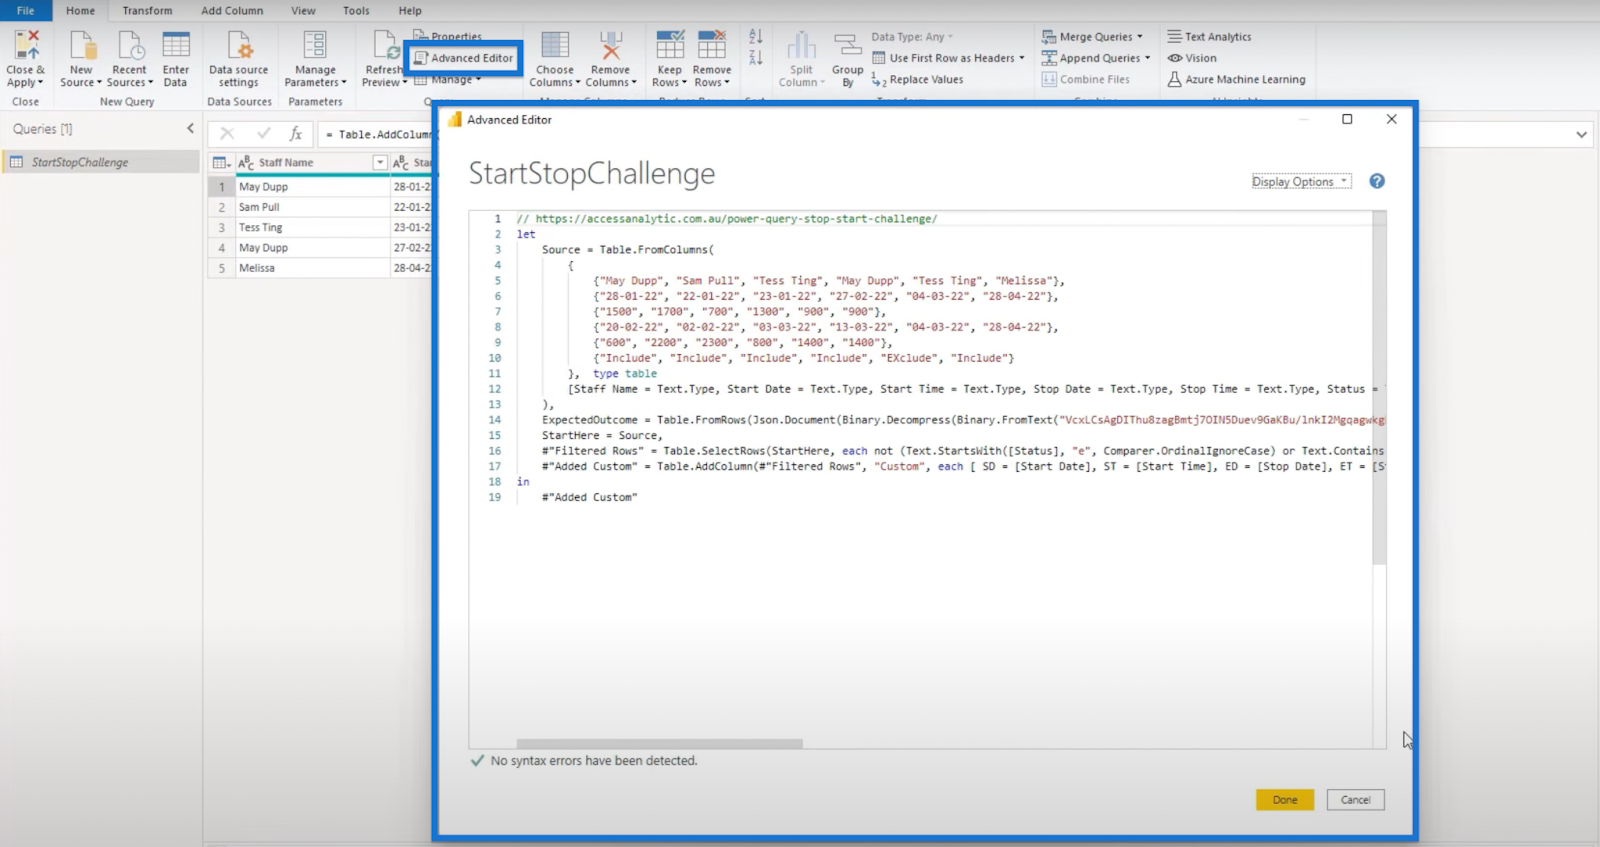
We can then format our variables through the Advanced Editor window. This is how the Advanced Editor window should look like.
Then, let’s put our variables in separate new lines.
Now, we can expand the logic that we need. So, instead of a record, we could also use a nested let expression here. Note that either of those will work because we have multiple variables or field names with values assigned to them.
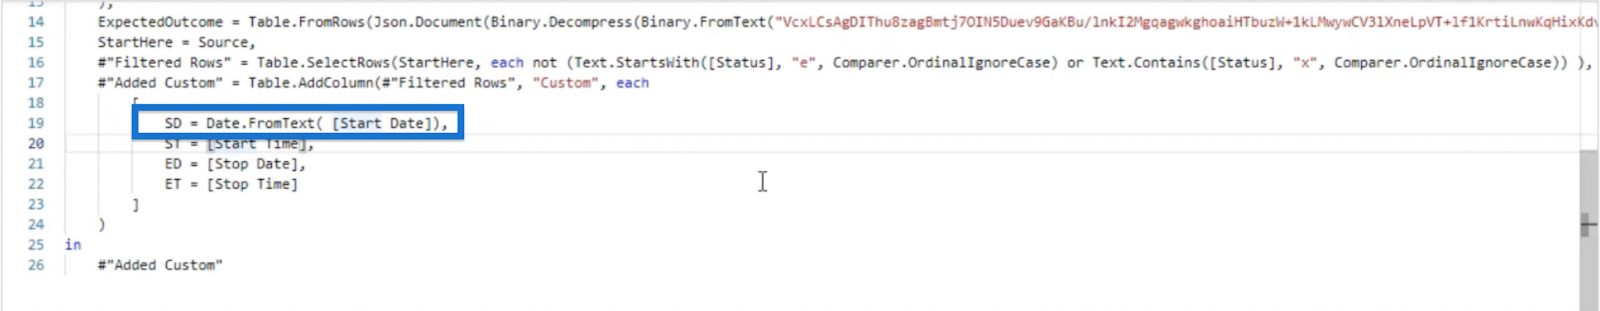
Our Start Date is currently written as a text value and we need to transform that into a proper date format. To do that, wrap the function Date.FromText around it.
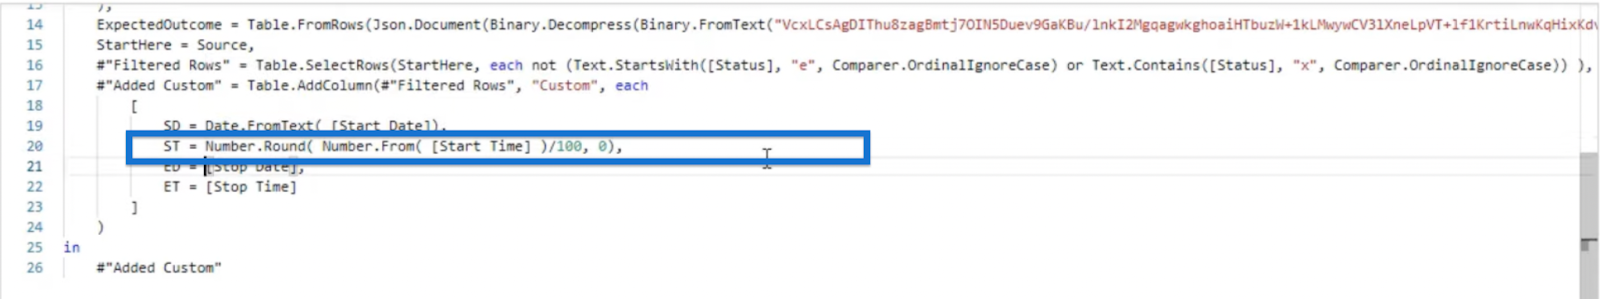
For the Start Time which is also formatted as a string, we need to convert it to a number. Then, we can divide it by a hundred and round it to remove any decimal places.
Using the Number.From function, divide our Start Date value by 100. Then, wrap them inside the next function, Number.Round, and add , 0 at the end to round off without decimal places.
For End Date and End Time, we’ll just copy the same functions we had in Start Date and Start Time respectively, and replace them with the appropriate variables.


Once the variables are properly formatted, create another field in our record for some additional logic. Create a new line by pressing Enter.
We need to construct a list of dates from the first date all the way up to the end date. We’ll call those dates LD and we’ll use the function List.Dates.
The first parameter of this function is the start as date which would be our SD. Then, it wants a count as number or the difference between the start date and the end date. We can get that using the Number.From function followed by (ED – SD) + 1. Note that the “+1” is not shown in the next sets of screenshots, but there should be a +1.
The third parameter is called the step as duration and we want an increment of one day. We can get that using Duration.From (1).
We’ve created a list with dates from the very first start date up to the stop date. What we want next is to create a list of times that goes along with that.
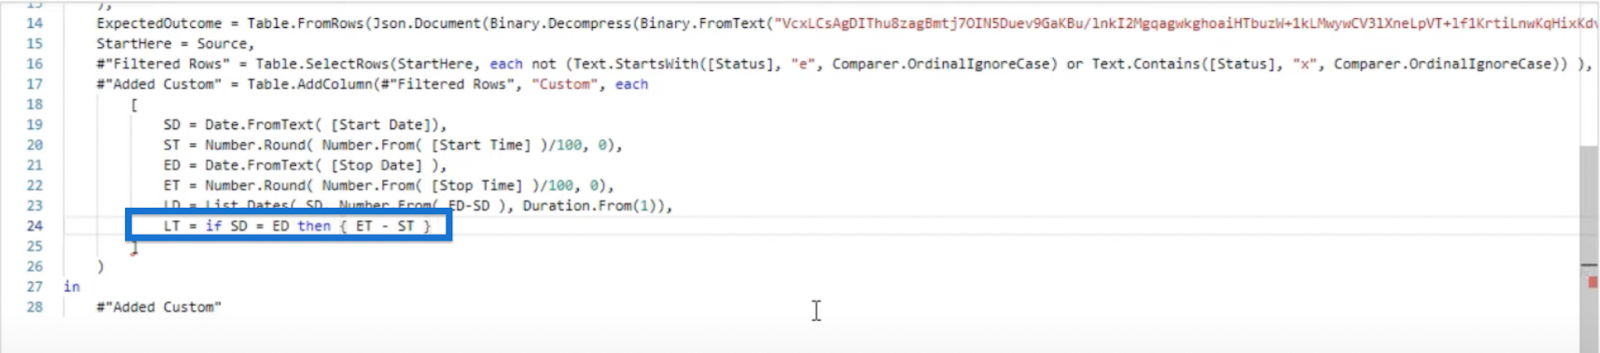
Let’s call this LT for list times. LT can have a day period of a single day which requires a slightly different logic than if it spans across multiple days. So that’s something that we have to create a condition for.
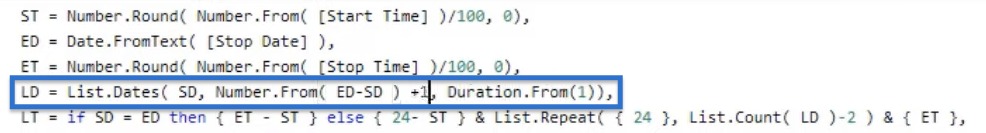
We want the condition to say “if our start date is the same as our end date, then end time minus the start time.” The results should be in a list of format so we use the list initializer represented by { }.
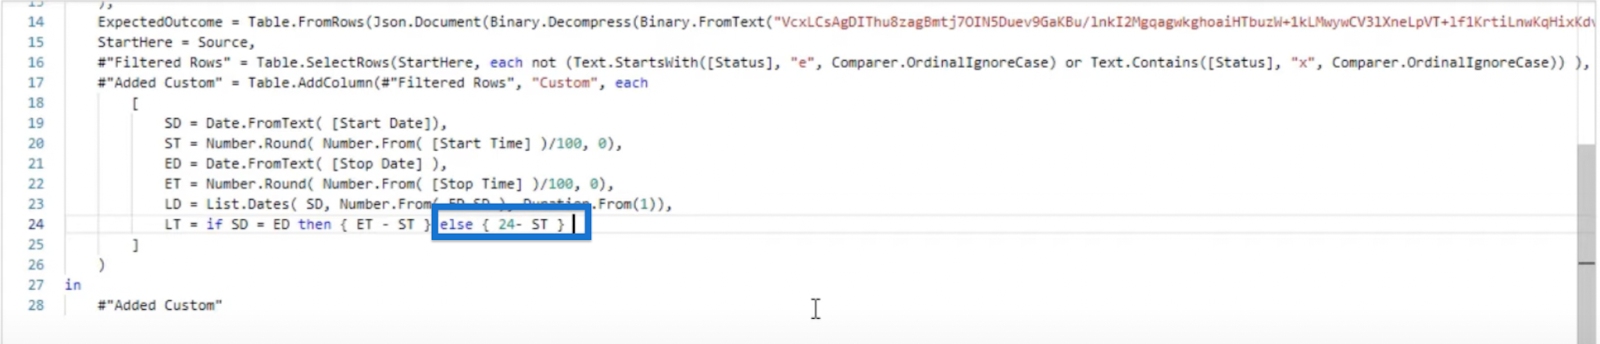
Now, if we have a date range that spans multiple days, then the first date will be 24 minus the start time. We will add this to our condition as the else statement. Again, format that as a list using the curly brackets.
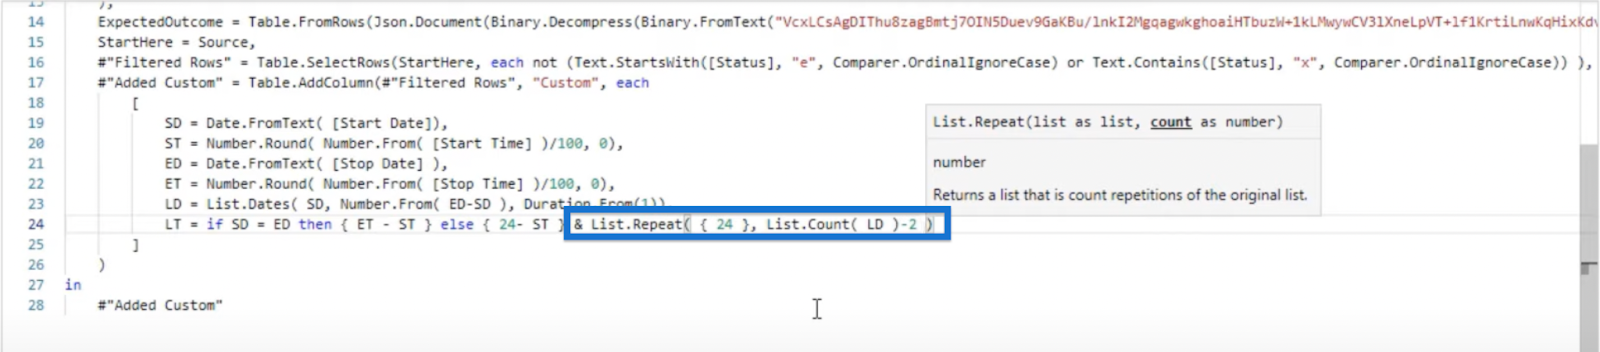
At this point, we haven’t accounted for the other whole days so we’ll use the ampersand symbol (&) to append multiple lists. For each whole day, create a list with the value 24 representing the 24 hours we have in a day. We’ll use List.Repeat for that.
With the List.Repeat function, create a list that contains 24 and repeat that a number of times by counting the number of days in LD. To achieve that, use List.Count (LD) then subtract 2 because we have a separate list for our start date and we’ll create another list for the end time.
In essence, this will create a list with only 24 hours for each whole day.
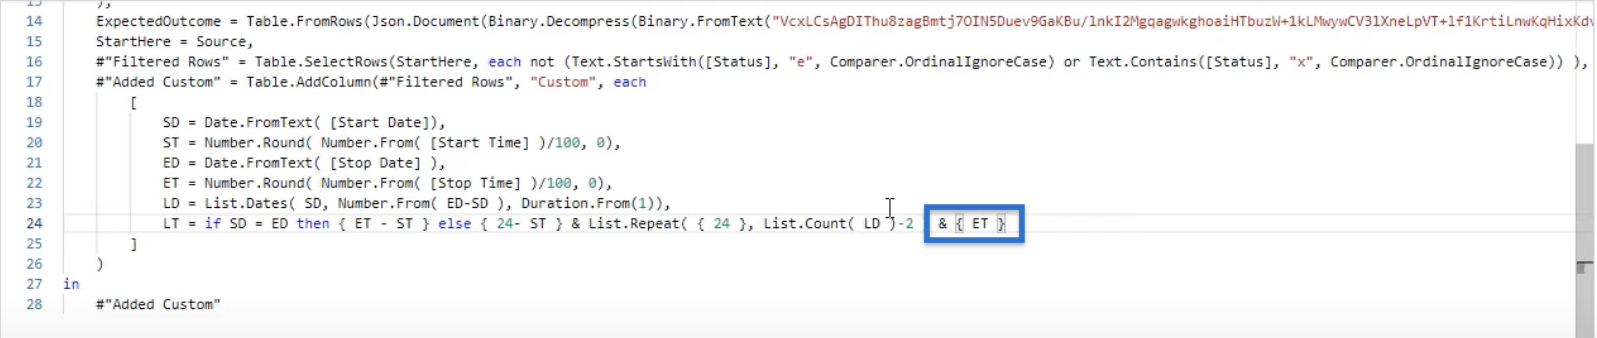
For the end time, we can append it again as a list using ampersand, Then, using the list initializers, let’s call the ET.
So far, we have two big lists—a list of dates and a list of times—with their lengths being equal to one another. From those two lists, we can construct a single table.
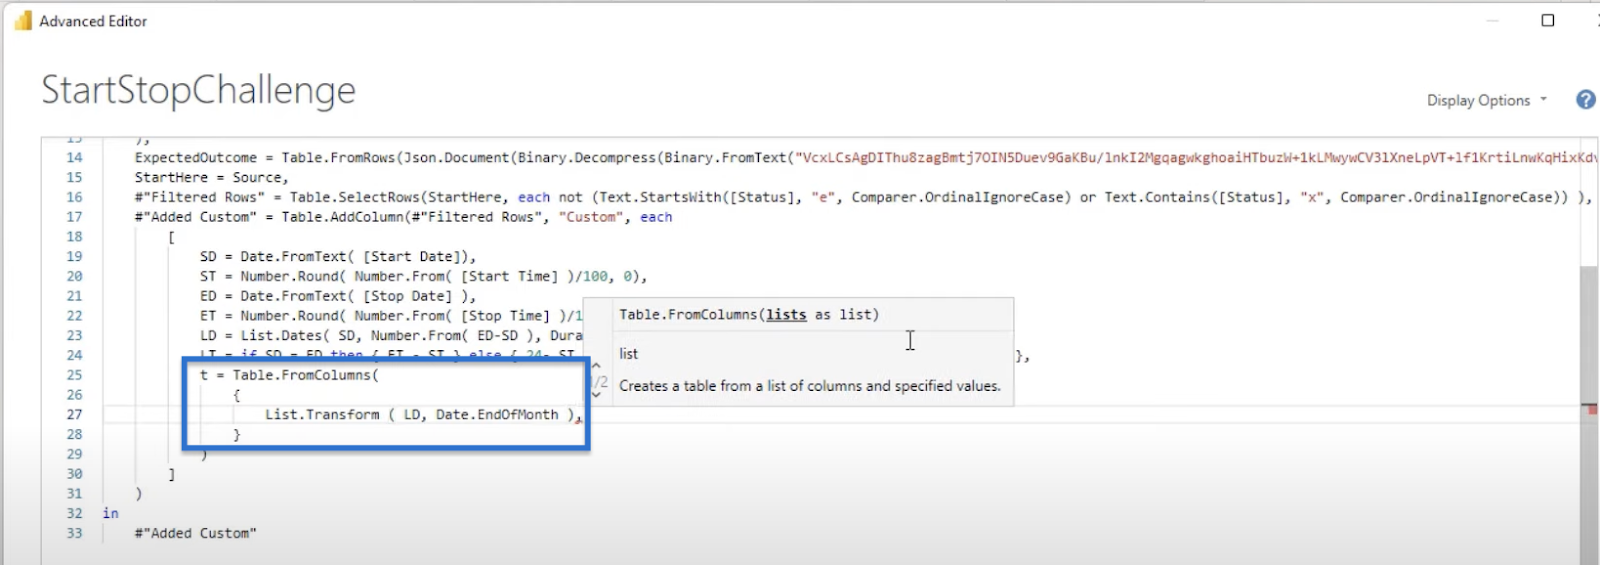
In a new line, create another variable for the table which we’ll call t and use the function Table.FromColumns. This function requires lists as list and we’ll use our LD.
Our LD contains individual dates from the start date up to the stop date. We can transform that list of dates to the end of month date value by passing LD and calling the Date.EndOfMonth function. Then in the next line, let’s get our LT as well.
Press Enter to create another line and set our table as type table. Our table will have two columns, the first column being a date column. So, create a Date column and call the Date.Type function.
The second column will be our Hours column and it will be an integer. Thus, we’ll create an Hrs column and call Int8.Type.
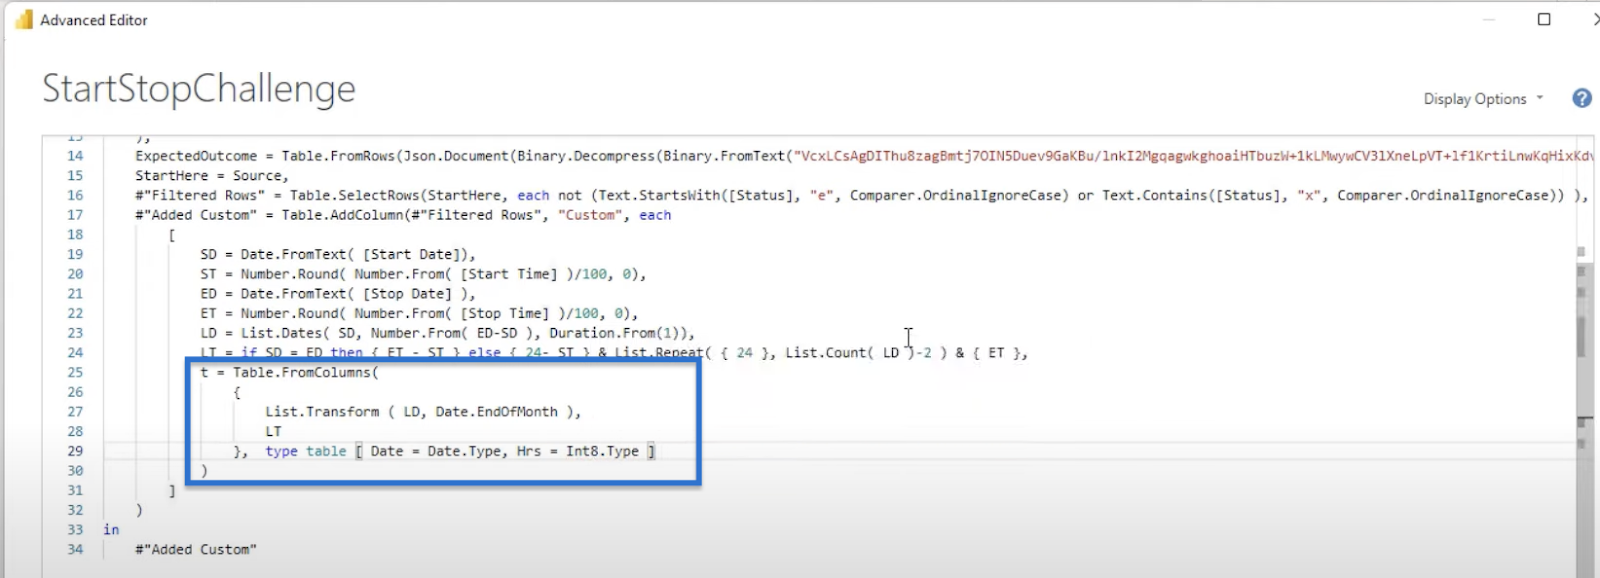
We have the closing bracket to close our record and a closing parenthesis to close our Table.AddColumn function. Click Done and we get a list of records under a Custom column.
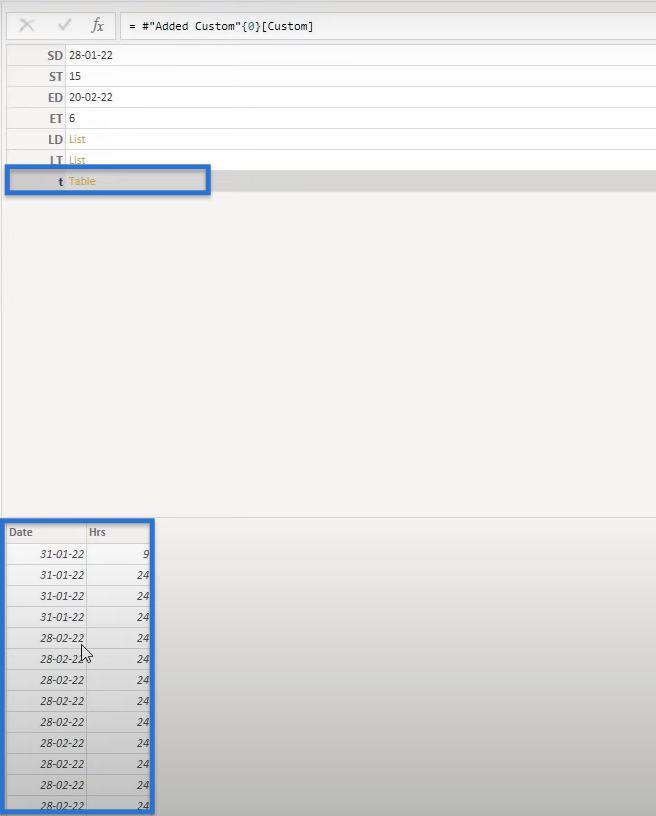
Again, click on the white space beside each Record and the table should open at the bottom part of the screen.

Notice that we have our t Table in the last row. Let’s try to drill into one of the Records. Right click on the first result and Add as New Query.


We will get the same summary as earlier and if we click on the Table, we should get our Date and Hrs values.
But we are primarily interested in the final output table. To focus on that, let’s remove the help query by right-clicking Custom and choosing Delete. Confirm by clicking Delete in the pop-up window.

Once deleted, we can go back to our initial query and again click the white space beside Record. It will show the same results as earlier. But this time, let’s expand the formula bar and call [t] beside our closing brackets.

In the Custom column, we can see that each Record is changed to Table.

Power BI Between-Dates Working Hours: Projection
From the table that we’re looking at, there are only two columns of interest—the staff name and our custom column. We can use projection to retain those two columns alone from this table.
Go to the formula bar, and beside our closing parenthesis, select the fields that we want to keep by placing them inside square brackets. Then press the check mark.

We should get this result.

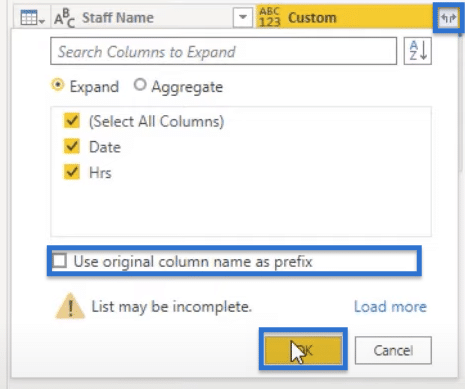
We can expand the nested table by clicking on the arrow icons beside Custom. Uncheck Use original column name as prefix and click OK.
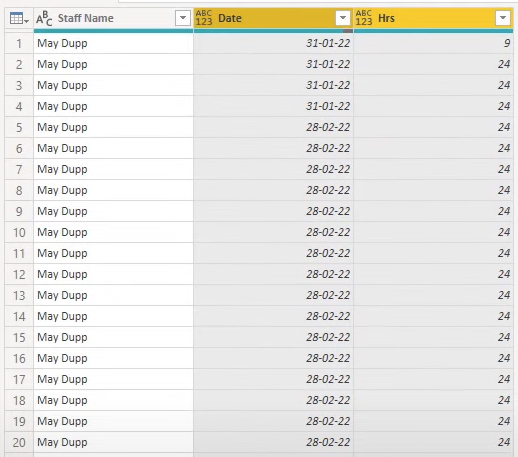
Our table should appear like this.
Power BI Between-Dates Working Hours: Aggregate Values
All that’s left to do now is to aggregate these values. To do that, select the Staff Name column and go to Transform.
In the pop-up window, choose Hrs under the Values Column because it’s what we want to aggregate. Then, select Sum under Aggregate Value Function. Then click OK.

Our final output will look like this.

***** Related Links *****
Creating A Date Table In Power BI The Fastest Way Possible
Time Comparison For Non Standard Date Tables In Power BI
DateTime Value: How To Strip Off Seconds
Conclusion
In this blog, you’ve seen one approach to Access Analytic’s Start Stop Challenge. You learned how to calculate the total number of hours worked by each staff member in a month, and how to deal with possible typos in your data.
With this technique and Power BI, between-dates working hours can easily be calculated in your own organization, or as a practice to deepen your Power BI knowledge and skills.


