
In this tutorial, we’ll be talking about connecting our app to multiple Power Apps data sources.
We already learned about how to connect a single data source to our app in a previous tutorial, and have been using that same source as we created our own app from scratch. But in most cases, you’ll need data from multiple sources. If you enroll in our Power Apps Masterclass, for example, you’ll see that there are several Excel files there that will be used as sources.

Setting Up Your Data Source
When we started building the app we’re going to use today for our example, we immediately linked a data source from our OneDrive. Now, let’s add another data source on top of that.
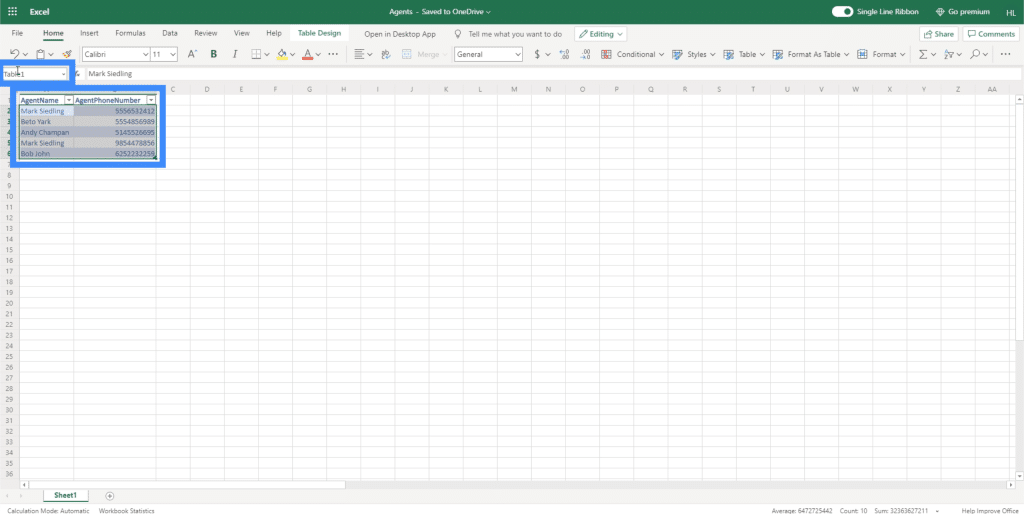
Let’s say our new source is an Excel workbook in OneDrive. It contains data about our agents.
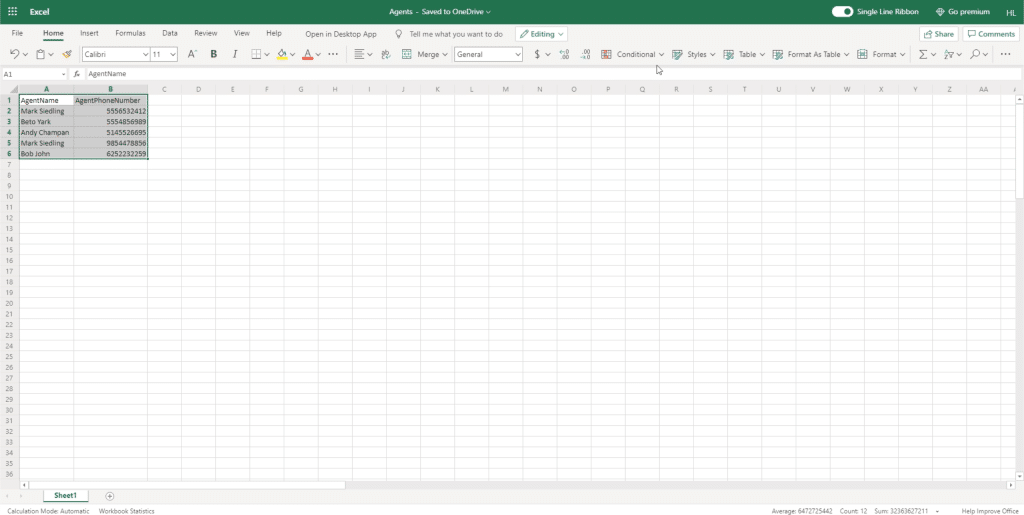
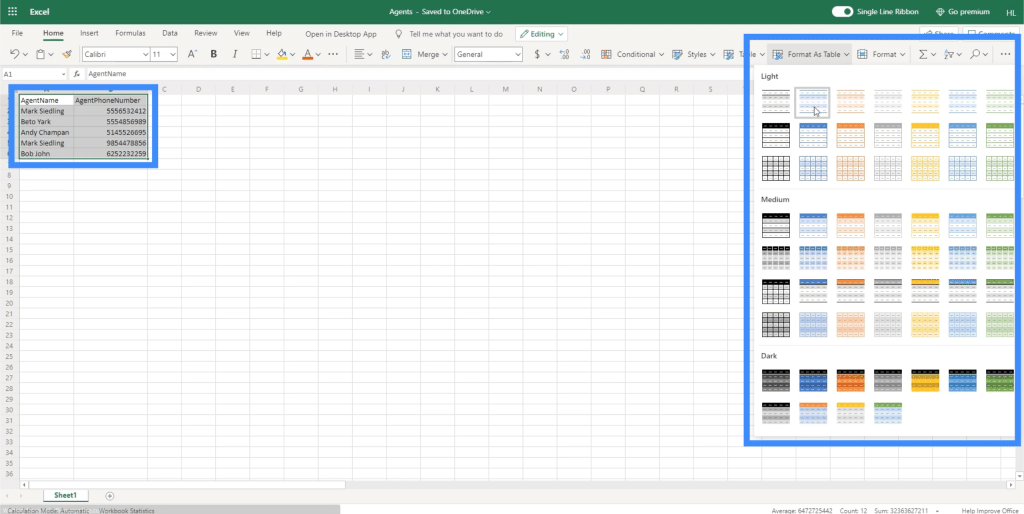
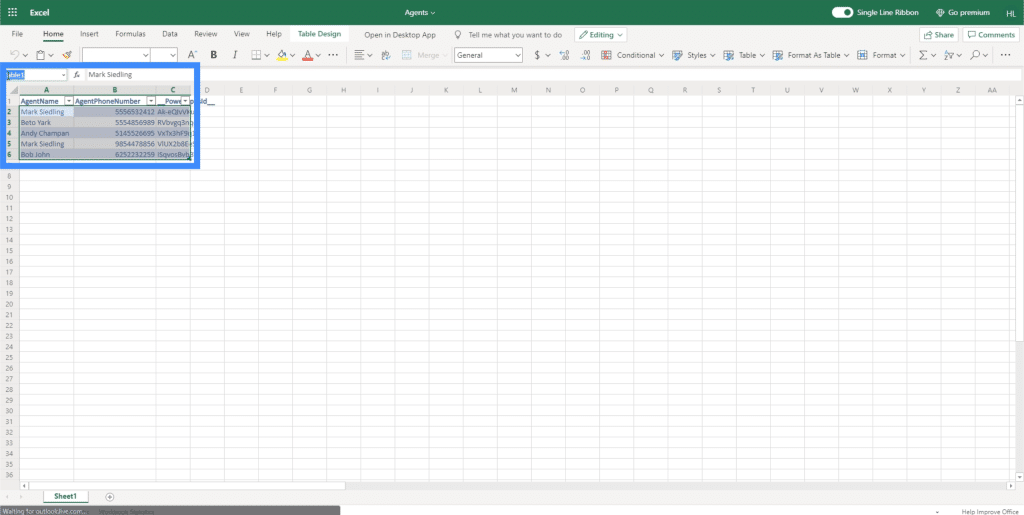
By default, Power Apps looks for tables to use when we link a data source. So we’ll highlight the data we’re working with and click on the Format As Table button. It doesn’t matter what theme we choose here since we’re only going to use it as a data source, so we can click any theme here.
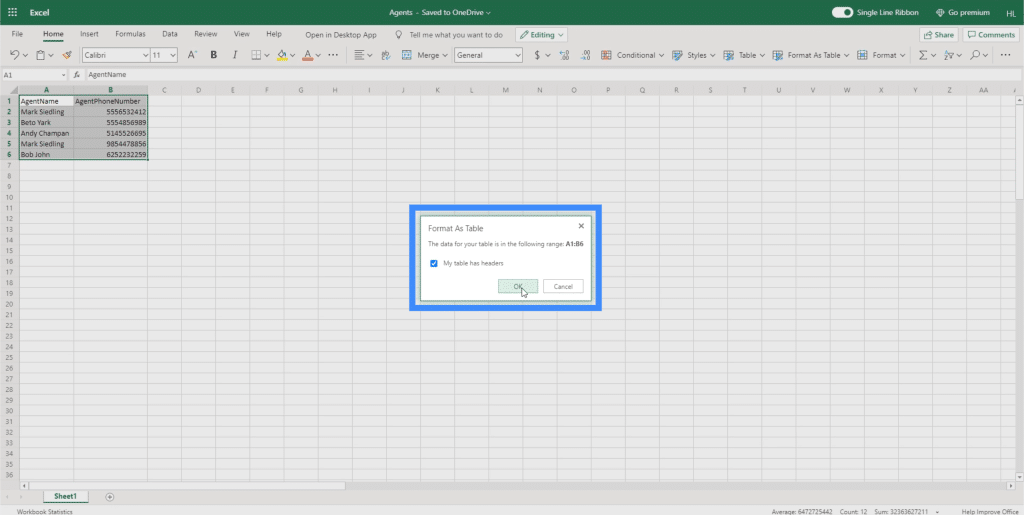
Since our table does have headers, we’re going to tick off the box here before clicking OK.
Once we do that, you’ll see that our table has now been formatted as a table.
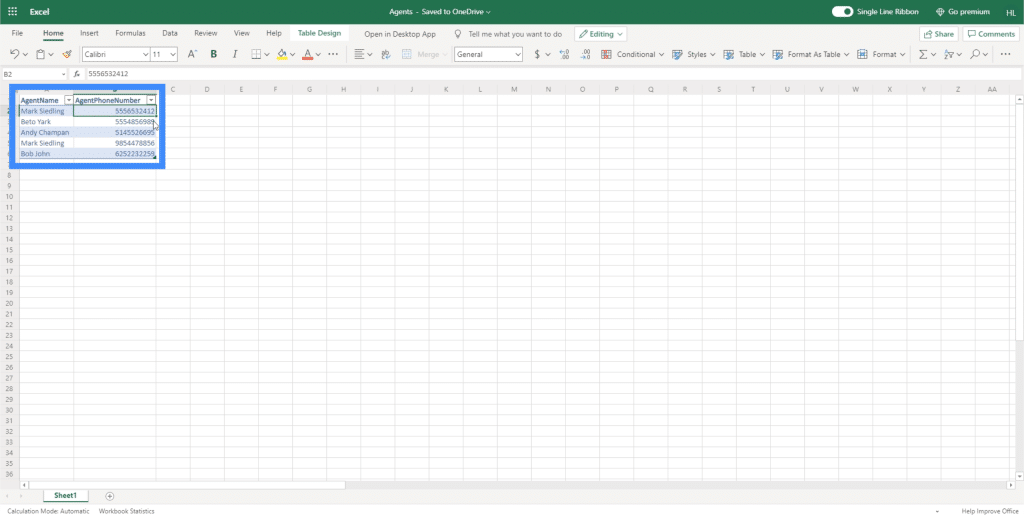
To confirm that we’ve done it correctly, it should say Table at the upper left side when we highlight the rows included in the table.
Now that we’ve set up our data source, it’s time to link it to our canvas app. Make sure you close the file before attempting to connect it to Power Apps.

Connecting Power Apps Data Sources
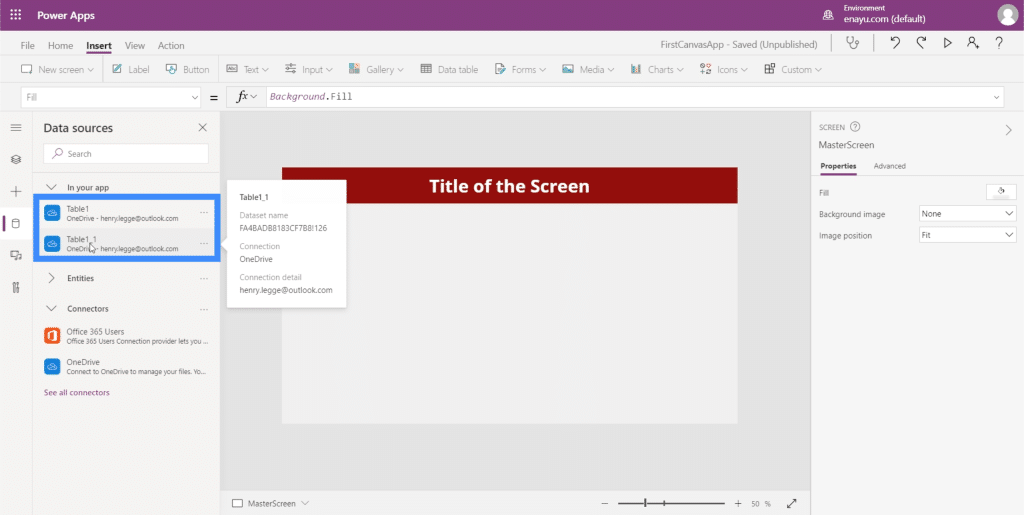
We can add Power Apps data sources through this cylinder icon on the left pane. Clicking on it will show the data sources we’re working with and allows us to add more.
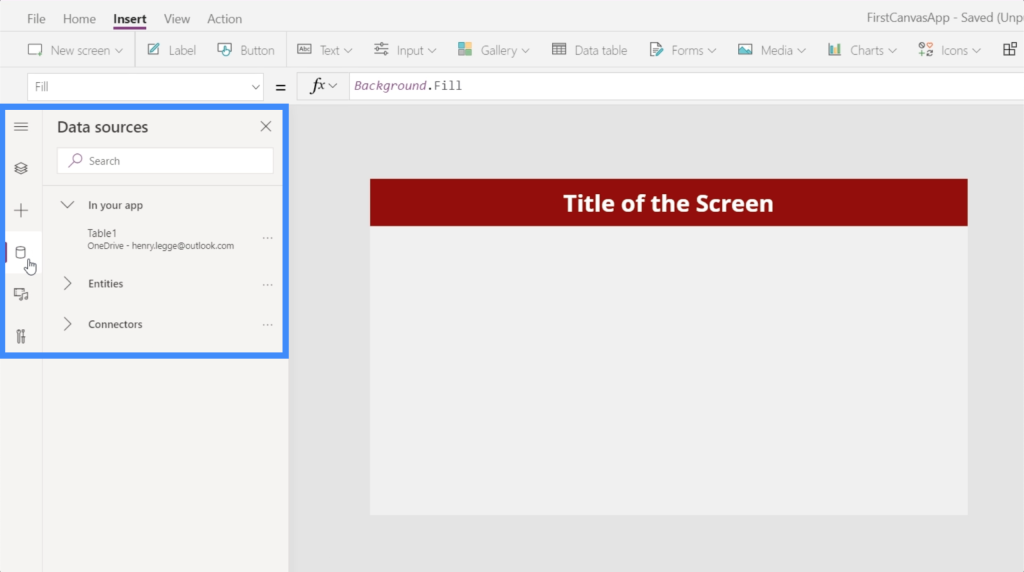
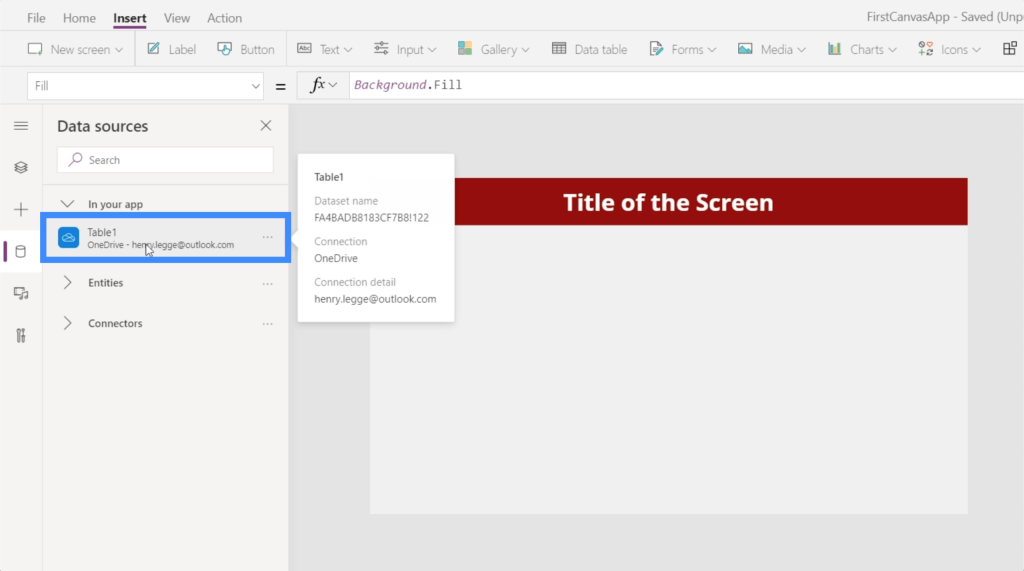
Currently, it shows that we’ve already connected Table1 to our app. This table is coming from OneDrive.
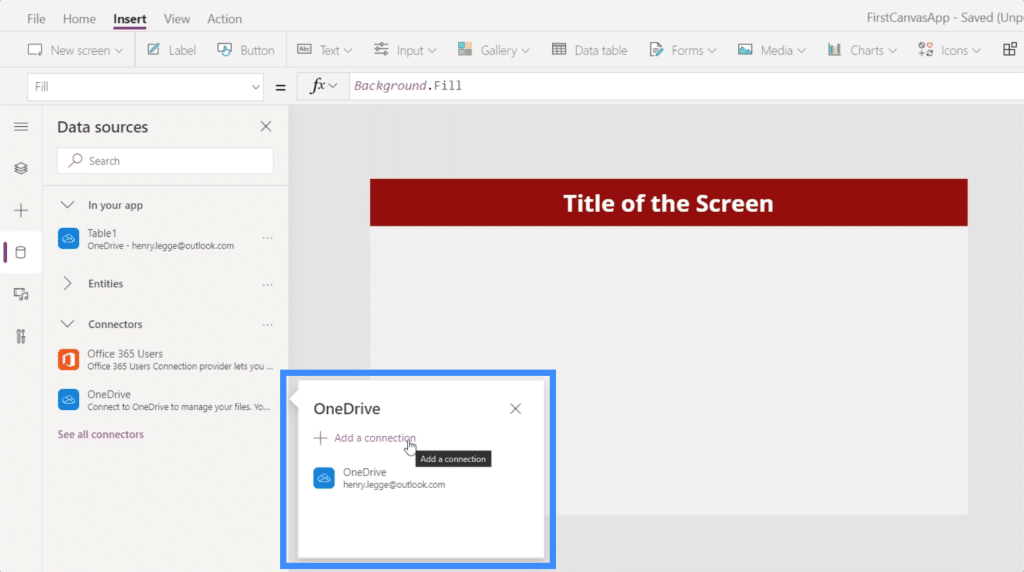
Now, let’s import the new data source we worked on earlier. Since we saved that in OneDrive, we’re going to choose OneDrive here under Connectors.
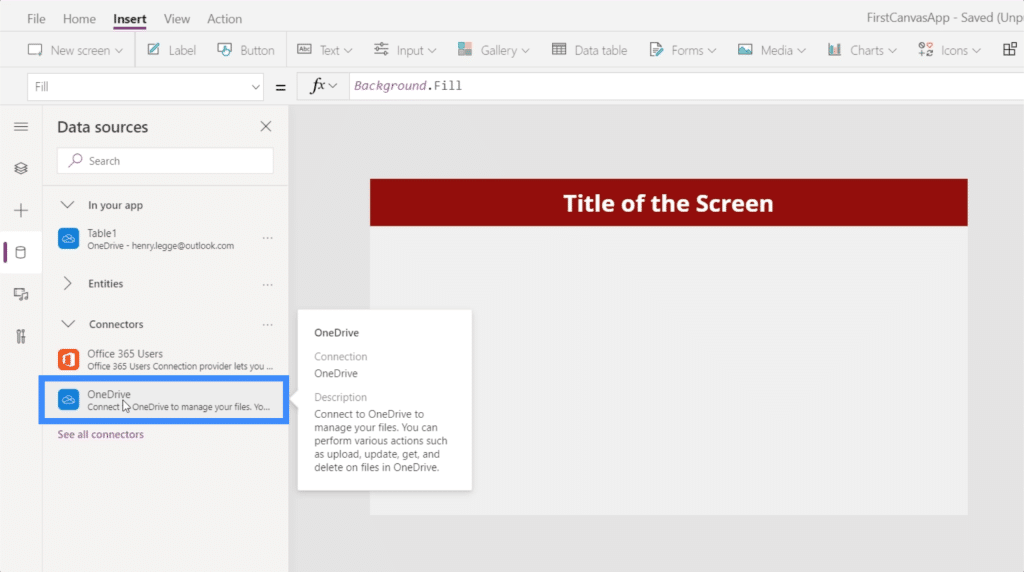
This will open up a window where it shows us the OneDrive accounts we can source our data from. Note that it’s also possible to import data from other locations like Google Sheets or SQL. All you need to do is click on Add a connection in case the right location isn’t showing up on the list.
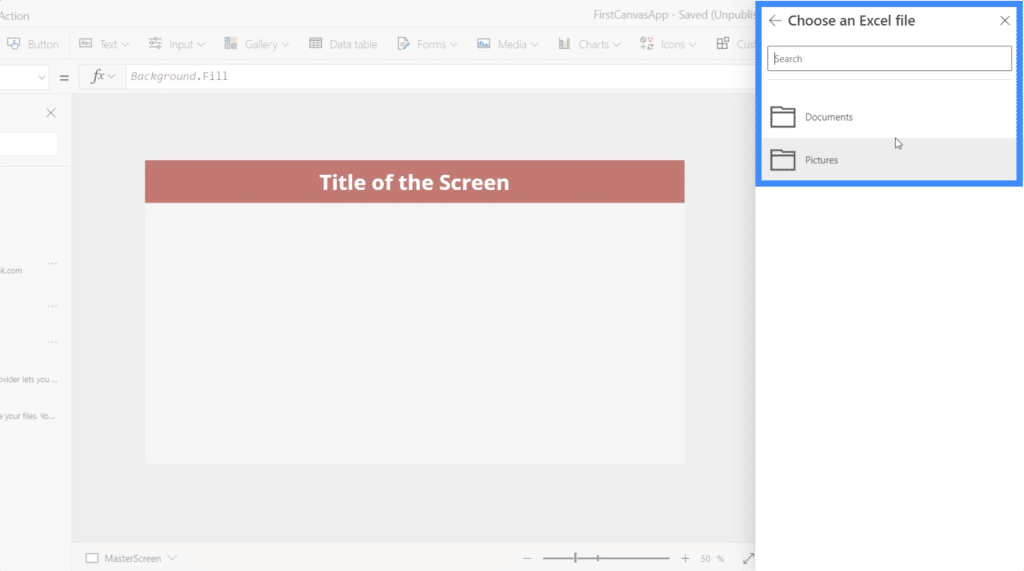
Once we click on OneDrive, it will ask us to choose a file. It will also show any folders or sub-folders we have in the drive-in case the file we need is inside one of these folders.
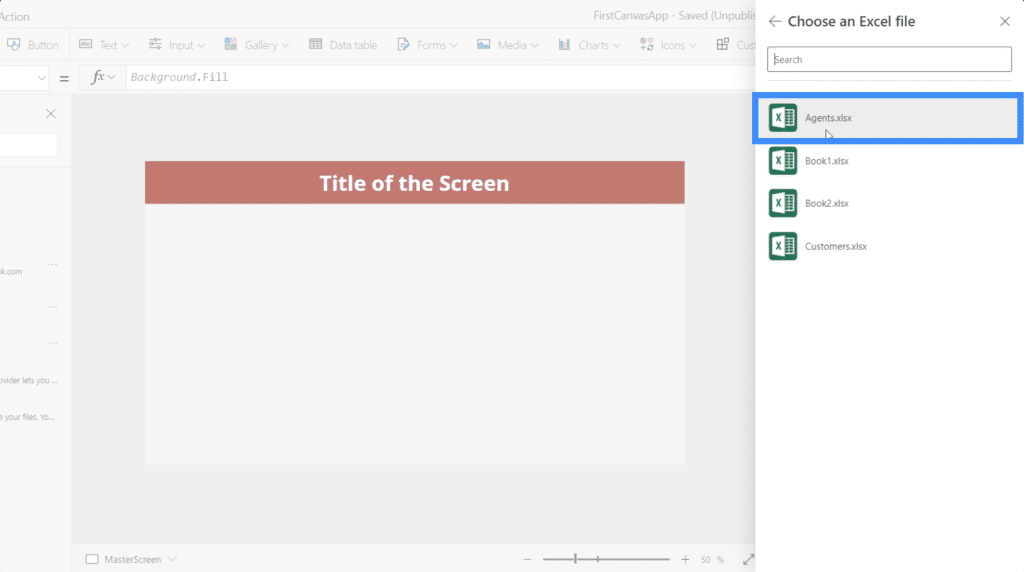
The existing data source called Table1 that we saw earlier is coming from the Excel file here named Customers. Since the new data that we want to use is coming from the file named Agents, we’re going to click on that.
Doing that will show us the tables that we can use within that file. In this case, we only have Table1, which is the table we created earlier. Click Connect once the right table has been chosen.
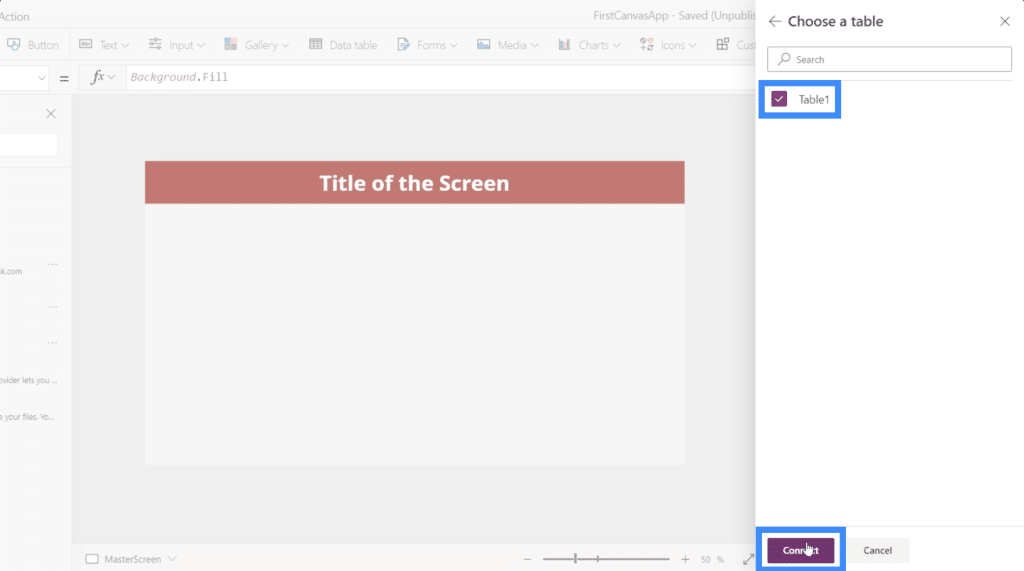
Since we already have an existing Table1 as a source, the new one we connected to our app is automatically named Table1_1.
For other users, this might be confusing. So make sure that when you’re naming your tables on Excel, avoid using the default naming system and give specific names to each table. We can do that by highlighting the table concerned and changing the name in the upper left portion.
Working With Data Tables
Now that we’ve connected a new data source into our app, let’s use the data in it by creating a data table. A data table is just like any other table with columns and rows.
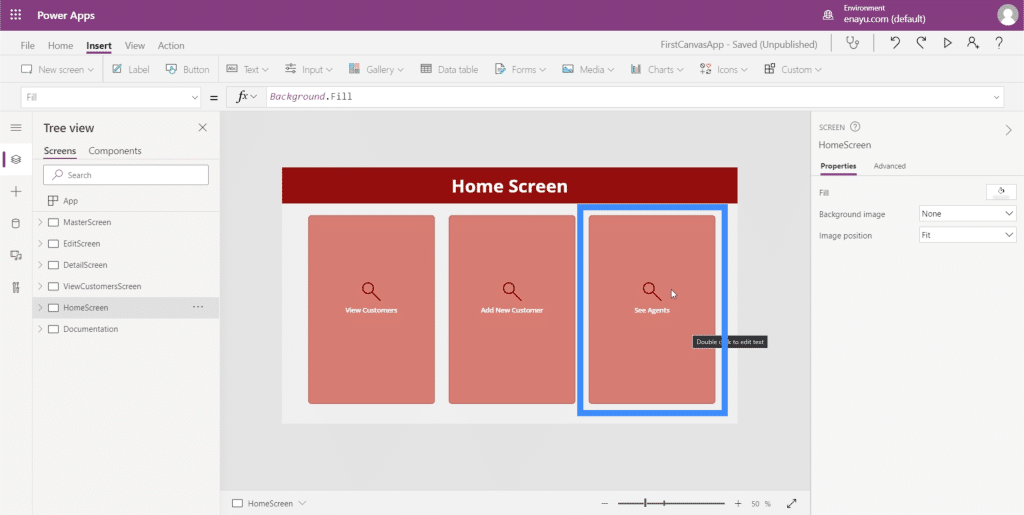
In the home screen of the app that we’re working on, we already have functional buttons for viewing and adding new customers. We worked on these in previous tutorials. However, this button that says “See Agents” is still not functioning. This is where we’ll be using our new data.
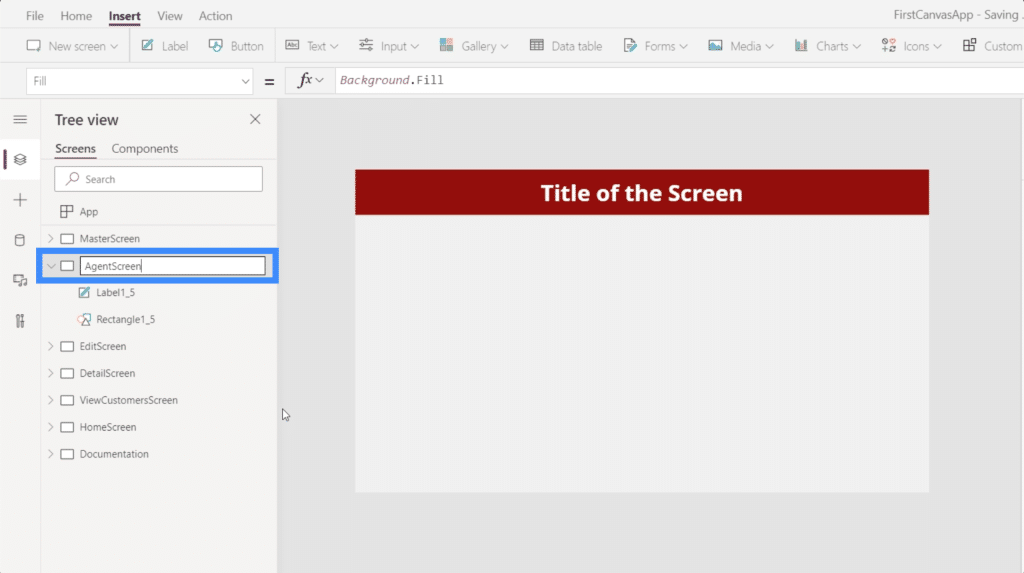
Let’s start by creating a new screen. We’ll duplicate our master screen, which serves as our template for all the screens in this app.
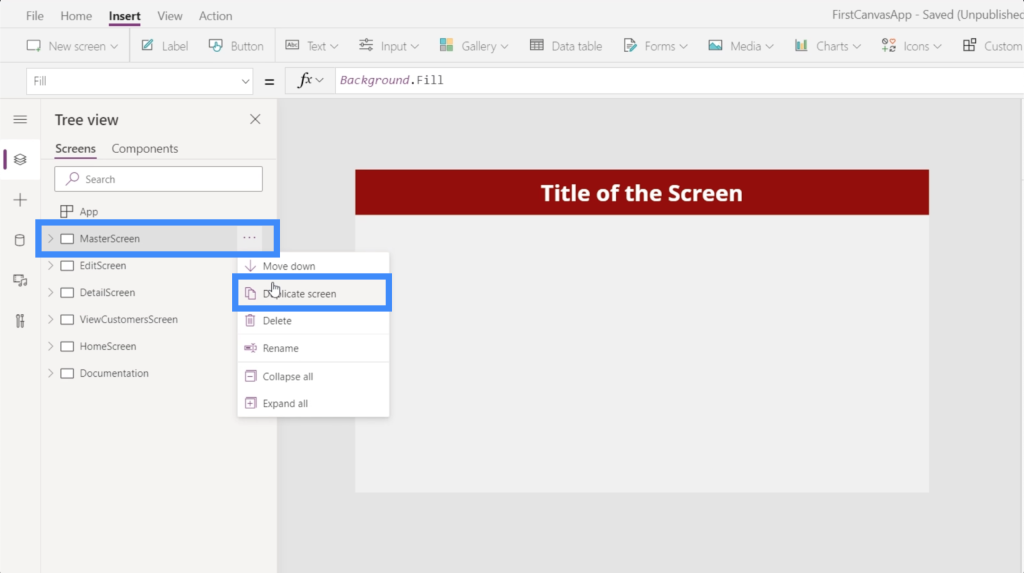
We’ll call this screen our AgentScreen.
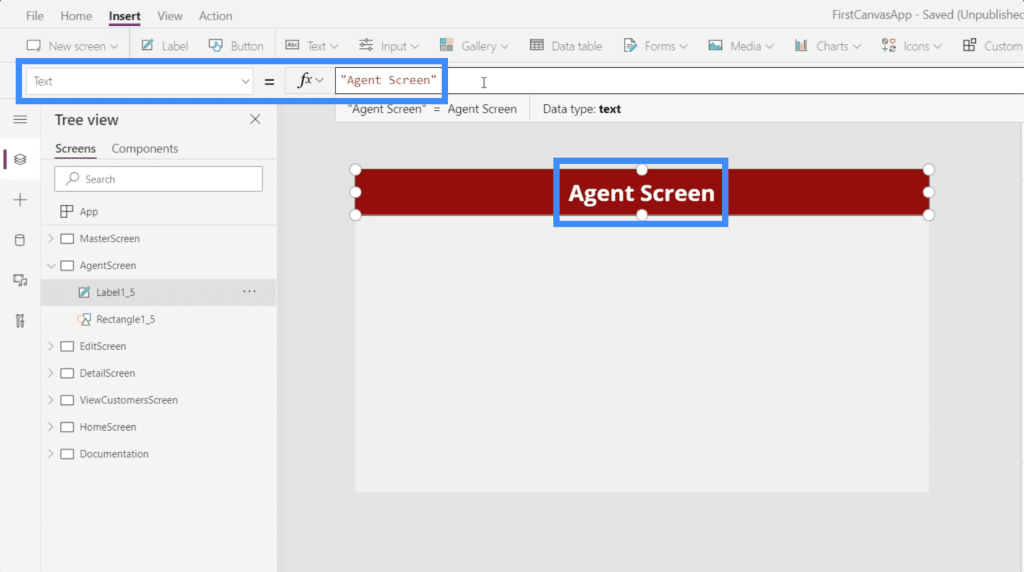
We’ll also change the text on our header to Agent Screen.
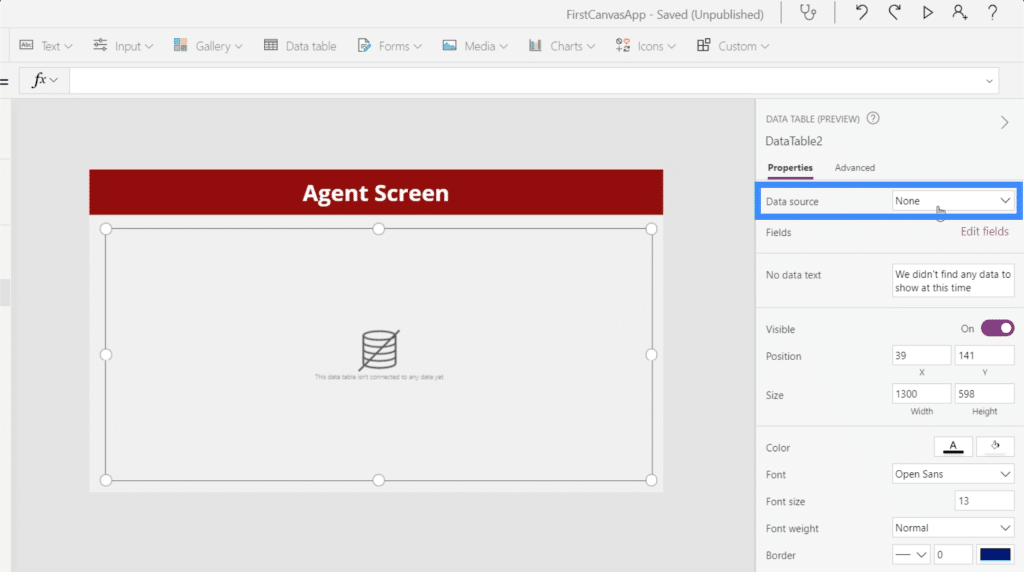
Next, let’s add a data table. This can be found under the Insert ribbon.

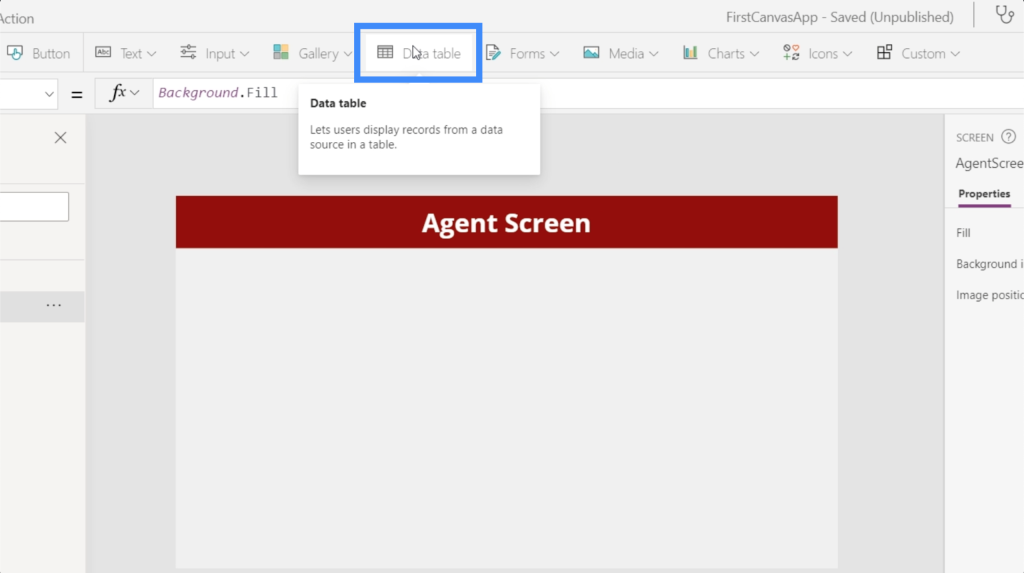
A data table only displays information to the end user. Unlike forms which allows end users to edit some of the data, tables can only be viewed.
Data tables can be resized by dragging on any of the guide points. In this case, we want our data table to use up the entire screen.
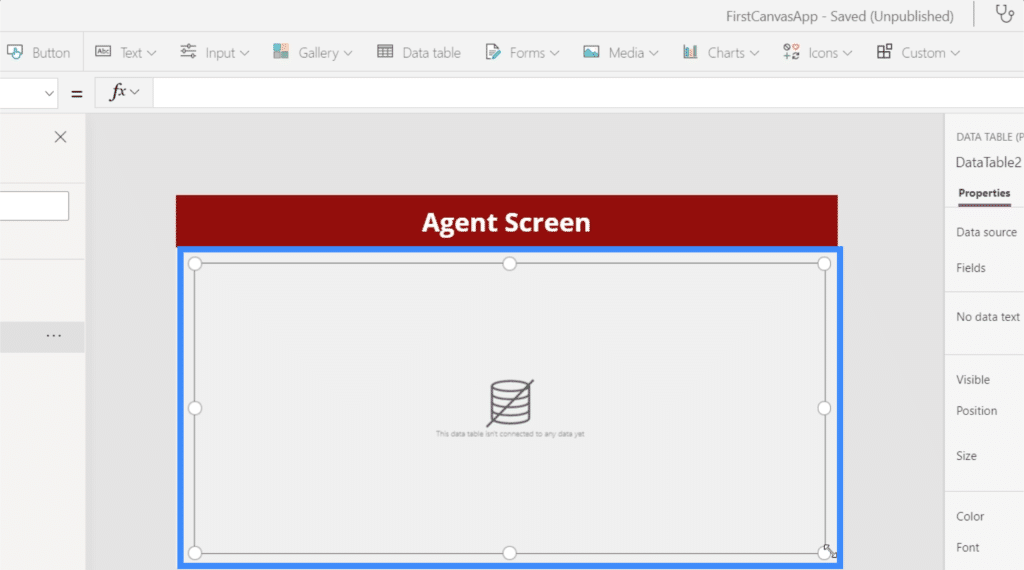
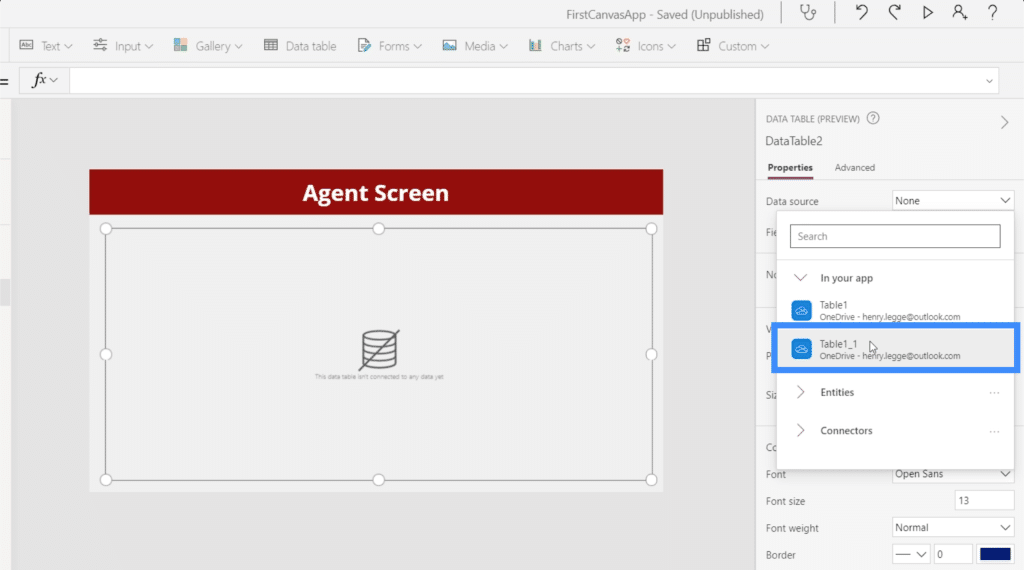
Now, let’s add a data source to our table. We can do that by clicking the dropdown beside Data source under the Properties pane on the right.
We’ll choose Table1_1.
Then, we’ll click on Edit fields so that we can start adding the fields we want to show up in our table.
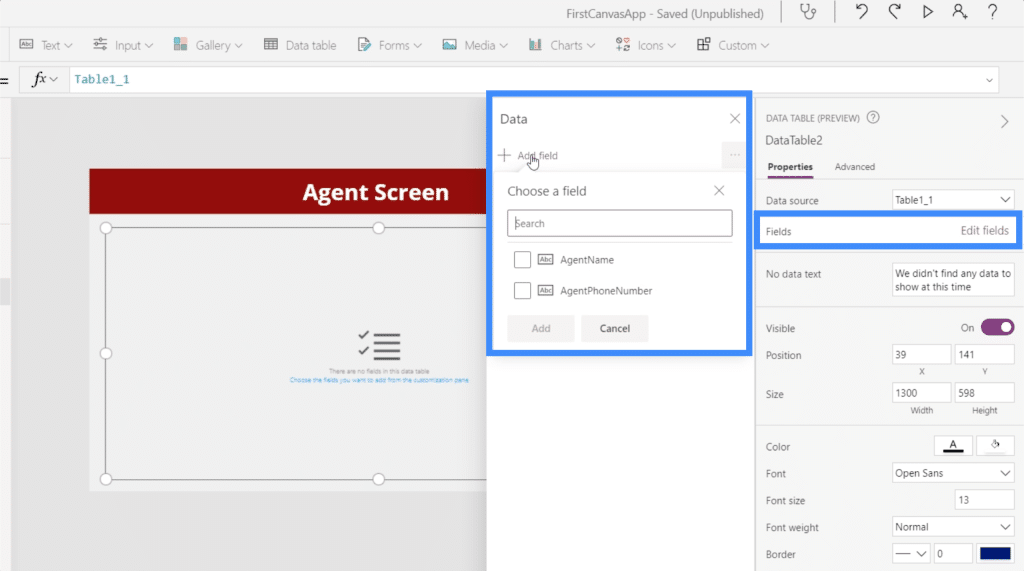
We’re going to need both the AgentName and the AgentPhoneNumber, so we’ll choose them both and add them to our table.
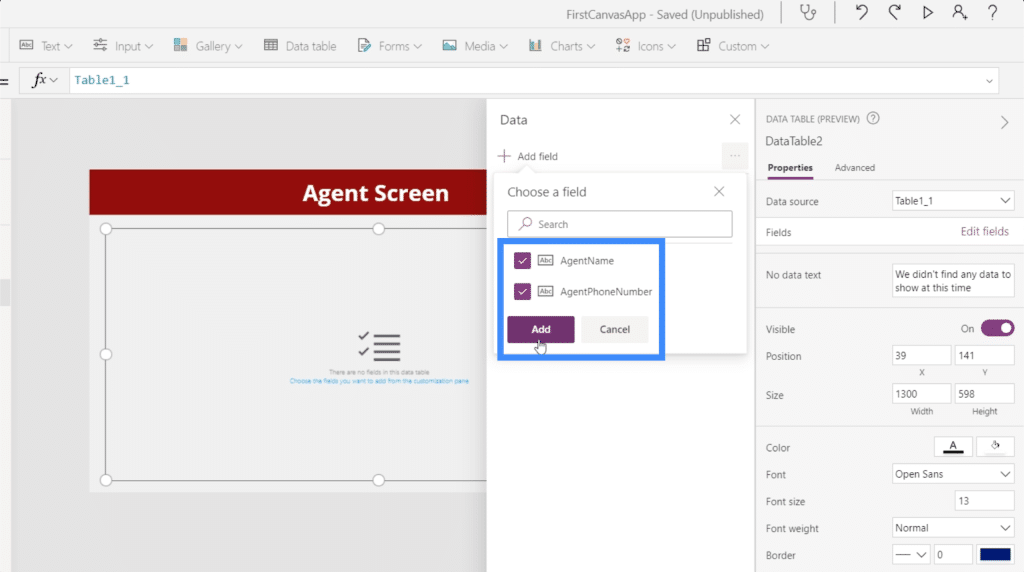
Once we’ve chosen our fields, the data will automatically populate the table.
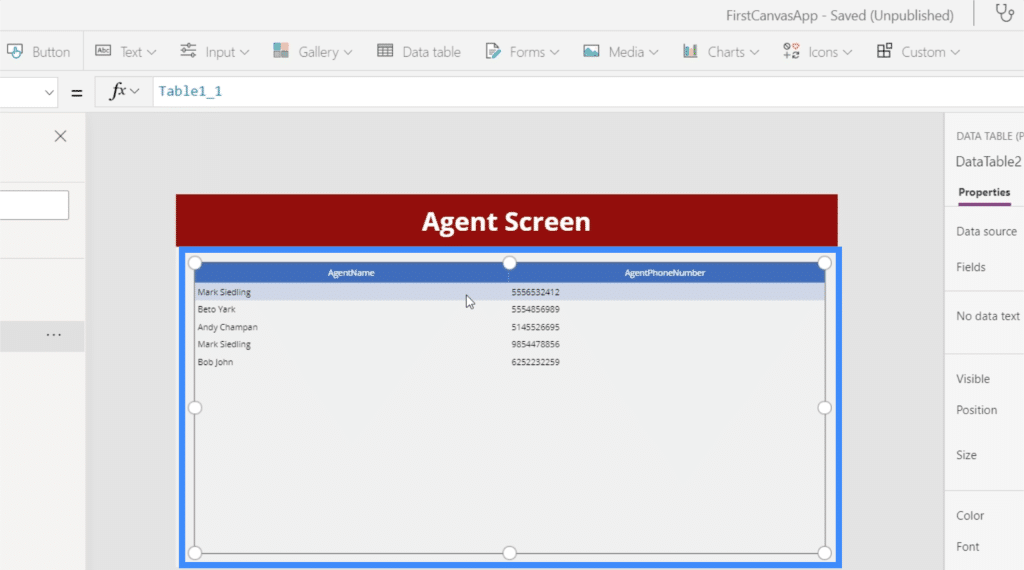
As you can see, data tables are just like any other table that we make on Excel or Google Sheets. The only difference here is that end-users won’t be able to change anything and will only be able to view the data displayed.
Customizing Data Tables
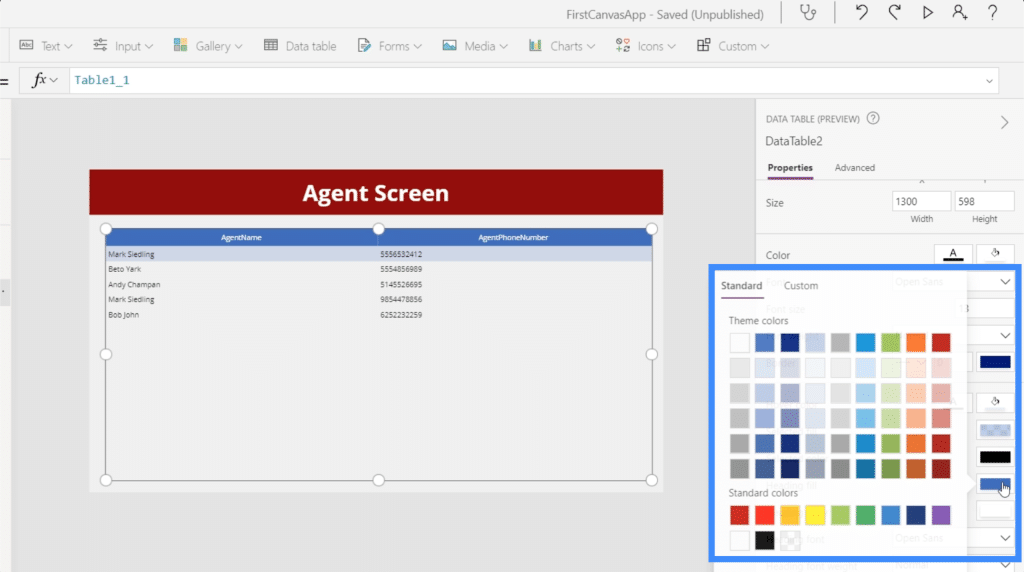
Data tables can be customized in so many ways. For example, we can change the colours so that they are more in sync with the app’s overall theme.
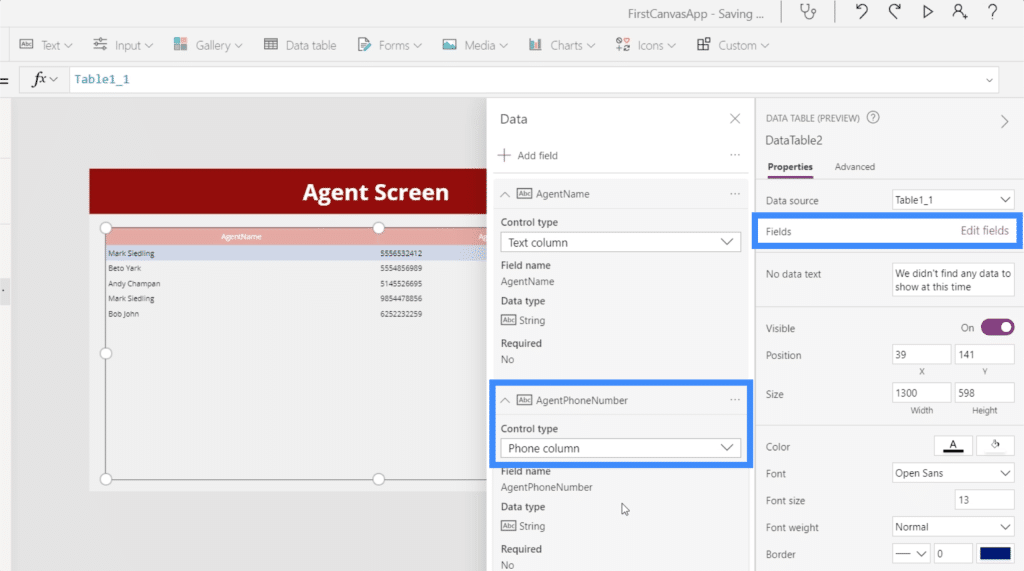
We can also change the format of the data displayed under each field. Under AgentPhoneNumber, for example, we can change the control type to Phone Column so that the data shows are treated as phone numbers.
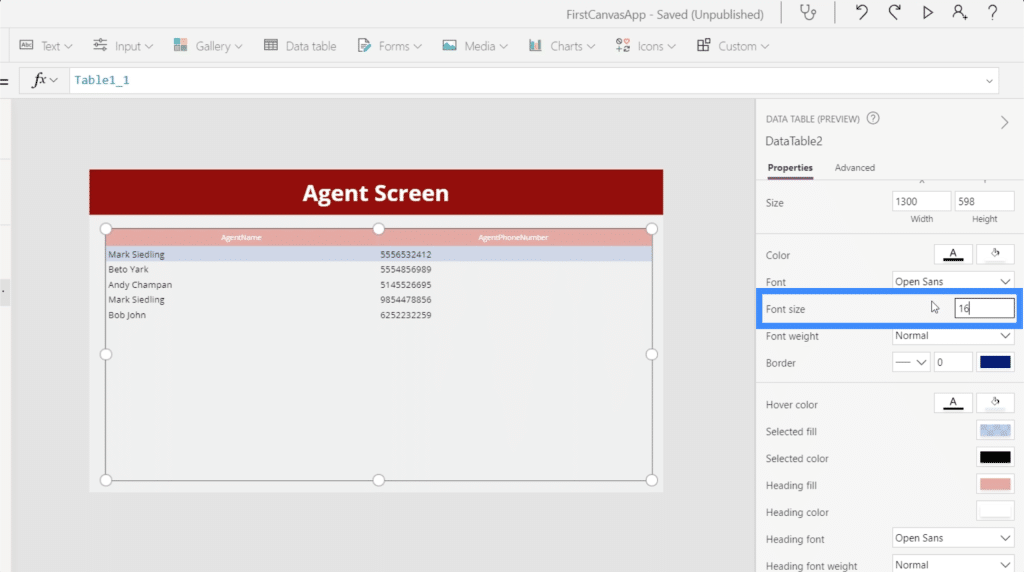
We can change the font size and make the letters bigger to make it easier for users to read the information given.
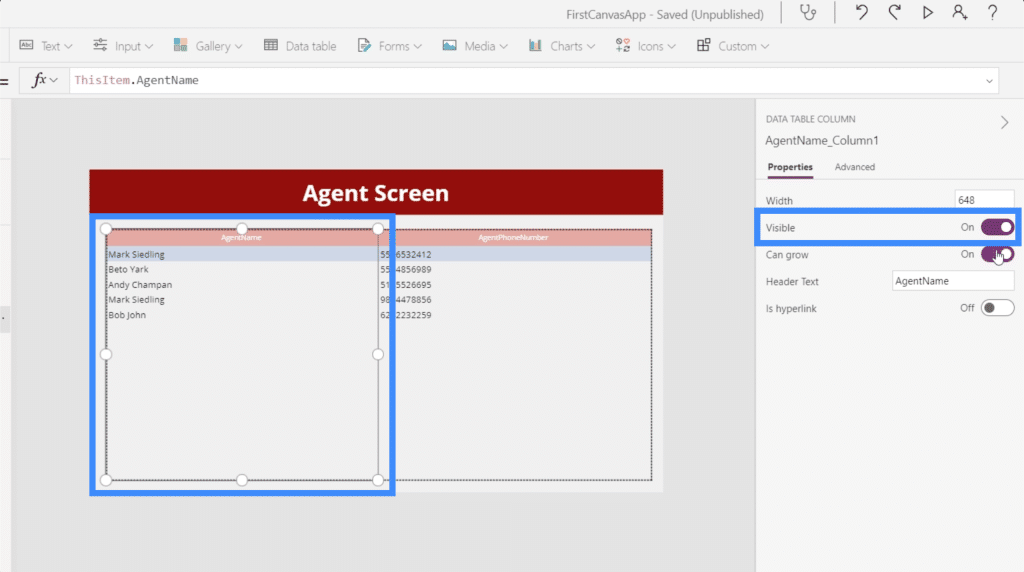
Aside from the customization options for the entire table, it’s also possible to just highlight one column and change its settings. For example, we can click on the AgentName column and change its visibility.
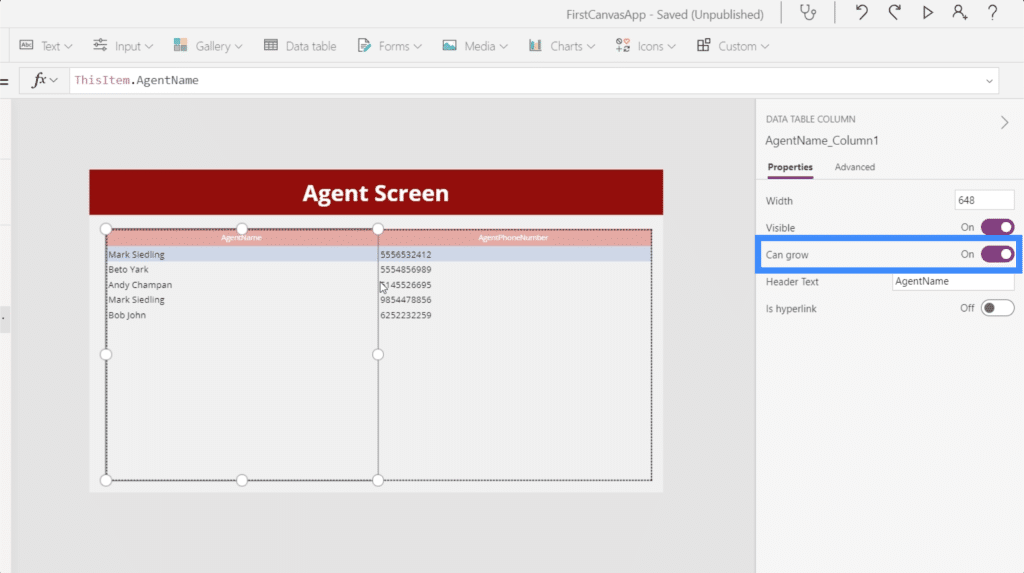
We also have the grow function, which determines whether the column would adjust its width if an entry is longer than the allotted space, or if it stays as is.
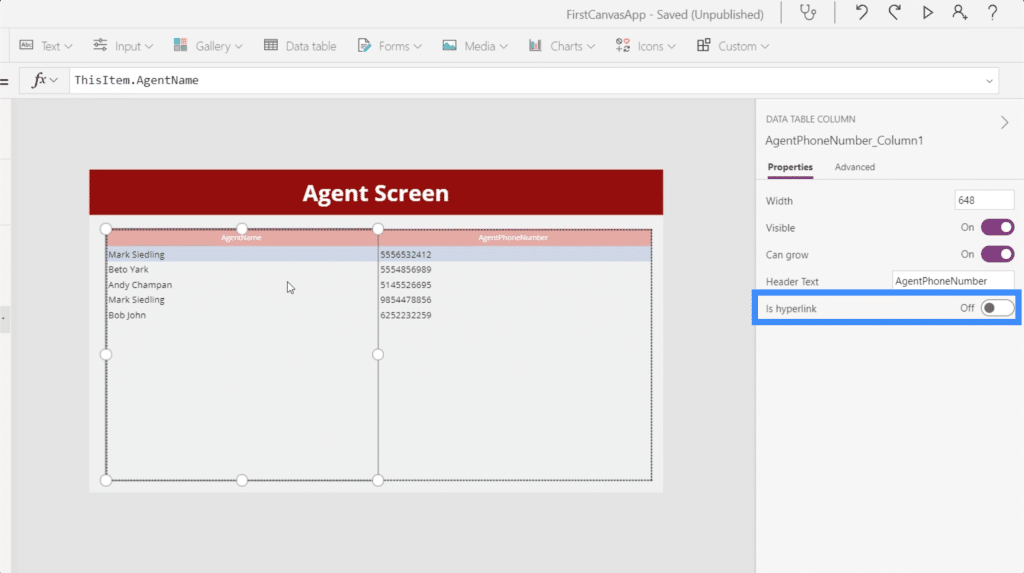
There’s also a toggle here that allows us to add hyperlinks.
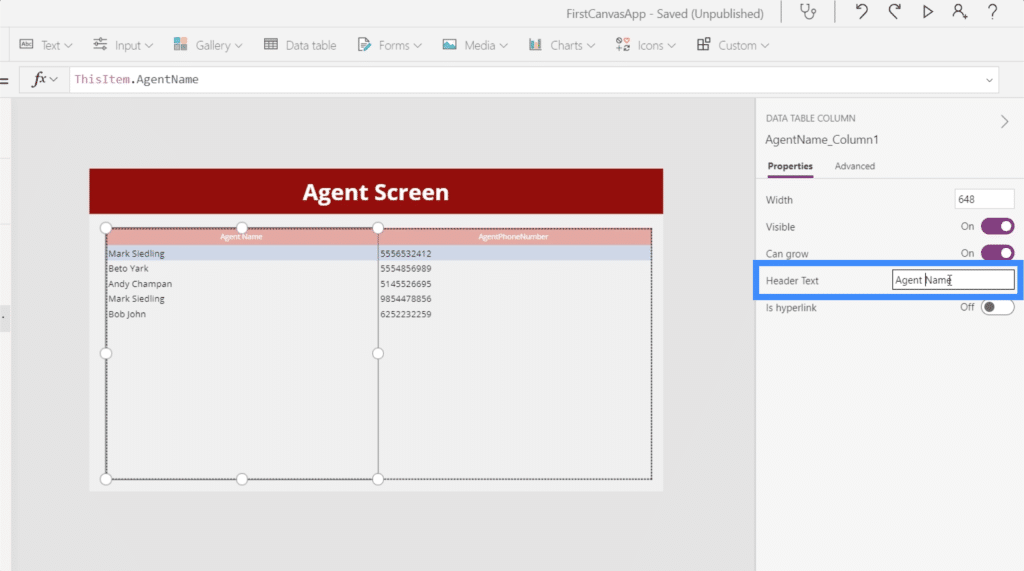
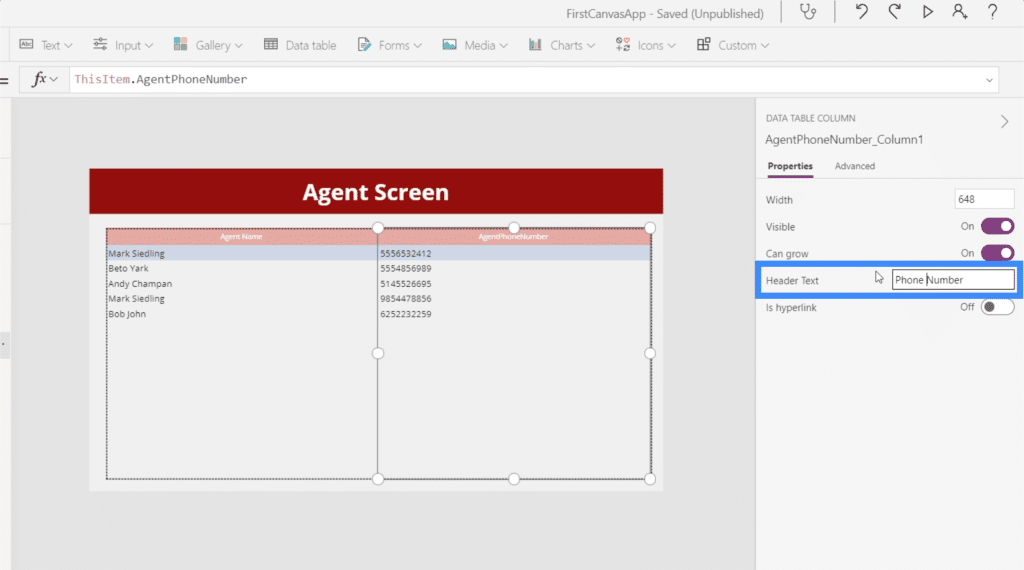
We can also change the names of the headers. In this case, for example, our headers have no space, making it a bit difficult to read. So let’s make the first column Agent Name instead of AgentName.
Then let’s change the second column from AgentPhoneNumber to just Phone Number.
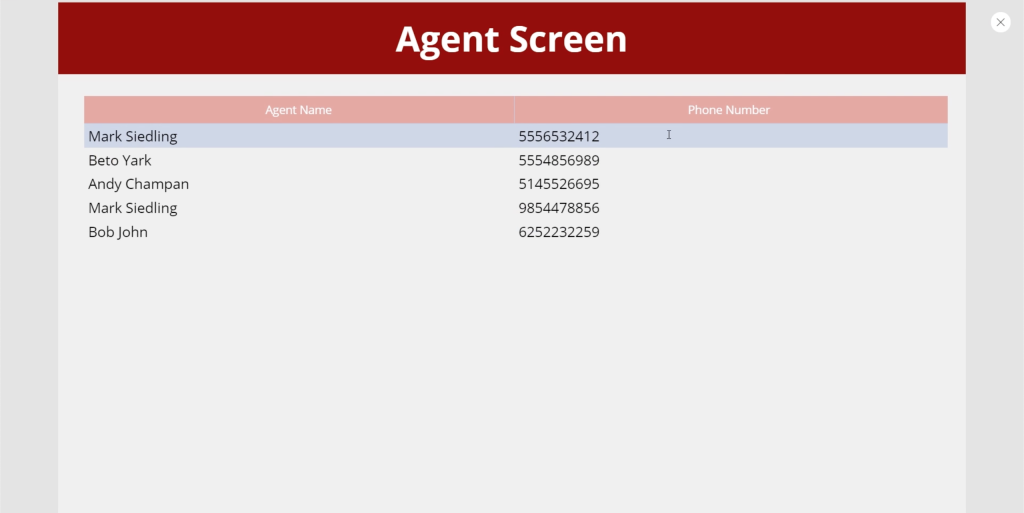
Now that we’ve made all the changes, this is how our data table looks like.
Adding Navigation To Data Tables
We want to make sure that end users are able to land on our agent screen from the home page, and return to the home screen from the agent screen as needed. So let’s add some navigation to allow that.
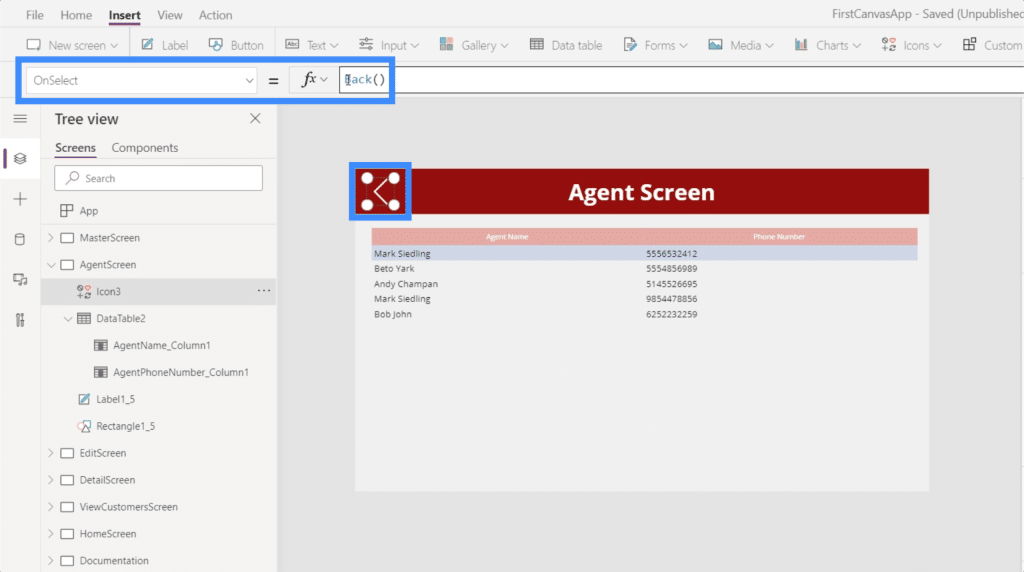
First, we’ll add the left arrow icon here to serve as our back button. We’ll then set its OnSelect property to Back(). This means that users who click on the icon will be led back to whatever screen they came from before landing on this screen.
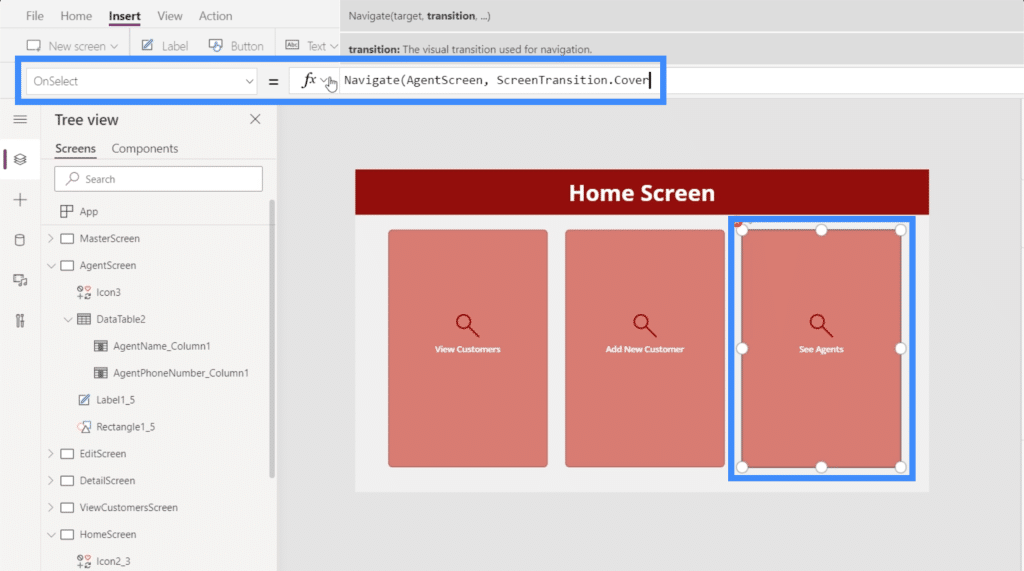
Then, let’s set up navigation for our See Agents button here in the home screen.

With the button highlighted, we’ll use the Navigate function on the button’s OnSelect property and reference the AgentScreen. Let’s also add a screen transition to add a cover effect when we switch screens from here.
***** Related Links *****
Power Apps Introduction: Definition, Features, Functions And Importance
Power Apps Environments: Setting Up The App Elements Properly
PowerApps Functions and Formulas | An Introduction
With the navigation in place, end users can now easily see the table containing the agents’ information by clicking on this button on the home page.
Conclusion
Working with multiple Power Apps data sources is inevitable especially if you’re part of a big organization where you deal with customers and agents across different locations. It’s a good thing that Power Apps was designed for ease of use. Seeing the entire process in this tutorial, we have once again proven that adding multiple sources only takes a minute or two.
We also saw how data tables are helpful in displaying all the data we’re pulling from those sources. Now, it’s only a matter of choosing between data tables or galleries when displaying information. Basically, data tables are good for records that you only want to display, but galleries and forms would be more useful if you want end users to have the ability to edit information.
All the best,
Henry


