
This tutorial will walk you through COLUMNSTATISTICS() – a new DAX function, which is almost entirely undocumented. It has been added to Power BI in August 2021. You can watch the full video of this tutorial at the bottom of this blog.
This function can be used to quickly create metadata on every table in your data model, including a list of fields, min, max, max length, and a number of unique values (cardinality) for each field. However, there are some very unique aspects to how this function can and can’t be used, which I also cover in this blog.
I’ve been experimenting with this new DAX function and I want to show you what I’ve found and what I’ve been doing with it.

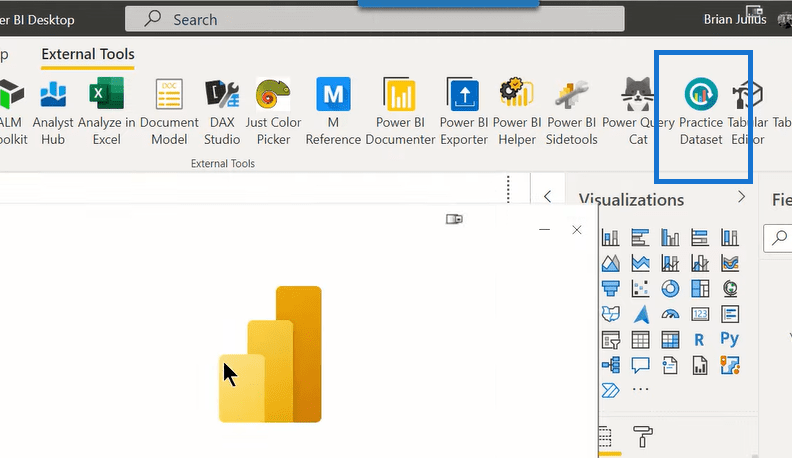
We’ll set up a test database using the Enterprise DNA Practice Dataset tool. So, we’ll turn that on and create a small three-year dataset with a standard sales-products-customers star schema model.
Now, let’s take a look at how this function works and, in some cases, how it doesn’t.
Using The New DAX Function COLUMNSTATISTICS
First, I’ll create a new table to show what this function produces. So, let’s create a calculated table and we’ll call it Col Stats. You’ll notice that as I type in, IntelliSense doesn’t recognize it, which is a little bit of a red flag right off the bat. We also get this message that says a circular dependency was detected.
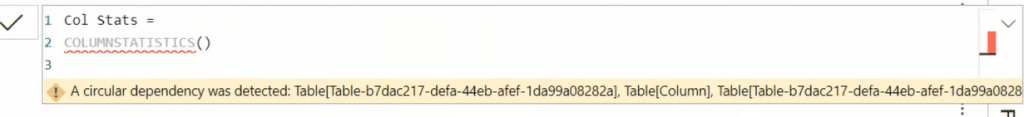
If you think about what this function is doing, it’s going through each of the tables in the model and creating statistics on the fields. And so, what it’s doing here is it’s actually trying to create statistics on this table itself, the Col Stats table. It’s creating that circular dependency.
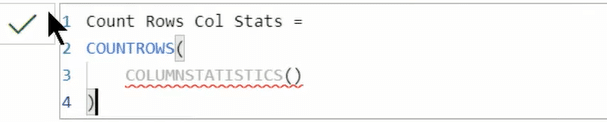
That’s not going to work. So my next thought was, instead of creating this as a physically calculated table, what if we created it as a calculated virtual table so that it’s not looping back on itself in a circular dependency?
So let’s go to measures, create a new measure, and just try something simple here. We’ll try counting the rows of this Col Stats table.

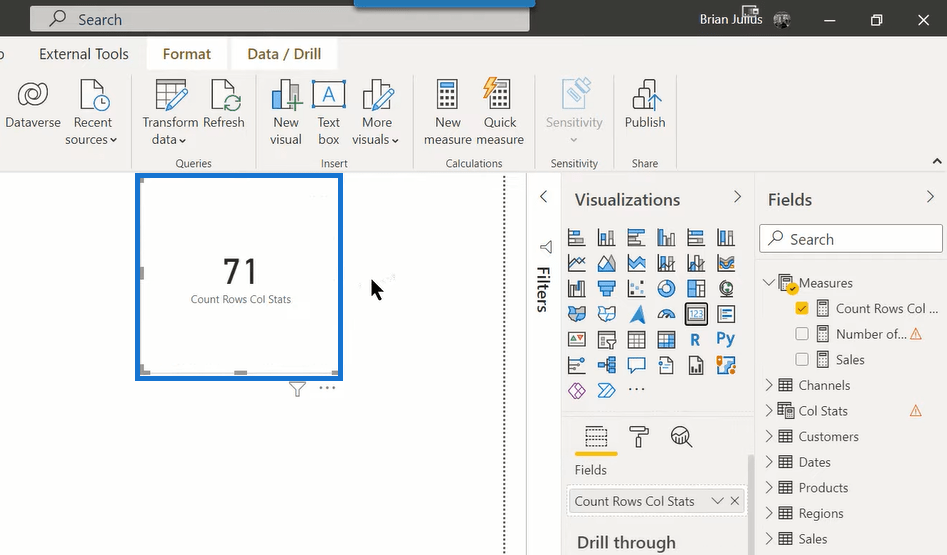
Now let’s try putting that into a card visual. As you can see, it works. We’ve got 71 rows in that column statistics stable. It’s calculating properly in that virtual environment.
Next, let’s take a look at how we can extract that data. If we can create a table, maybe we can go and do it as a DAX query.
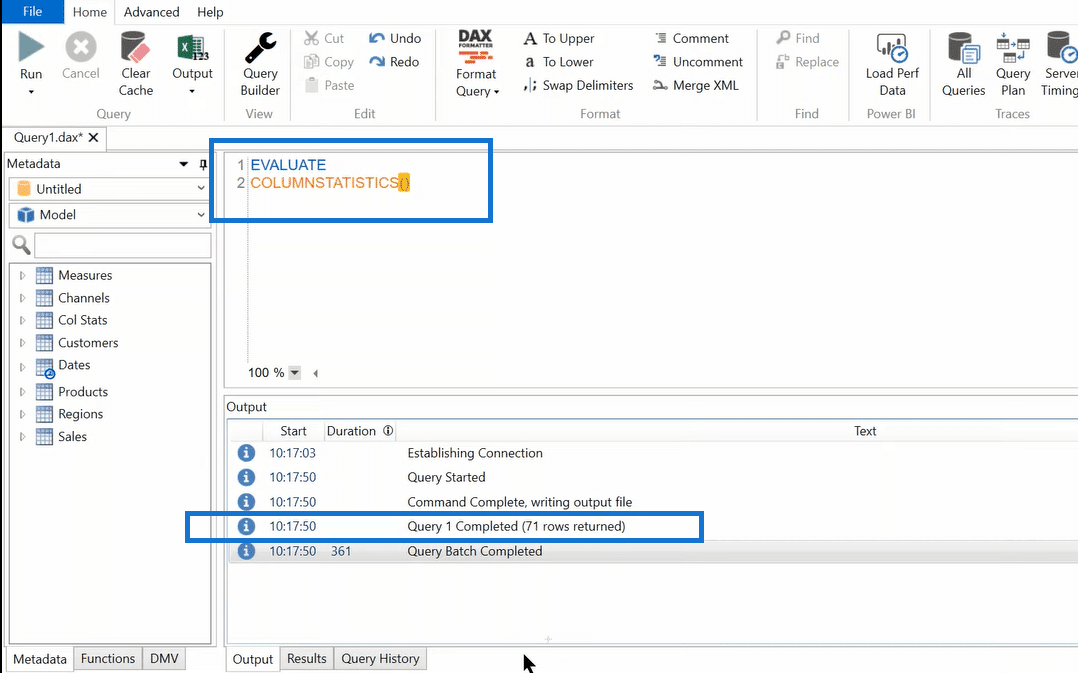
For this, we go into the DAX Studio because we’re going to want to output this to a file and DAX Studio does a really nice job of that. We set our output here to Excel and we’ll create a static Excel table. Then, we do a DAX query. DAX queries that produce tables start with EVALUATE. It actually works and returns an Excel file with 71 rows.
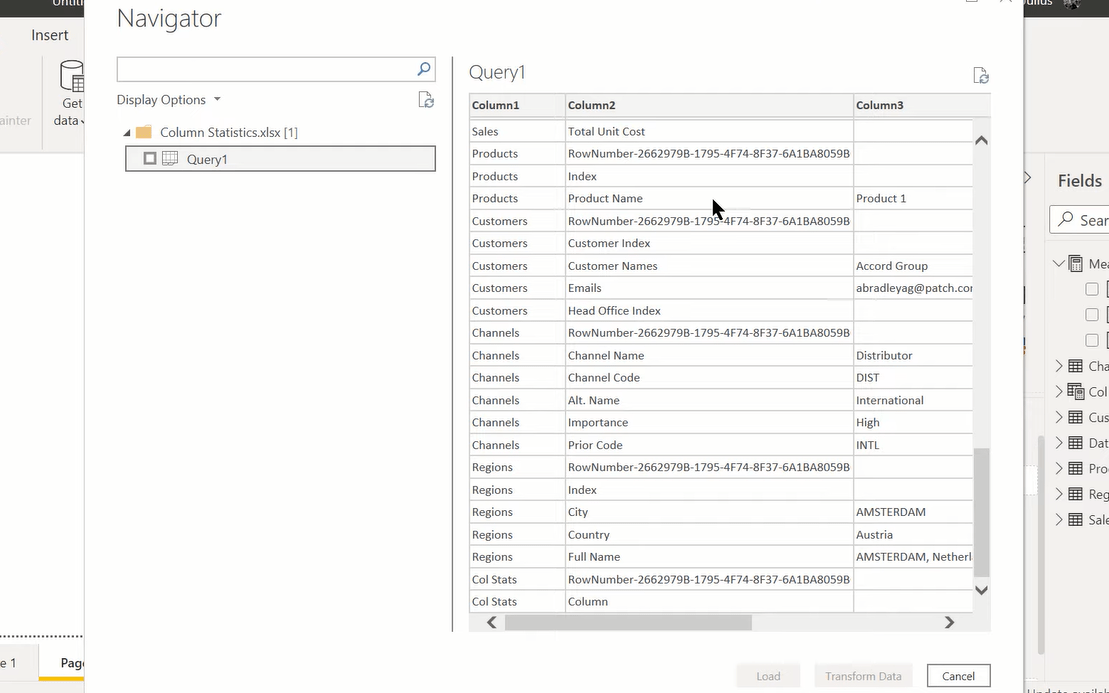
Going back into Power BI in our sample data model, we’ll take that Excel table that we created. Let’s pull it in, and we see we get this Query1, and it’s exactly what it says it was going to do, which is to produce information about each column in each table.
We can then transform this data. First, we just go Use First Row as Headers. Then, we take that Query1 table and rename it to Column Statistics. Then, click Close & Apply.
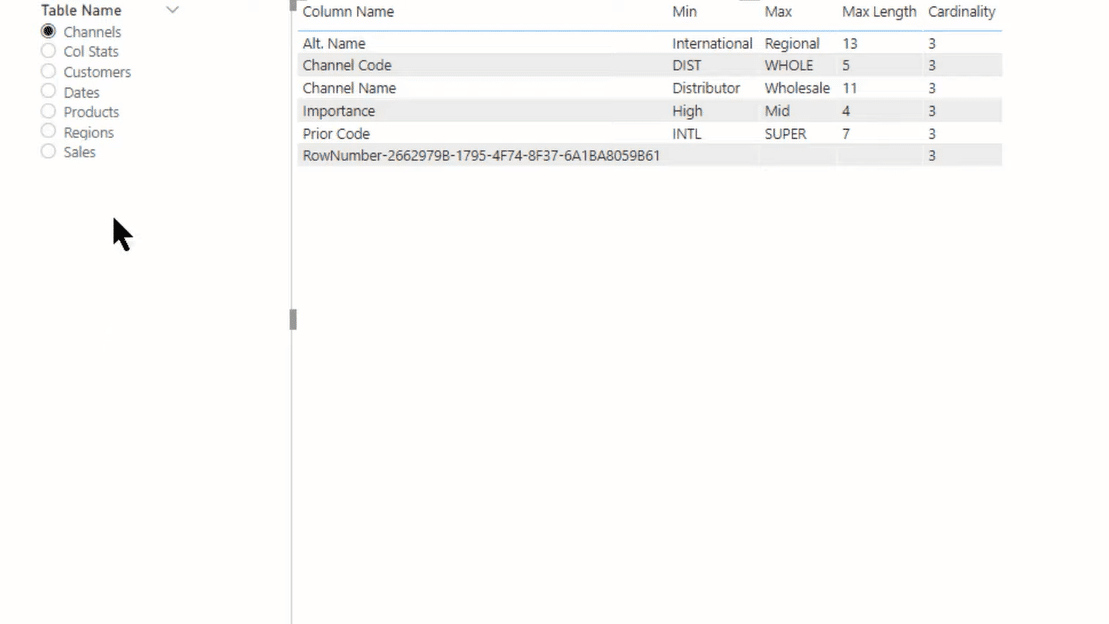
On a new page, we then take the table name and drag that into a slicer. Let’s take the rest of the data and pull that into a table. And so now, we’ve got something that is quite useful. So instead of having to go back into the table view and scan for the fields you want, you can just click through in the course of your development. You can see all the summary statistics for all the columns.
***** Related Links *****
DAX Table Functions In Power BI
How To Use The COUNTROWS DAX Function In Virtual Tables
Power BI DAX ALL Function – How It Works
Conclusion
One of the things that are super cool about this is that because this is all in a physical table, in your DAX measures, you can now reference this. You can count your tables and the number of fields per table. In virtual tables, you can create lists of column names and do all sorts of checks against the structure of your model.
So, I think this is something that if we continue to experiment with, we’re going to find new and better uses for. If you’ve got some other discoveries you’ve made with regard to COLUMNSTATISTICS, I’d love to hear them in the comments.
You can watch the full video tutorial below for more details.
All the best!
Brian


