
In this blog post, I’ll introduce you to DAX table functions. Table functions are simply DAX functions that return a table.
Some of the most common table functions that you can encounter in Power BI are the FILTER, VALUES, and ALL functions. Using these table functions, you can create virtual tables inside Power BI.
Physical tables are tables that you can literally find in the data model. Virtual tables are the ones that have been virtually created using various DAX functions.

In the next sections, I’ll teach you some techniques on how to use table functions.
Using Table Functions
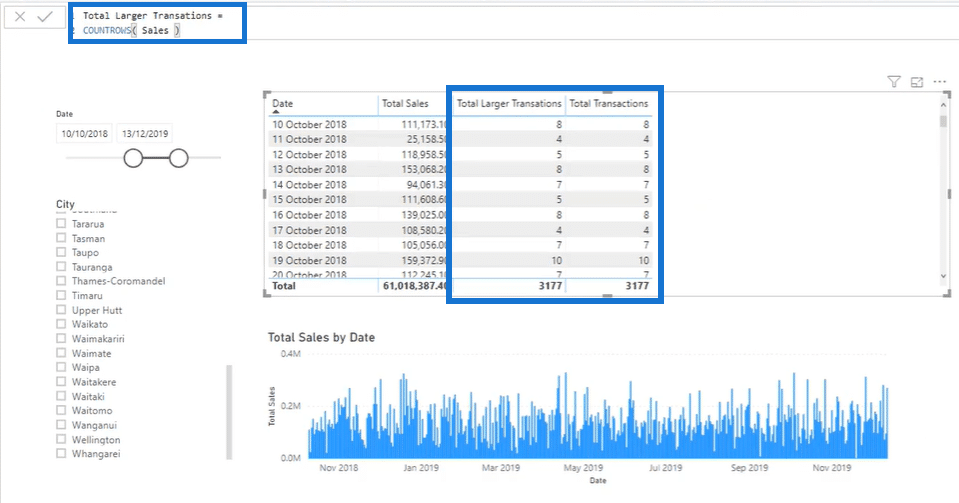
In this example, I’ll calculate the number of transactions that are over $10,000 using the Total Larger Transactions formula.
I’ll start the formula with the COUNTROWS function. Based on the description, the said function counts the number of rows in a table after the initial context. Thus, I need to input a table after the function. However, the table doesn’t have to be a physical one like the Sales table.
If you put the Sales table, the results will simply show the number of transactions. This is just similar to the results of the Total Transactions measure.
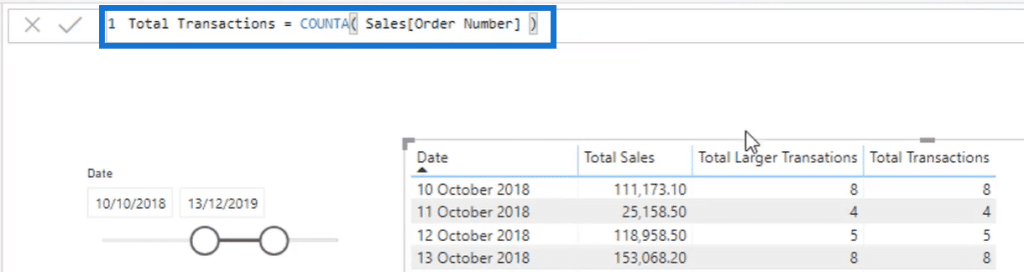
If you look at the formula for Total Transactions, it uses the COUNTA function. This is just another way to calculate the same results using DAX functions.
In the following example, I want to show you how the COUNTROWS function works. This time, I’ll use the table function FILTER to create a virtual table.

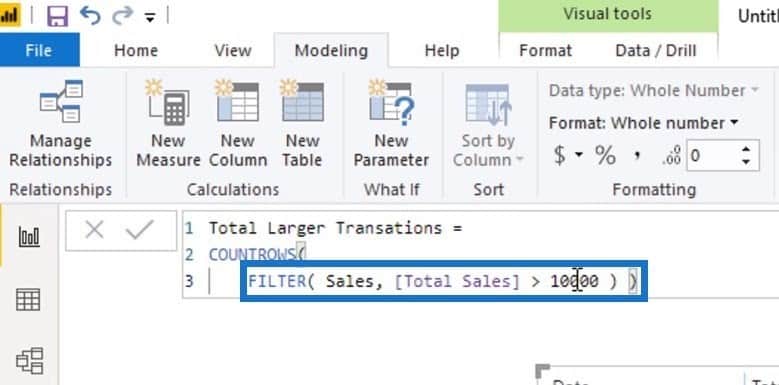
The FILTER function will go through every single row of the Sales table. It will evaluate every row of the Total Sales column if it’s greater than $10,000 or not. If the sale of a single row is greater than $10,000, it will be counted as one transaction.
As you can see, the results under the Total Larger Transactions column are now updated.
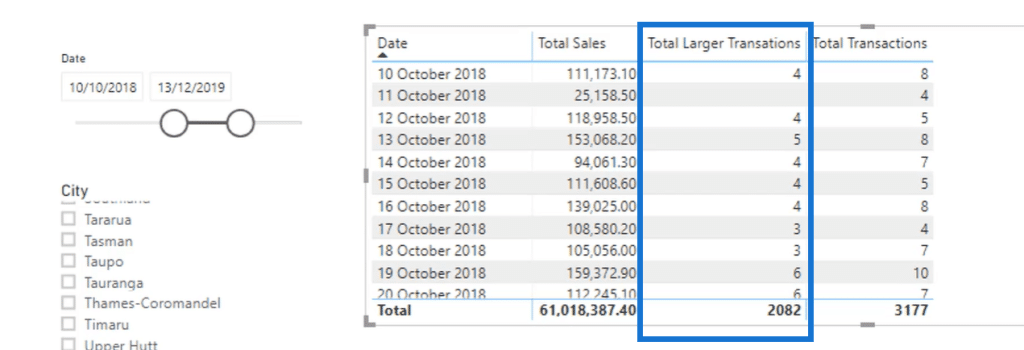
Using the virtual table, I have created an additional filter after the initial context. Most importantly, I made it within the formula itself, without having to create a physical table.
For example, let’s examine the particular result for the 10th of October, 2018. In the data model, you can see that the filter flowed down from the Dates table to the Sales table.
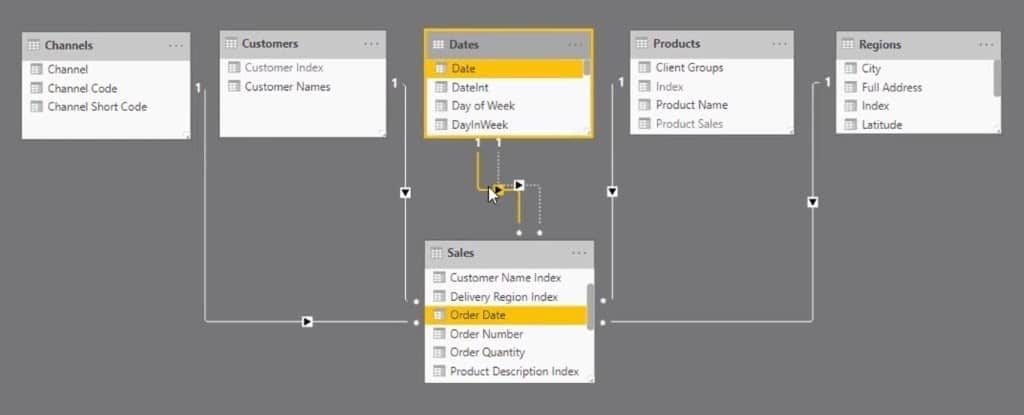
Within the formula, I just placed another filter using a different table function so I can evaluate how many transactions are greater than $10,000. This calculation is a good example of how useful virtual tables are.
Using The VALUES Function
Now, I’ll show another example of table functions. This is about calculating the average sales by using the VALUES function.
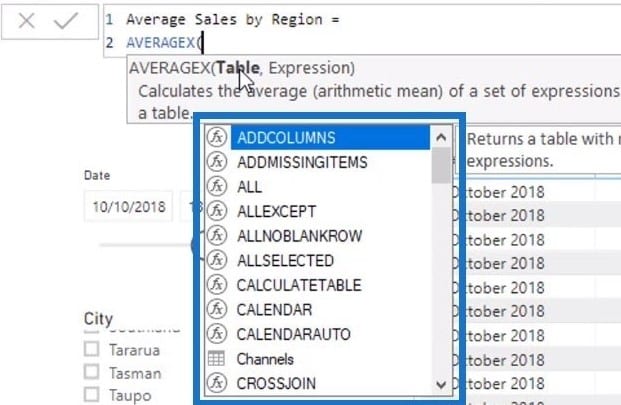
I’ll start the measure for Average Sales by City with the AVERAGEX function. According to IntelliSense, I’m going to need a table. Once again, it doesn’t have to be a physical table, so I’ll make use of a virtual one.
To create a virtual table, I’ll be using the VALUES function and then add Regions[City] as well as Total Sales.
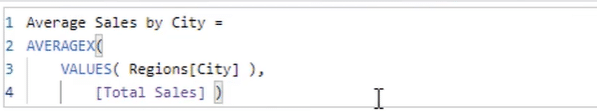
With the AVERAGEX function, the formula will evaluate every single row of the virtual table. After the initial context, the formula works out the total sales for all the cities row by row.
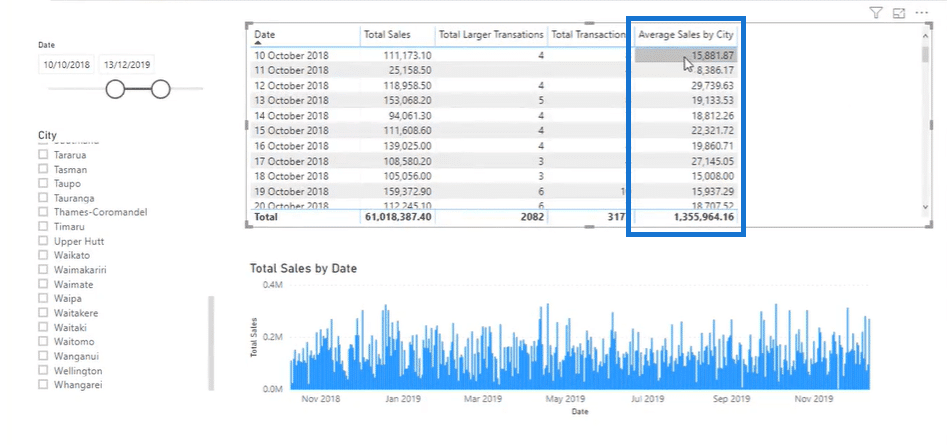
After calculating the sales of every single city, the formula works out the average. In the results, you can see the average sales per city on the given dates.
Calculating Sales Using Table Functions
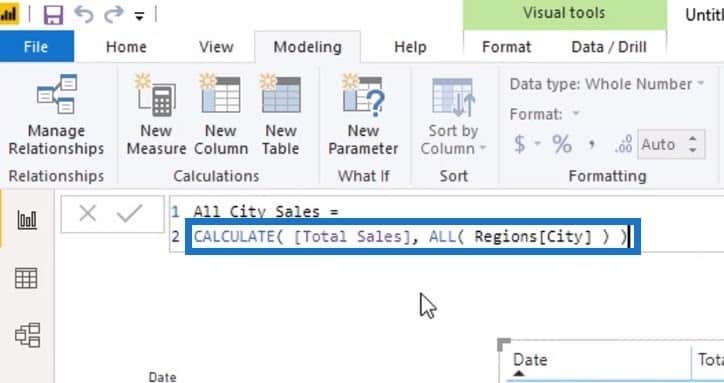
In this last example, I’ll show you another DAX table function which is the ALL function. This time, I’ll be working out the total city sales with the help of CALCULATE.
In the All City Sales formula, you can see that I started the formula with the CALCULATE function.
Adding the ALL function removes the filters that are in place in the City column. Therefore, the measure will calculate the total sales in all the available cities.
If you compare the results for All City Sales and Total Sales, it will have the same results. However, if you select a particular city from the slicer, the All City Sales results will stay the same.
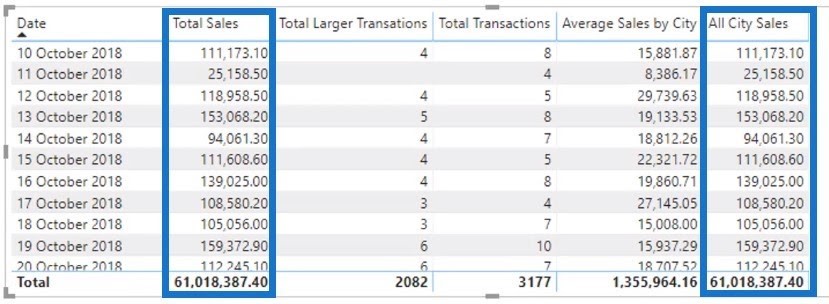
It will give you the same results regardless of any selection. This is because of the CALCULATE function.

The said function enables you to change the context of the calculation. When you add the ALL function, it removes the initial context from Regions table.
***** Related Links *****
How To Use The COUNTROWS DAX Function In Tables
Multiple Dates Logic In Power BI Using DAX
Optimizing Your Power BI Formula Using Advanced DAX Functions
Conclusion
This tutorial introduces you to the most common table functions. If you use them frequently in your calculations, you can master it in no time.
Furthermore, you can make things more advanced if you start combining the said table functions. You’ll probably encounter this when you run cumulative totals, moving averages, attrition analysis, and cross-selling analyses.
You’ll learn more advanced DAX calculations when we move on to measure branching.
Sam


