
A really common scenario within financial analysis is having to integrate currency rates across your transactional data. Most of the time, sales data is actually recorded regardless of the currency and the currency name or code is just placed inside a column. And it could be either USD, AUD, GBP, but it isn’t actually adjusted by the currency rate for you. You may watch the full video of this tutorial at the bottom of this blog.
So what you have to do is integrate a whole lot of historical exchange rates, because through time, exchange rates change. And so depending on the day that you sold something, the exchange rate equivalent is going to be very different. I’m going to show how you can solve this inside of Power BI.
There’s a little bit that you have to understand, especially around the data model which I know is a relatively new concept to a lot of people. But I show you a lot of my best practices here and then how to bring in this exchange rate information into your sales or your transactional table.

Handling Multiple Currencies In Power BI
For today’s blog, I want to talk about how to handle multiple currencies inside of Power BI. I see a lot of these questions on the forums and it is a common problem especially for accountants or finance people who need to work out the value of their potential sales using their home currency.
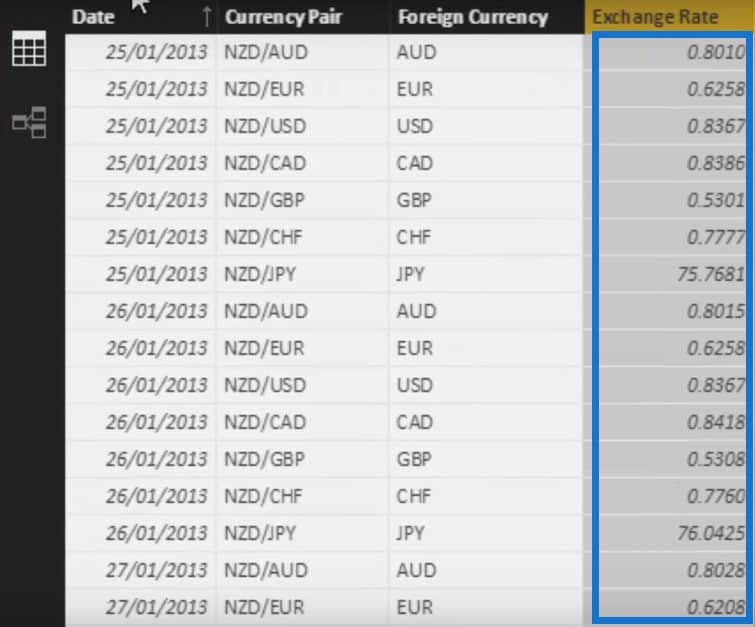
There’s a few intricacies involved in this scenario and I’m going to talk how you can solve them. First, I am going to show how you can integrate the currency table into our data model from the back end. I am going to click on Edit Queries, then click on Exchange Rates. When I click on Navigation, you will see the Date and Currency Pairs.
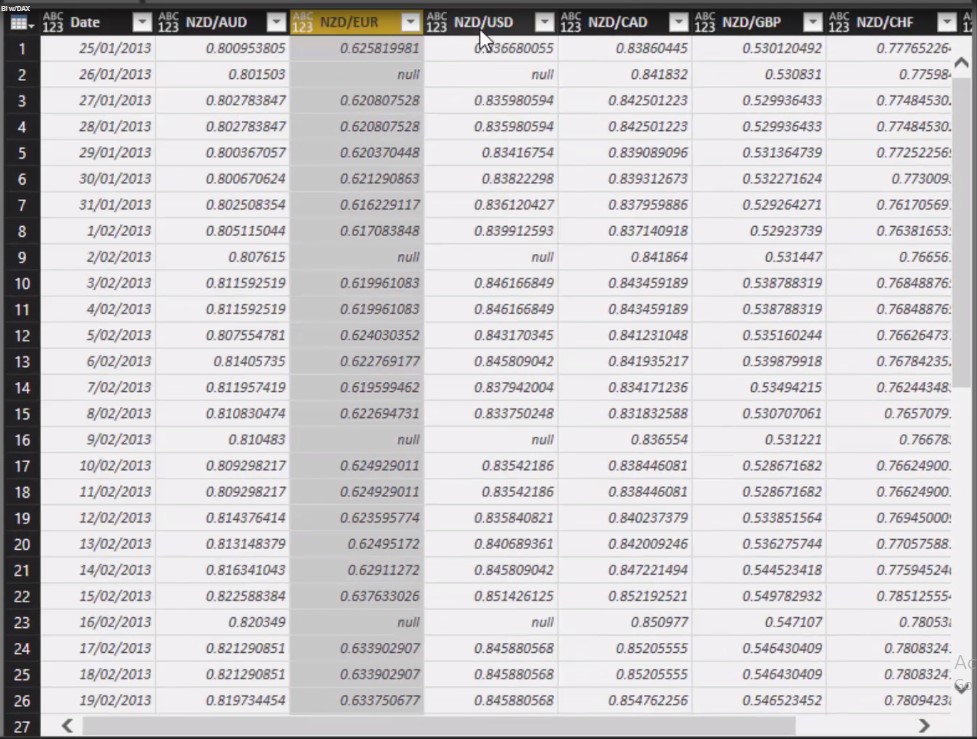
This is a pretty common scenario because this is how currency information is retrieved. The format above is how you’ll be given data; sometimes a bank will send it to you and sometimes you can download it online. Unfortunately, this is not useful at all if you wanted to incorporate this data on the fly into your calculations.
Unpivoting Columns
What we have to do is to unpivot these columns and click through until we have the columns we need, which in this case are Date column, Currency Pair column, Foreign Currency column, and Exchange Rate column. We want one line per date and per currency.


This is one of the key things that you have to do to incorporate this into your Power BI model. We’re going to save this and then jump back to the model.
How The Data Model Works
I’m going to show you the setup for the data model here. We have the Sales Data, the dates of our sales (Dates table) and the products (Products Data table) we are selling to customers (Customer Data table) in specific regions around the world (Sales Regions).


The Sales Data table is where we’re going to do all our calculations. We have a Currency Code column aligned to the region that we that we are selling to. The Total Revenue column shows the total revenue in the particular currency that we sold it to so we just can’t sum Total Revenue and call that our Total Sales. That’s completely wrong. We need to get every individual sale we made and transfer it back to our home currency, which in this example is Kiwi dollars.

What we can do is link up our Exchange Rate table to the Dates table, and then link up the Dates table to the Sales Data table.

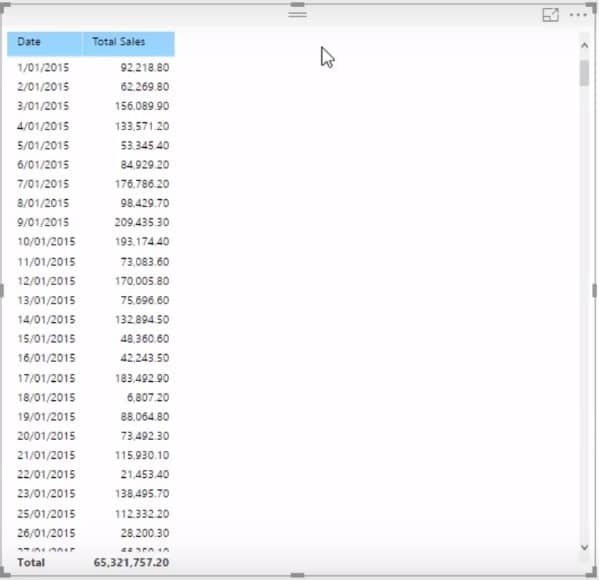
This way, we can work out a formula for each of those individual amounts with the currency adjusted. First, we get our sum of Total Revenue and drag that into the table. As you can see, this is a completely incorrect number. It does not tell us at all how much we’ve actually sold because it’s in Japanese yen, Canadian dollars, Euros, etc. so it’s just meaningless numbers.
The LOOKUPVALUE Function
What we need to do is use a function called LOOKUPVALUE and put it inside an iterating function. We are going to put the LOOKUPVALUE inside SUMX because we are ultimately summing up revenue, but we also need to adjust every single row in the Sales Data table and every single revenue derived from a sale and divide it by the associated exchange rate.
The first value after LOOKUPVALUE is what we want to retrieve, so in this case, we want to retrieve the Exchange Rate from the Exchange Rate table we created. We also want to make sure the Date is the same as the Sales Order Date, and that the Foreign Currency is the same as the Currency Code inside the Sales Data table.
The LOOKUPVALUE is going to adjust every single sale item for the currency exchange rate on a particular day.

Total Sales Currency Adjusted
When we look at our Total Sales Currency Adjusted table, we know instantly this isn’t correct.
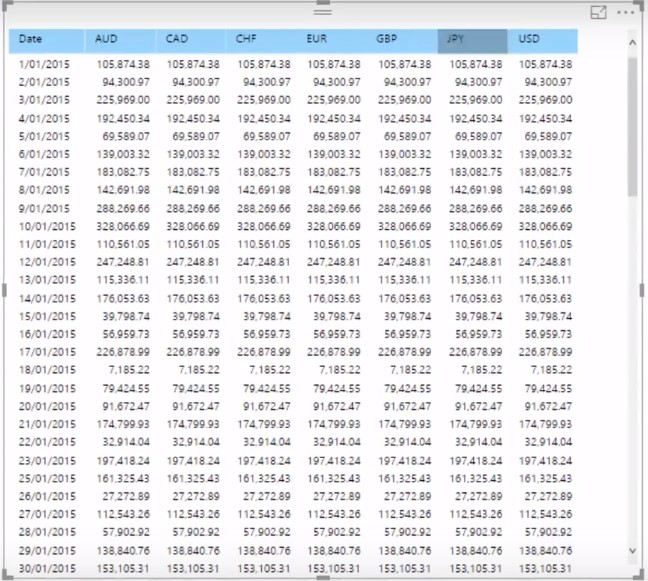
The Foreign Currency is coming from the Exchange Rate table, which has no relationship to the Sales Data table, which is where our Total Sales is coming from.
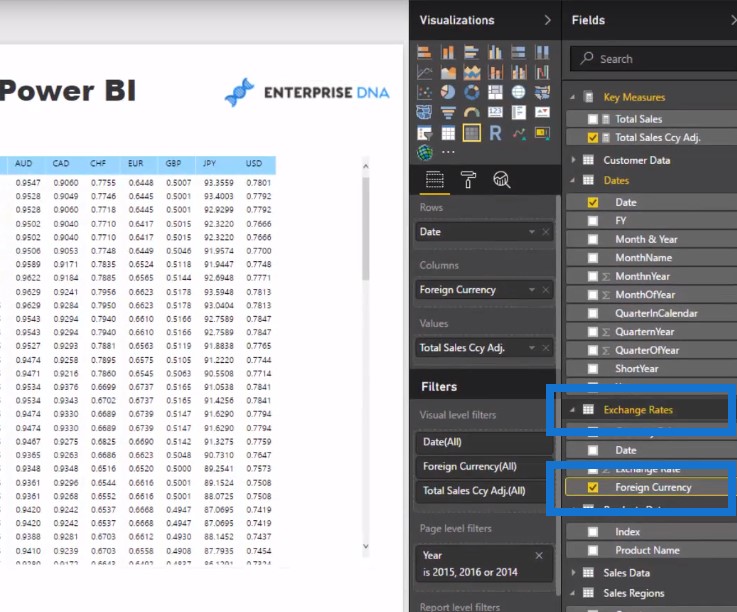
What we need to do is adjust this by the currency inside the Sales region. Now you can see per day where these sales are coming from per currency.

The key here is the currency adjustment and the process of unpivoting the columns so that the exchange rate was all in one row.
***** Related Links *****
Power BI Exchange Rates: An Update To Multiple Currencies Management
How To Download Latest Exchange Rates Into Your Power BI Model
Using Power BI DAX Functions To Deal With Products That Have Changing Prices Overtime
Conclusion
In this post, we needed to go to the data model to make sure there was a relationship from the Dates column to the Exchange Rates column. We also wrote advanced logic inside the SUMX function. Since SUMX is an iterator, it went to the Sales Data table and then for every single row in this table, it went Total Revenue divided by the Exchange Rate for that particular currency on that specific date. This is how we achieved the Total Sales Currency Adjusted in our formula.
Now if you do this effectively, it becomes very seamless to do these calculations. By understanding how to sort the data model and also how to utilize the DAX measure LOOKUPVALUE, you have the ability to very easily run currency adjusted calculations. Not only that, you can also dynamically look at your results depending on what currency you want to look at it in.
So lots of applications for this, especially in the financial world or any organization that sells goods across many different currencies. Very applicable to a real-world situation. Hopefully this helps those who run into this problem and are looking for a solution.
Good luck with implementing this technique yourself.


