
In this blog post, we are going to work through an advanced but real-world analysis involving Power BI DAX functions. You may watch the full video of this tutorial at the bottom of this blog.
The scenario in question is when you have products which change prices over time.
A lot of the demos/showcases you have reviewed over time suggest that a product’s price stays exactly the same from the beginning of time to the most current date. In reality, this isn’t the case.
In a lot of raw data tables, you probably have a setup where the price can change to another price over different time frames. For example, prices can change due to seasonal demands.

Implementing Power BI DAX Functions For Price Changes
The techniques that we will cover in this blog post will help us deal with these price changes. There’s a bit of a learning curve to get this right using Power BI DAX functions.
It can be done though by setting up your data model correctly and utilising more advanced DAX formula combinations.
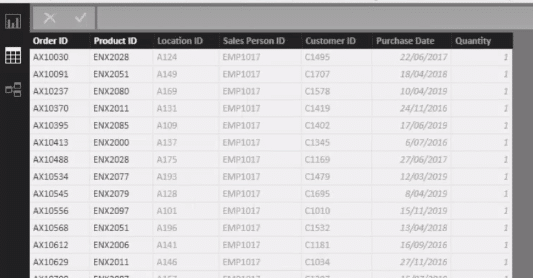
For this example, you may know beforehand what your pricing changes were historically and you want to integrate those price changes in your model. But in this scenario, you might not have prices in your fact table. Think about this Sales table as a transaction table.
If there was pricing in this table, then you probably won’t have to do this. But I have seen questions crop up on the Enterprise DNA support forum where the pricing is in a separate table and needs to be integrated in.
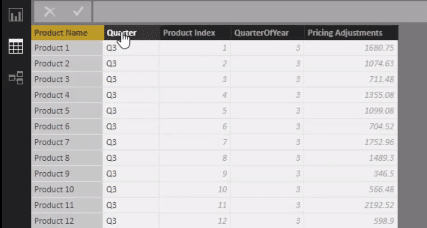
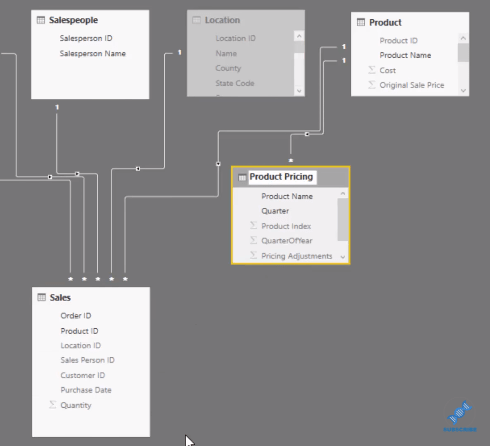
I created a table where I have every product as well as the price for every product which changes for the quarter. So I’ve got a Product Name and a Quarter Dimension.
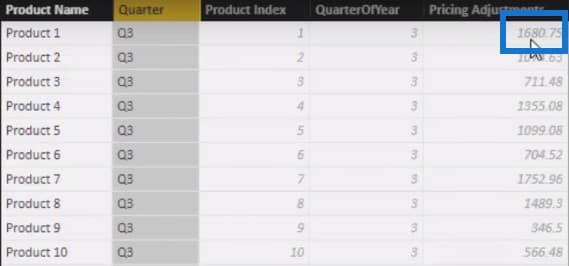
So for Product 1, its price during the third quarter was $1,680.75.
But if we scroll down our table, we can find that the price for Product 1 has changed to $2,666.79 during the fourth quarter.
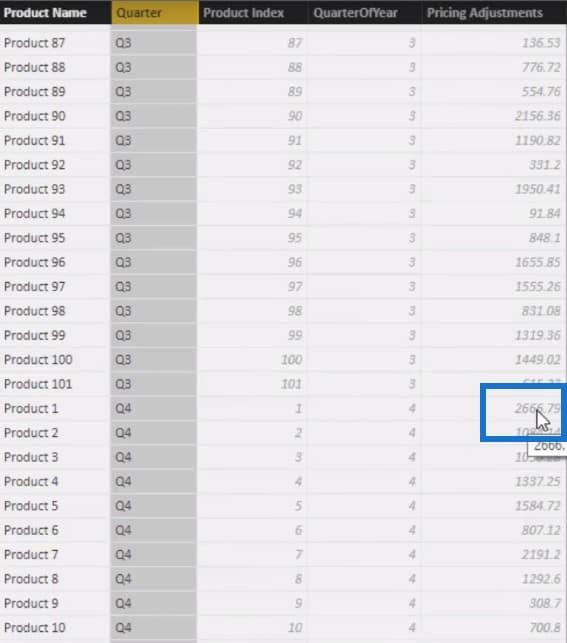
During the Christmas period, we increase our product prices quite a lot so we need to know how these prices were changed. This is a really good idea for future forecasting and scenario analysis because you might find yourself forecasting changes in prices in a lot of cases.

Relationship Between The Tables
The tricky part here is how to get this into our model. The Product table is listing every single product once, but the Product Pricing table is referencing a product multiple times. So we cannot make a relationship between the Product Pricing table and the Sales table.
There’s no way for us to do that because there are multiple values in the Product Pricing table and we want the lookup table (Product table) to be on the unique side.
In this scenario, we need to be innovative and work out how we can take a data point from the Product Pricing table while analyzing data from the Sales table by using a couple of Power BI DAX functions.
Calculating Average Product Pricing
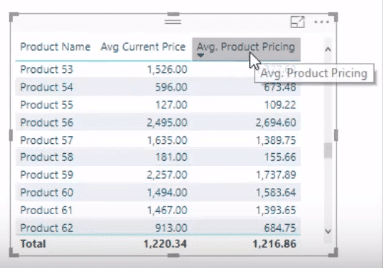
This is how I did it. When I mocked this scenario up, I also did a number of additional things. I have here this particular table that has the product name, the average current price, and the average product pricing, which is going to change based on the quarter that we select.
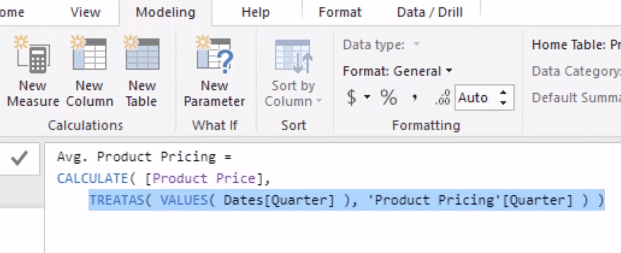
To calculate the average product pricing, you have to remember that there is actually no relationship between the Date table (which is where the quarter comes from) and the Product Pricing table.
Utilizing The TREATAS Function
So when we make a selection here, we need to somehow filter the Sales table to make sure that the correct price for the quarter is coming through. To do that, I utilized the TREATAS function, which allows you to create these virtual relationships.
After virtually creating the relationship through TREATAS, the product name and details will change based on the quarterly selection that we make.
There’s a lot of application for the TREATAS function in forecasting, advertising, and marketing where the prices of products do not always stay constant. You will have to use a combination of techniques to actually solve these types of things.
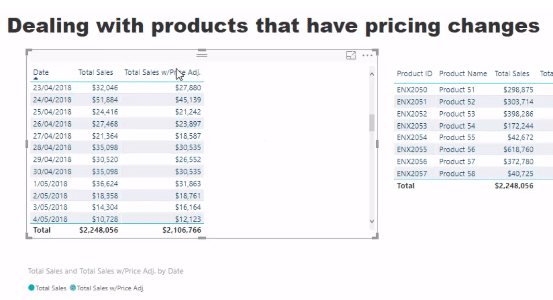
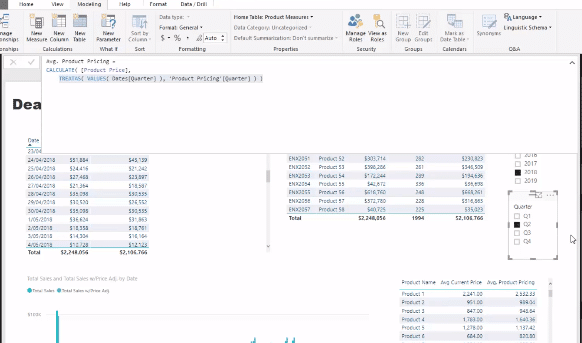
Now, I want to compare the Total Sales historically based on just a one-off price. I want to compare the Total Sales with Price Adjustments, which contains all of our sales but taking into account all of these pricing adjustments for quarters.
Utilizing The LOOKUPVALUE Function
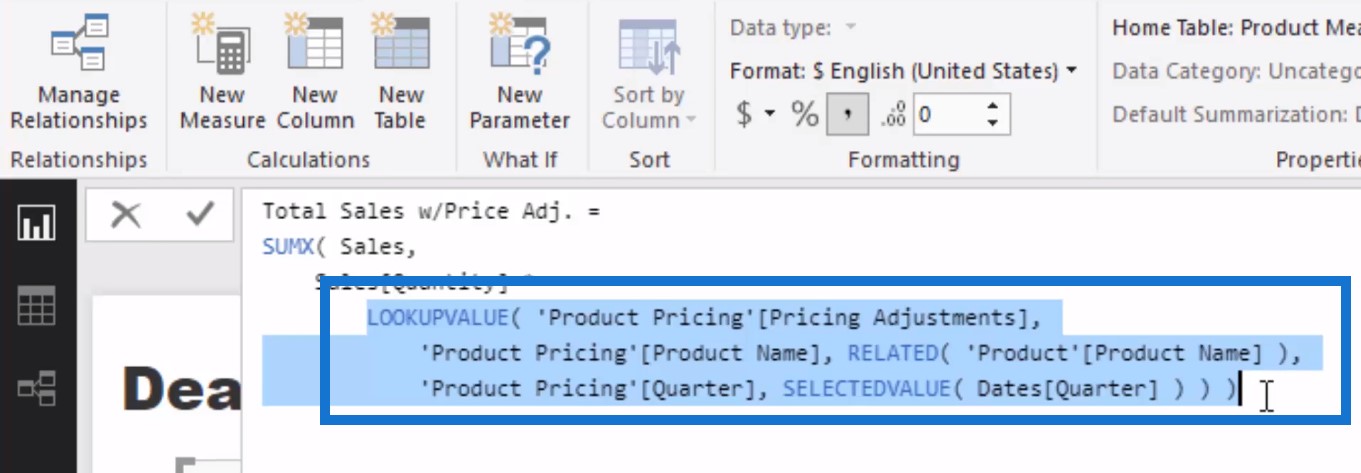
To get my desired results, I came up with the formula using the LOOKUPVALUE function. For the Total Sales with Price Adjustment calculation, I used the SUMX function sales, referenced the Sales table, then jumped to the Quantity table. As a final step, I used the LOOKUPVALUE function.
LOOKUPVALUE is the closest to a VLOOKUP as you can possibly get. It is basically doing a type of VLOOKUP inside the Product Pricing table but then bringing it into the iteration that we’re doing over the Sales table.
The great thing about LOOKUPVALUE is that you don’t need any relationships to use it. You can jump into other tables just by referencing certain elements in a particular table.
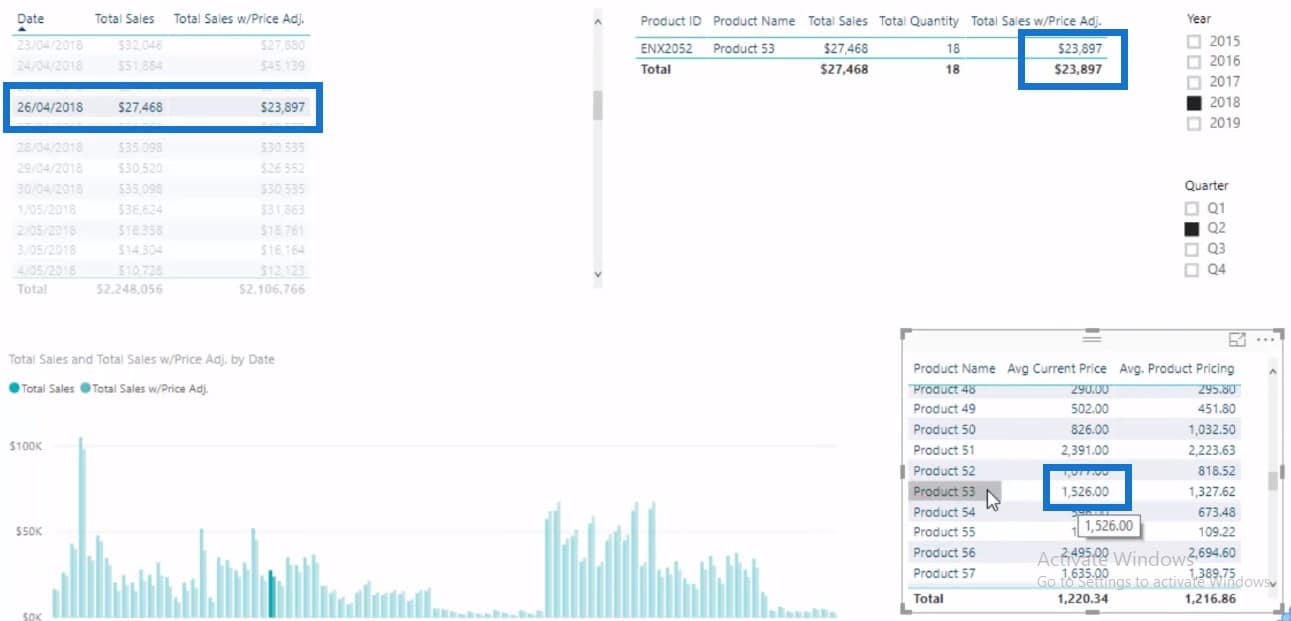
By using the LOOKUPVALUE function, you will be able to keep track with the price changes. Let’s take a look at what happened last April 26, 2018. We sold 1 product, Product 53.
The Total Sales column will take into account the new price of $1,526, while the Total Sales w/Price Adjustment column will take into account $1327.62 as the Average Product Pricing.
***** Related Links *****
Deep Dive Into The TREATAS Function – Virtual Relationships For Power BI
How To Create Virtual Relationships Using TREATAS In Power BI
Multiple Currency Logic In Power BI – LOOKUPVALUE Example
Conclusion
In this example, I used the TREATAS function as a way to create a unique virtual relationship in my data model. This is one great trick to learn when working with more complex data.

We also got to look at the LOOKUPVALUE function. This is another unique function that is not used often, but there’s a logical reason why we need to use it in this particular example.
We implemented some high-quality development techniques that cover very real-world data scenarios that you will likely deal with at some point in your business.
For many more business analytics examples, check out the below mini-series module at Enterprise DNA Online.
Enjoy working through this detailed video.
Sam
[youtube https://www.youtube.com/watch?v=XHHkKamqeCU&w=784&h=441]


