In this tutorial, I’m going to show you how to create a great inventory dashboard using some DAX formulas in Power BI. After properly setting up the data model, the next step is to write the DAX formulas and set up the visualizations for an inventory system in Power BI.
This tutorial will show the quick and effective ways to generate the information you need in your inventory dashboard.
Creating The Measures
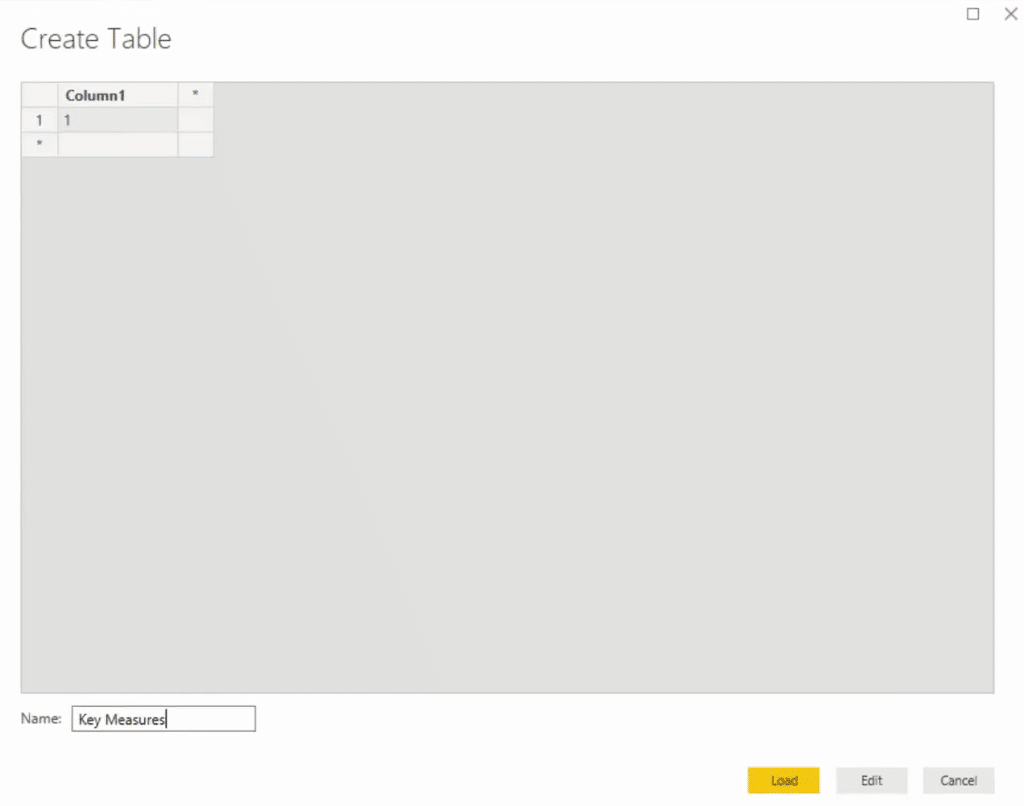
First, create a measure table for your measures to be catalogued. Call it Key Measures.

1. Inventory Value
Next, create a new measure and call it Inventory Value. Use the SUM function to sum the Total Value.

Drag the measure into the canvas and then add the Item Name from the Products table to the measure’s Axis. You’ll then get results from different products with a default theme.

2. Inventory Stock Quantity
Add a new measure, Inventory Stock Quantity, then sum up the Stock Quantity.

For its visualization, copy and paste the previous chart and change its value to the new measure. Also, you need to sort the order by stock quantity.

If you’re trying to manage your inventory, you should manage it from a quantity perspective rather than a value perspective because you need to know the quantity that’s going out and how much you need to stock. You have to evaluate your products and stocks and start doing promotional analysis or marketing strategies for them.
Adding The Visualizations
You can also look at the table from a vendor perspective. Copy and paste the visualization and then change the Axis to Vendor.

Next, copy the same visual. Change the value to Inventory Value and then sort it by inventory value.

For the Inventory Stock Quantity by Item Name visual, change the value to Inventory Value and the Axis from Item Name to WarehouseCode to look at it from a warehouse perspective. Lastly, turn the visualization into a doughnut chart.

Add cards into the canvas with the values of Inventory Value and Inventory Stock Quantity.

The main thing that you’re doing with the visualizations is making simple calculations that quickly and easily give you different answers.
Turn the Inventory Value by Item Name visualization into a table and then add Inventory Stock Quantity in the values.

Also, don’t forget to put the title. Add a textbox in the upper left corner and call in Inventory Value.
***** Related Links *****
Inventory Management Reports To Show Trends In Sales
Calculate Days Of Zero Stock – Power BI Inventory Management Insights
Inventory Management Insights With Power BI: Comparing Stock To Sales
Conclusion
You’ve now learned the basic DAX formulas and visualizations to use when creating an inventory dashboard in Power BI. This is already a great start to get valuable insights from your inventory data.
In the next tutorials, you’ll learn more complex DAX formula patterns to implement in your reports. This will allow you to extract more insights that will greatly aid the stock and sales analysis of your organization.
All the best,
Sam


