I’m going to showcase a few of the techniques that I’ve used to create interactive reports in Power BI utilizing interactivity buttons or bounces as I call them. You may watch the full video of this tutorial at the bottom of this blog.
I’ve used these techniques in some of my recent submissions to the Enterprise DNA challenges and have found them to be quite useful.
In my opinion, one of the most important things that our report designer can do is to make reports self-explanatory for end-users, thereby both increasing their utility and decreasing the learning curve and the time that you spend associated with their support.

An obvious and easy to use and familiar navigation scheme is a worthwhile goal. With only a little bit of effort, interactive reports in Power BI can be easily achieved.
Techniques To Create Interactive Reports In Power BI
I’ve used to implement navigation button bounce in Power BI reports. First, changing the button, text font size and/or the fill color. The second one would be changing the button image size and/or the color on hover. And the third one is changing the button text font family and/or color on hover.
These techniques implement subtle differences between the default and on hover behavior of the buttons. So let’s take a look at the example.
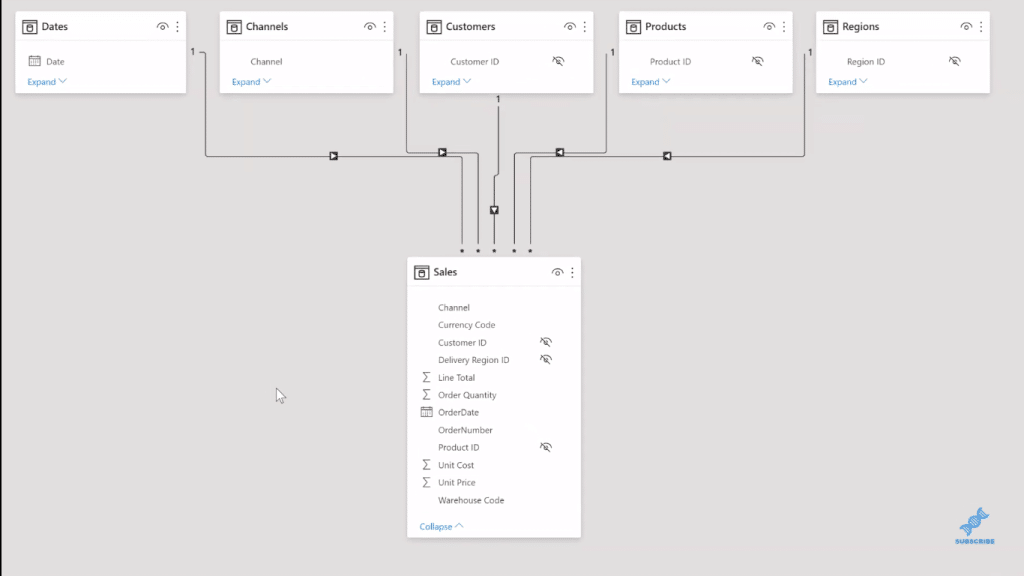
I used the Enterprise DNA practice dataset with a simple model with sales, customers, products and regions. I also have the Date table developed from the Enterprise DNA extended Date table, which is developed by my fellow Enterprise DNA expert, Melissa. The code used in this extended Date table is available on the Enterprise DNA support forum.
Here’s the data model, which is a standard waterfall layout.
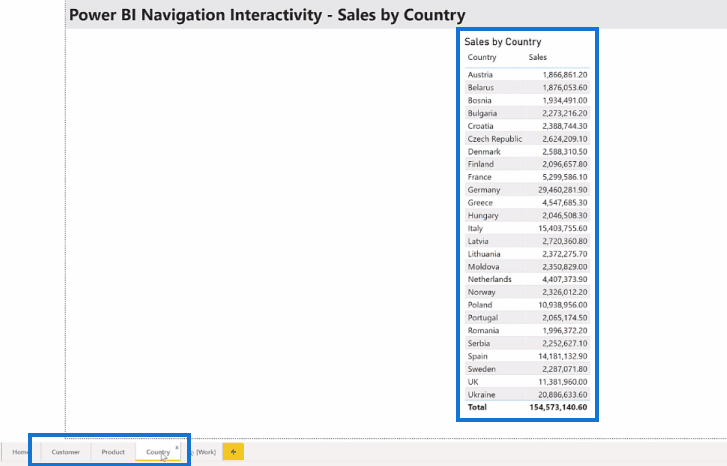
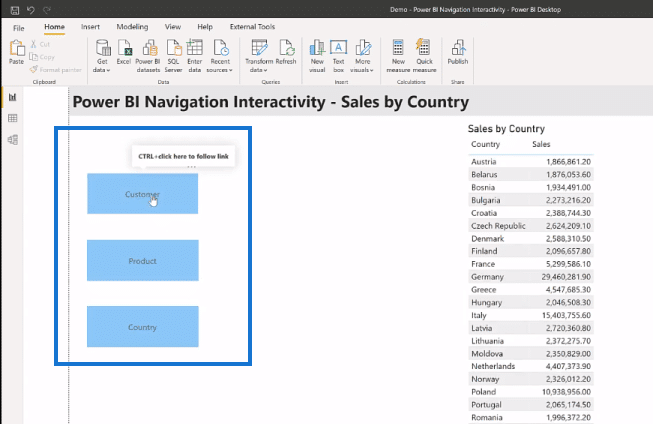
I’ve created three pages as well, one each for Customer, Product, and Country. I got a simple Sales table on each.

Interactive Reports In Power BI: Changing Font Size/Fill
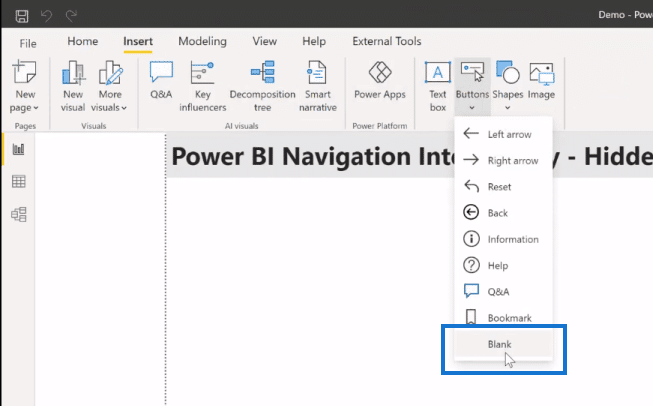
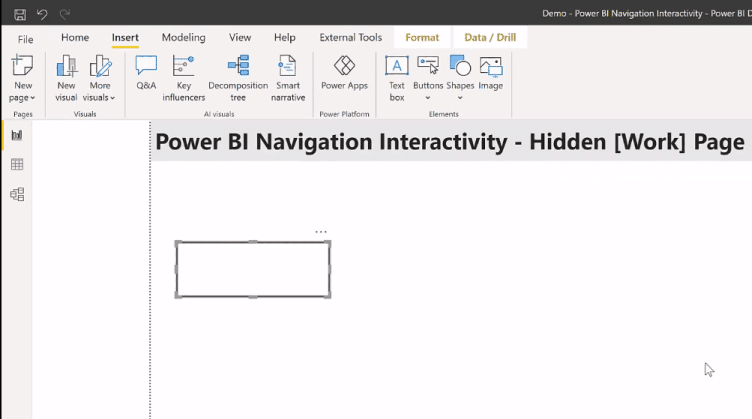
In my work page (for demonstration), I’ll create a blank button. So I’ll go Insert, Buttons, then Blank.
I’ll bring it down and make it a little bit larger.
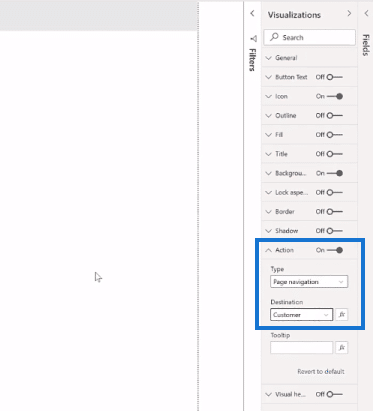
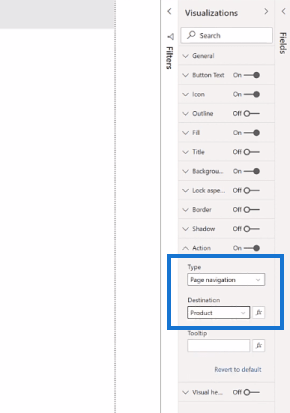
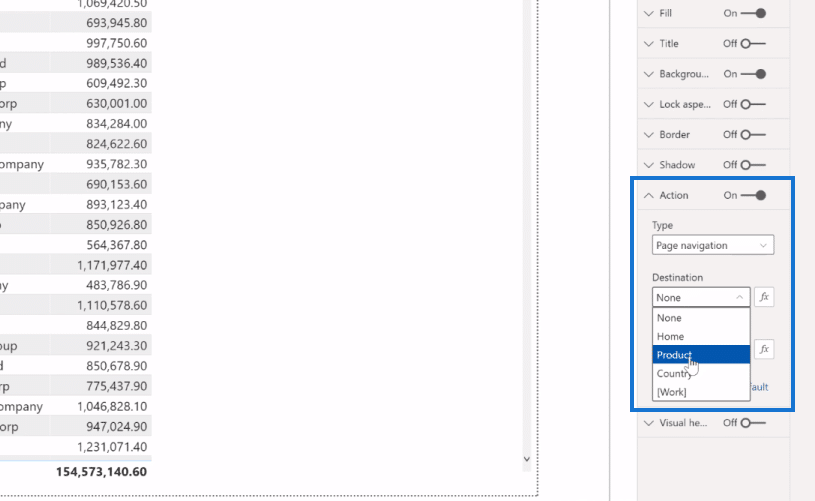
I’ll set the Action on, then the Type is Page Navigation, and the Destination is to the Customer page.
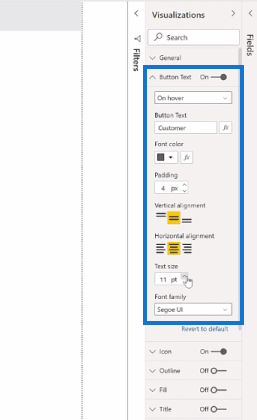
Next, I’m going to set the Button Text on and On hover, and then I’ll set the Button Text as Customer. I’ll then adjust the text size a little bit larger to 11 points.
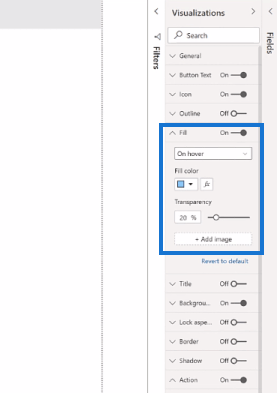
Next, I’ll turn on the Button Fill and set this On hover. I’m going to pick a light blue theme color here and I’ll set the transparency to 20%.
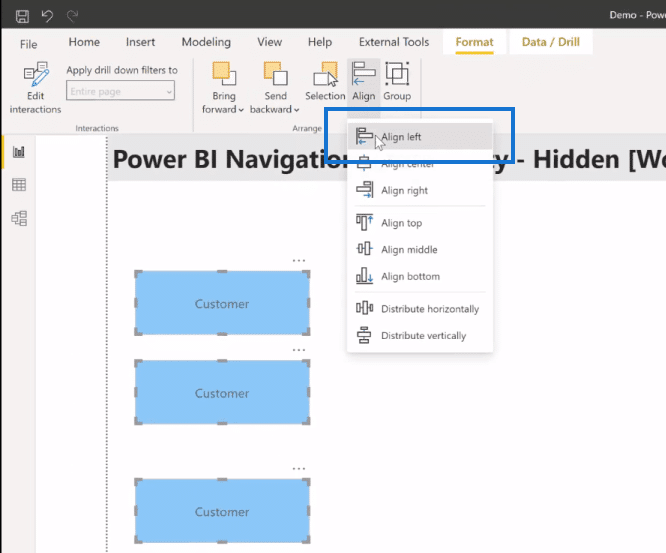
Now I can copy and paste the button twice. I’ll align them easily by going to Format, align on the left, and make sure they’re in the same size, and then distributing them vertically so I got even spacing.
Now, I’ll go to the second button here and I’m going to change its text to Product. I’m going to change its action as well to go to the Product page. For the third one, I’ll change the text to Country and the action to Country page as Destination.
And now I’m going to copy all three of these buttons from this page to each of the other pages (Customer, Product, and Country). So now I have a simple navigation scheme. If I’m on the Customer page, I can go to Product. If I’m on the Product page, I can go to Country. If I’m on the Country page, I can go to Customer, and so on.
The further enhancement you can do is to disable the On hover changes from the button of the same page. So it’s like you’re restricting the interactivity to only the buttons that actually do something on that page.
Changing Image/Size/Color/Font Family
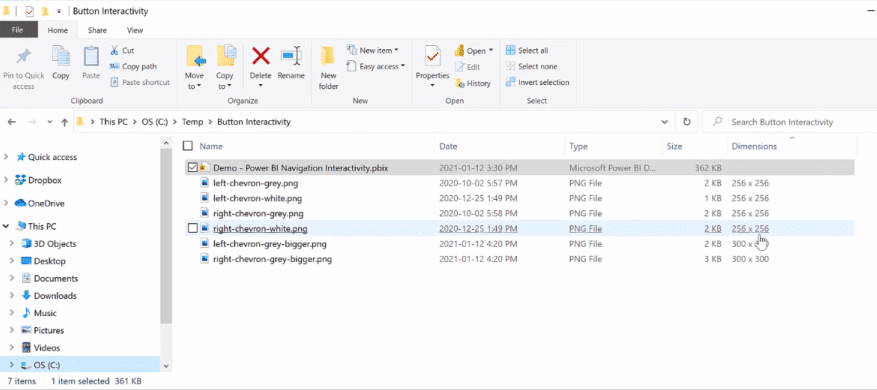
For the second method, instead of changing the font or the font colors, I’m going to use images this time. To start, we’ll need to do a little setup. First, I need to source a couple of images with transparent backgrounds. The ones I’m using are left and right-facing chevrons with a gray color and white colors.
In this example, I have four files and I’ve already edited a couple of them to make copies that are slightly different in size. These are two 56 by two 56 pixels to make them appear as if they’re bouncing a bit.
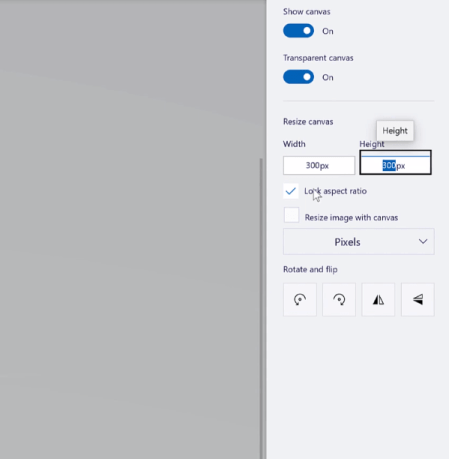
To open the left image, I use Paint 3D, and I make sure that the Lock aspect ratio is enabled and Resize image with canvas is not. Then, I’ll change it to be about 15% larger. And you’ll see that the image stays the same size, but the canvas gets slightly larger. Then, click Save.
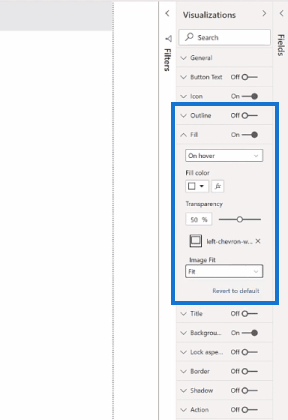
The next thing I want to do is add a blank button once again. Then, I’ll bring it down to another size, turn off the outline, turn on the default fill, and then I’ll change this to On hover. I’ll then add the image and I choose the left chevron bigger and set its size to fit. Then, I’ll change the image with the one that’s white, and then I’ll save the image size to fit.
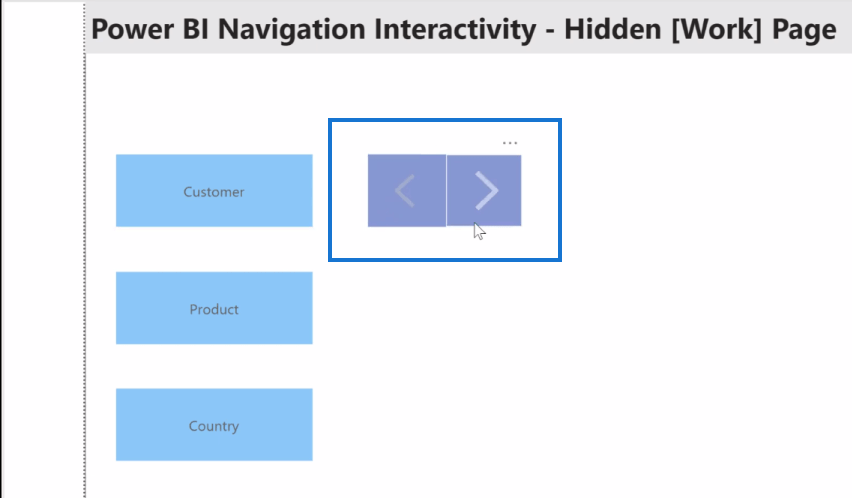
I’m going to repeat the same steps for the right button here. So now I have my left and right buttons. I’ll just add background color so you can see them. You can see the buttons appear to bounce a little bit as they’re moving from one to the other.
So once again, I can copy these navigation buttons to each of the three pages I have in my report, and I can adjust the target of each one.

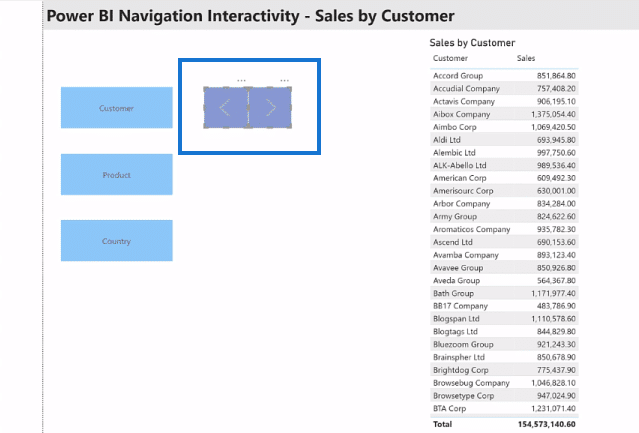
I’ll adjust the action on this one (Customer page) to be Page Navigation, and to go to the next page, which is Product (as the Destination). On the Product page, I use the action to go back to the Customer page and forward to Country. And on the Country page, it will be backward navigation to the Product page.
And now we have the buttons that will navigate forward and backward.
The third method that I have is actually very similar to the first method. I just use a change of font size and fill transparency change instead of changing the size of the font.
***** Related Links *****
High-Quality Power BI Report Navigation Experience
Building A Reporting System With Power BI
Power BI Custom Visuals – Build A Reporting Application
Conclusion
And that’s how you add navigation buttons to create interactive reports in Power BI. It’s not difficult to introduce some subtle and familiar interactivity to your Power BI reports. Examples of these include the choice of bounce method that you use, or even if there’s no interactivity, which depends on your particular situation and the desires and experiences of your end-users.
I hope these techniques can help enhance your Power BI development toolbox. Check out the links below for more Power BI content.
All the best,
Greg