
This is an amazing reporting system or reporting solution that came from a Power BI challenge that we put on at Enterprise DNA. I made a lot of videos about the challenge and just highlighting some awesome ideas and submissions that are coming through it. You may watch the full video of this tutorial at the bottom of this blog.
This is from Greg Phillips, who is an Enterprise DNA expert. He did a lot of great things with Power BI and this is one of them; he is really taking things to another level with this particular submission.
I want to highlight one of the features that he has built that can show you how you can build a reporting system for your organization or for any business function for any industry. Power BI is the most versatile tool to build something like this. All it takes is a little creativity.

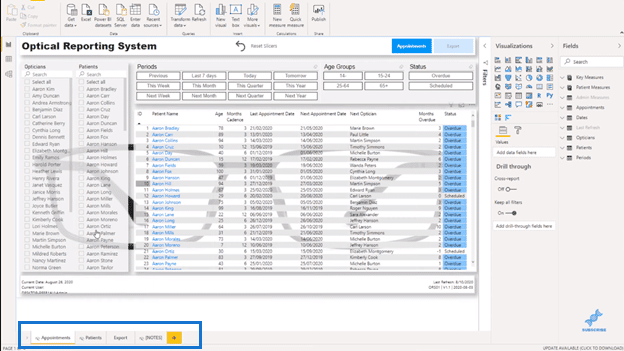
This is an Optical Reporting System for patient data of an optometrist.
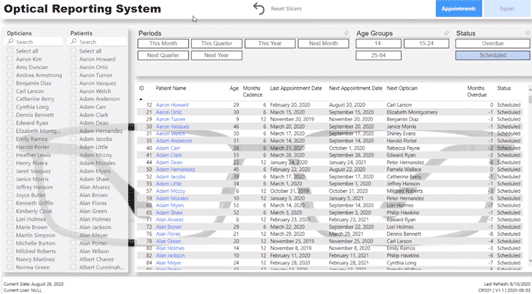
We can drill through to a particular optician or patient. We have some interesting slicers, where we can have a look at some overdue customers, who need either a followup appointment or to schedule a future one.
This is a Web file and it’s the only page that you can see in the web version. Usually, we would have multiple pages that we can navigate in this page section, but not in this case.
To me, this is like a reporting application. It’s not just letting anyone jump into any random area of the report. This allows the user to navigate through the report the way the creator wanted.
Using Drill Through In The Reporting System
We have the patient details here, but if we want to get more high-level information about the patients, we can use the Drill through feature. Just right-click on the patient you want to more information about and click on Drill through and then Patient.
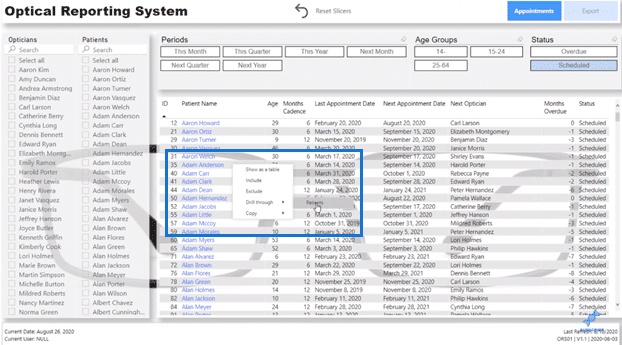
This takes us to a different report page that is hidden in Power BI desktop, but we can navigate to it by that drill through feature from the online version.

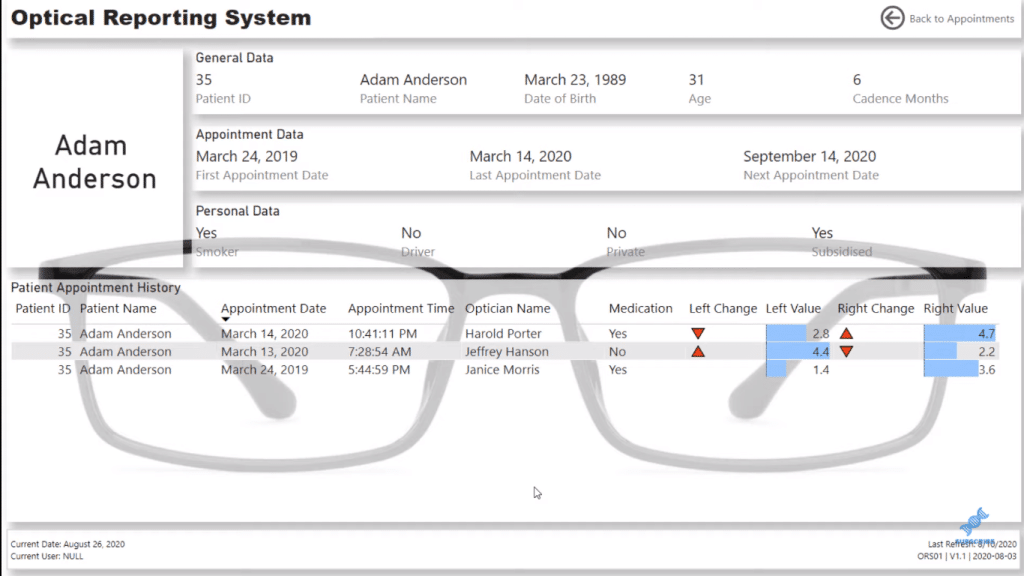
And you see here that there’s no way to place a filter on this particular report page. The filters have to come through the drill-through feature.
There’s quick navigation in the upper-right corner to take us back to the Appointments page.
More Page Navigation
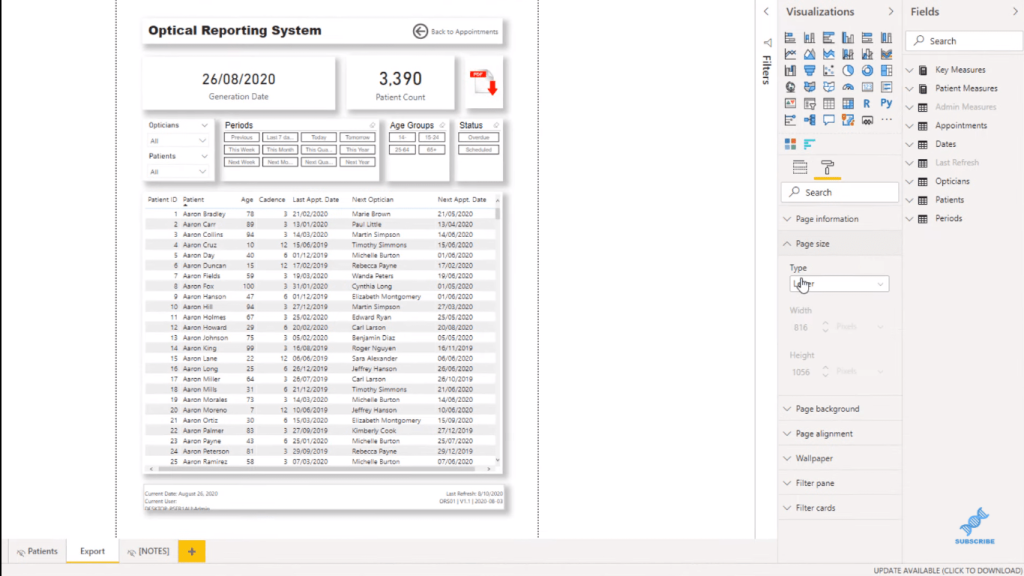
Greg also created this export page because some people still like to print things out. So, Greg created a specific report page where we can download things in a specific format that fits an A4 piece of paper; in Power BI, we can actually change the page size.
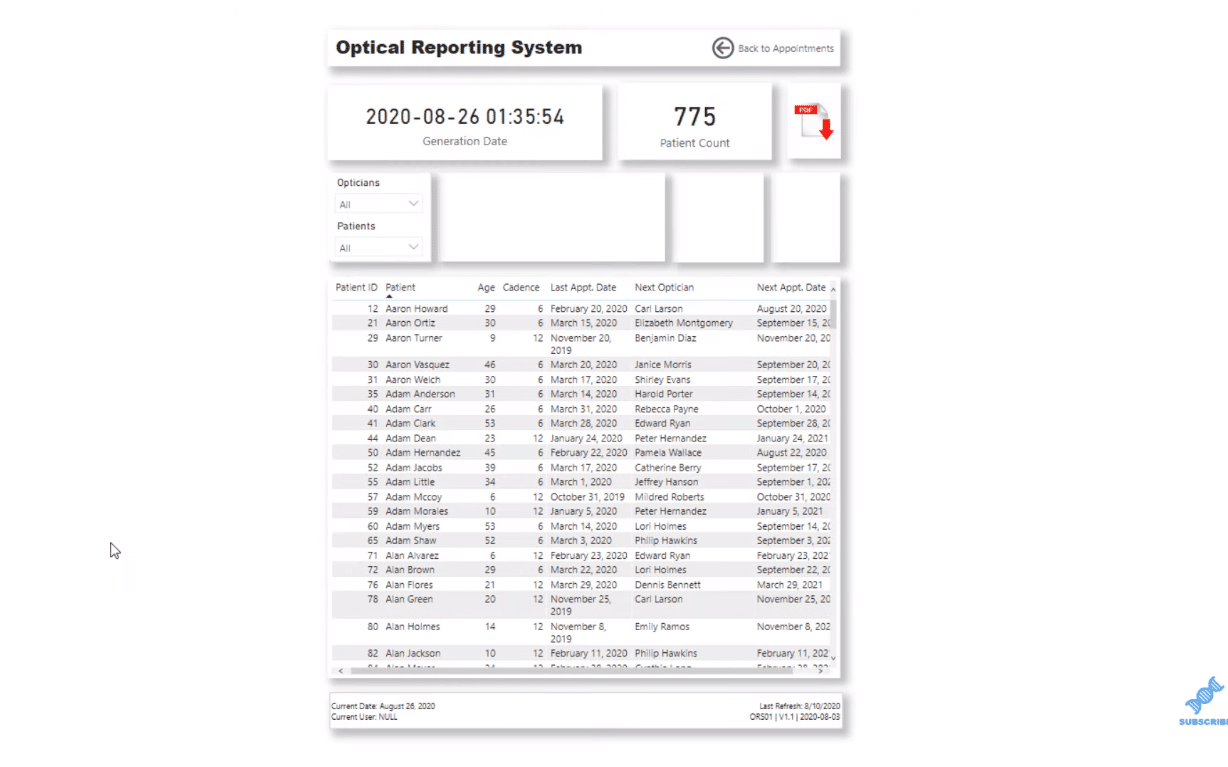
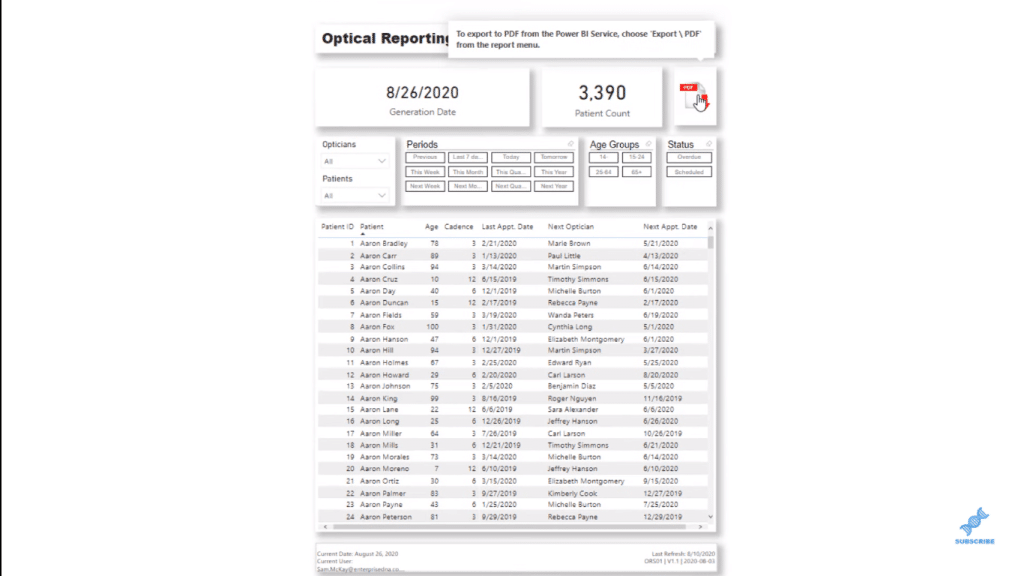
Another interesting thing that he added here is the PDF icon in the upper-right of the page. It doesn’t let you create the PDF from this icon, but it has a tooltip that tells you what to do when you’re in the online service.
A Compelling Reporting System In Power BI
Now let’s just jump to the Power BI desktop file and I’ll run through how this all works. If we look down the bottom here, notice that these pages are hidden.
Greg wants it to be just like a total application-like report. There are no pages to click through. To me, this is a really cool way to create a navigation experience.
And in the Export page, you can see that he specified the page size, which is “Letter”.
The rest of the navigations are the same as the Publish to Web, including the Drill Through. But, when we get to the Export page, we can see the PDF icon that gives us instructions on how to export to PDF from the Power BI Service.
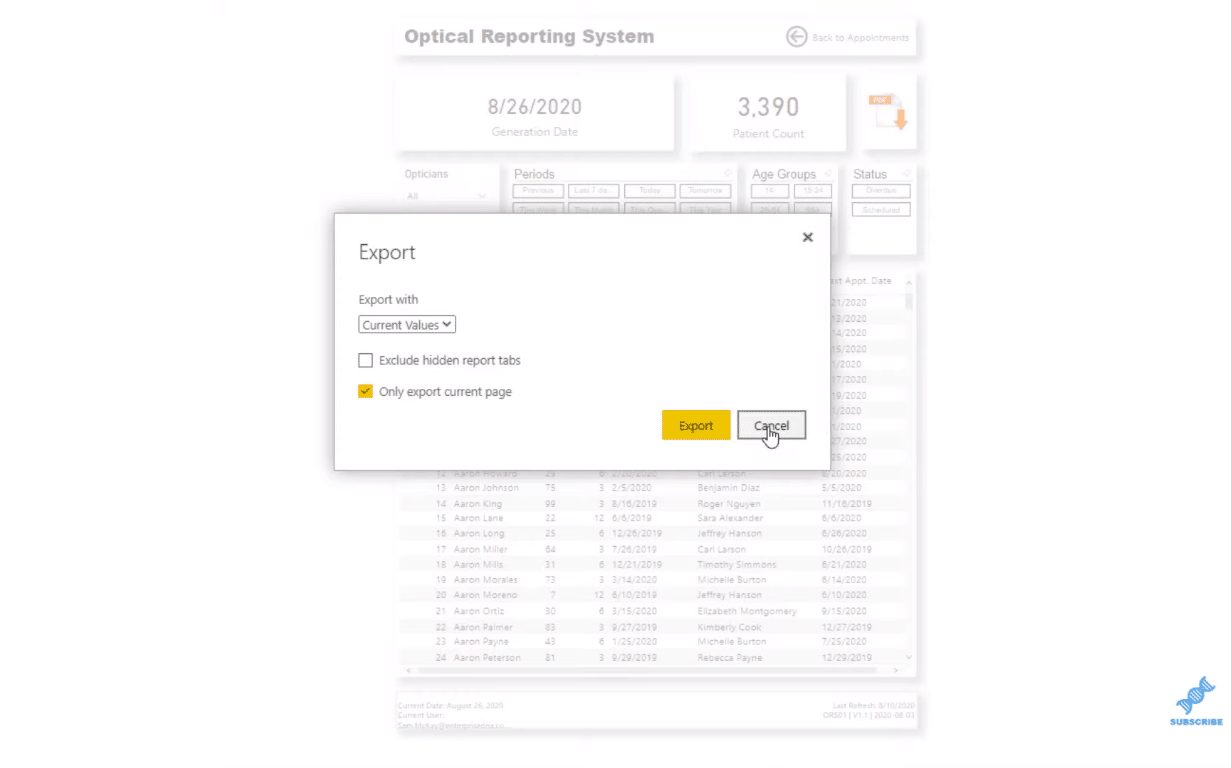
So, we go to Export and then click on PDF.
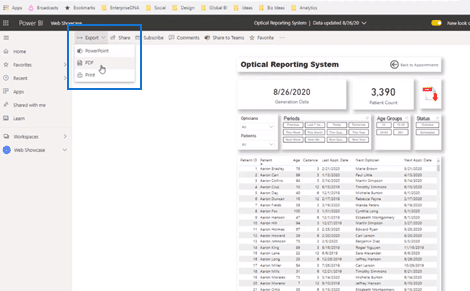
We have a lot of options here. We can choose between Current values and Default values.
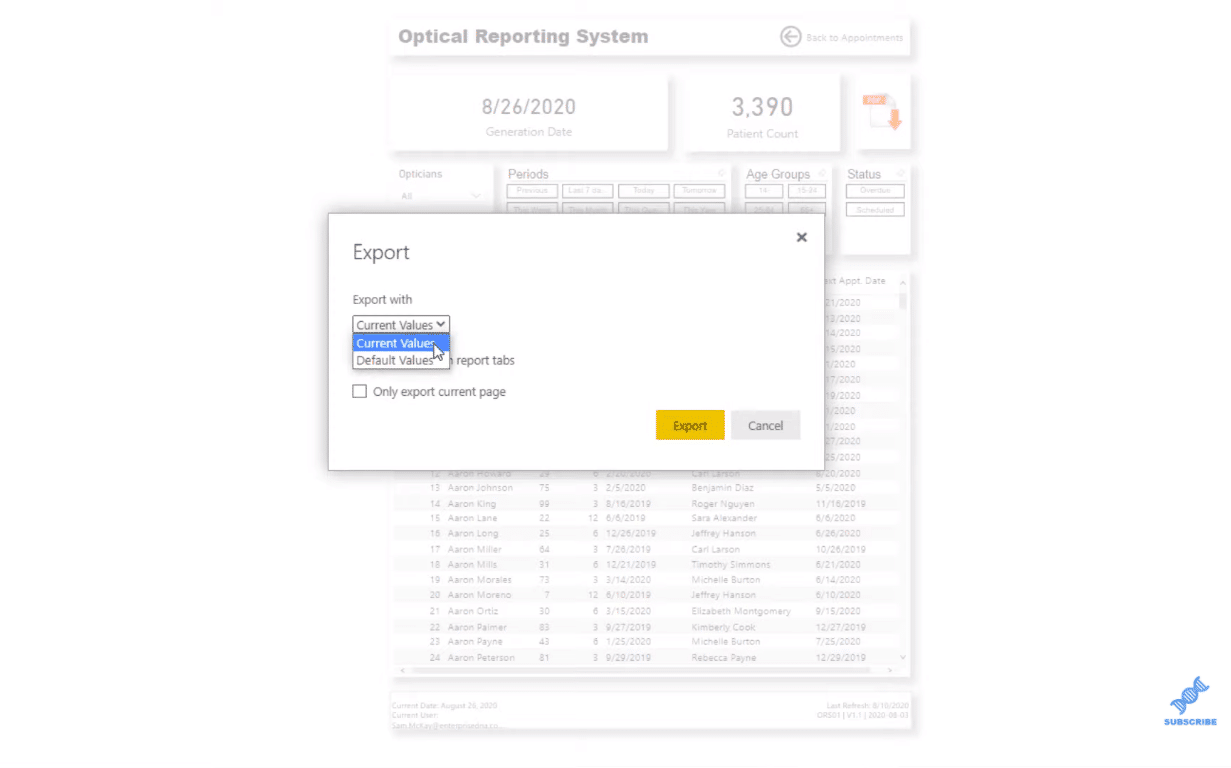
We can even choose to only export the currect page.
***** Related Links *****
Reporting In Power BI: How To Create Information Boxes
How To Add Custom Icons Into Your Power BI Reports
Power BI Financial Reporting Tips and Techniques For Accounting & Finance
Conclusion
Power BI is just a superior tool to build this kind of reporting system and aggregate any data represented in a much more compelling way. You can play around with this and be creative in making it more effective and compelling for your users.
I highly recommend that you do this as well in your own organization. It’s extremely useful and effective.
If you want to learn more about Power BI reporting, check out the links and courses below. Visit our website as well for more Power BI content and tutorials.

Cheers!
Sam


