Today, we’ll go on a deep dive into using a bookmark in Power BI. In some of the previous Enterprise DNA videos that I’ve recently done, I showed you how to use bookmarks in reports to hide certain visuals and how to group bookmarks so you can organize them. You may watch the full video of this tutorial at the bottom of this blog.
There isn’t a whole lot of content out there that goes over the different functions of bookmarks. For example, if we head on over to the Microsoft document for bookmarks, there is little information about the general functionality of bookmarks.
We’re going to dive into that today by focusing more on this area right here:
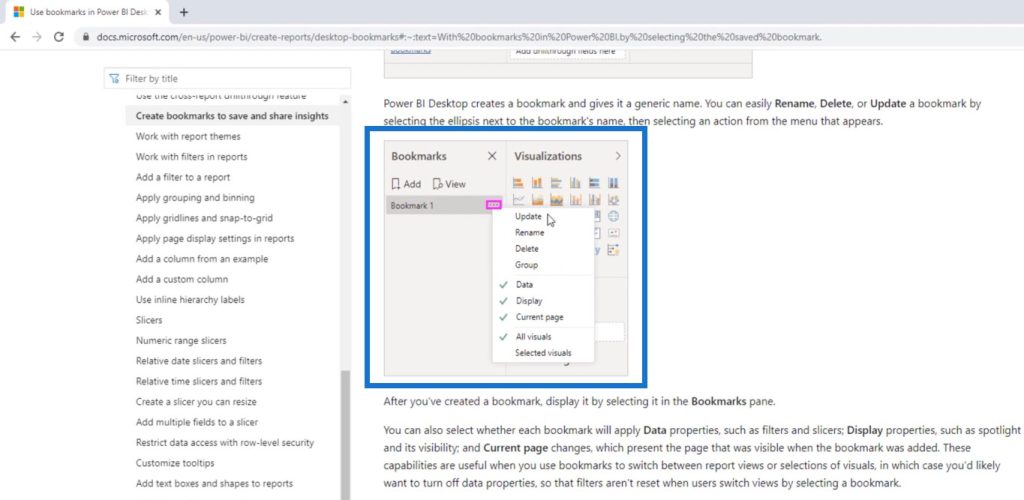
We’ll go through how I set this report up and how each one of these functions within Power BI.

The first thing that we’ll need to do is go to the View tab and click on Bookmarks.
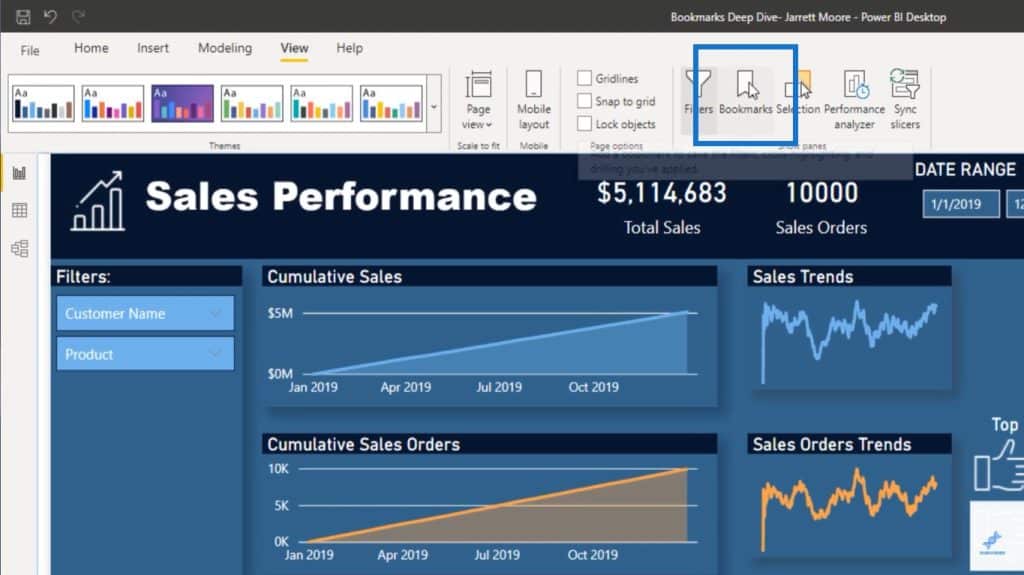
The bookmarks pane gives you a list of the different bookmarks that I have saved throughout this report.

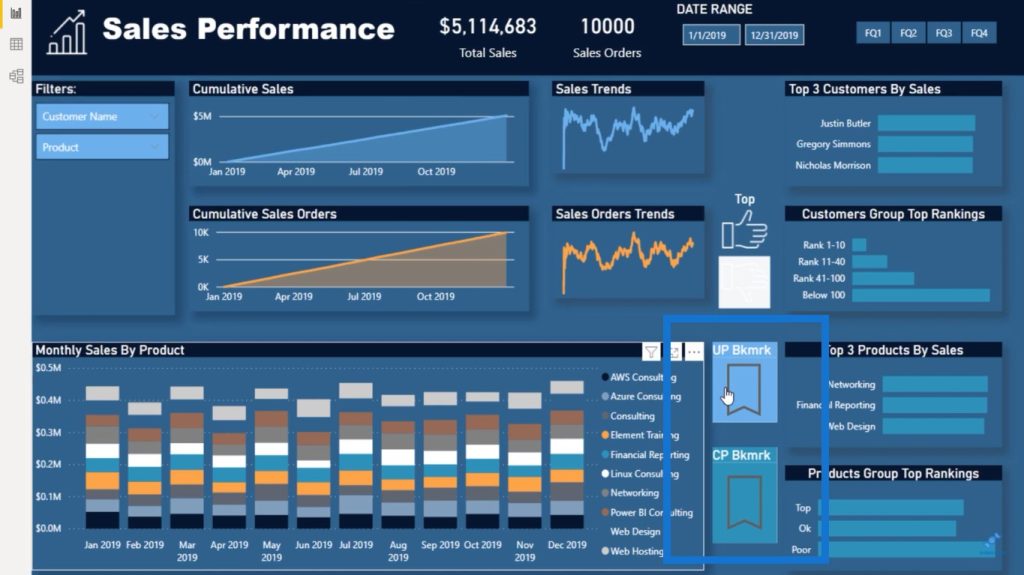
This report, by the way, was actually one of my recent submissions to the Power BI challenges that we’re having on the Enterprise DNA forum. Most of these bookmarks were in there except for these two bookmarks here. These two bookmarks were just created to show you how bookmarks function.
The first thing we’re going to do is click on the Top bookmark.
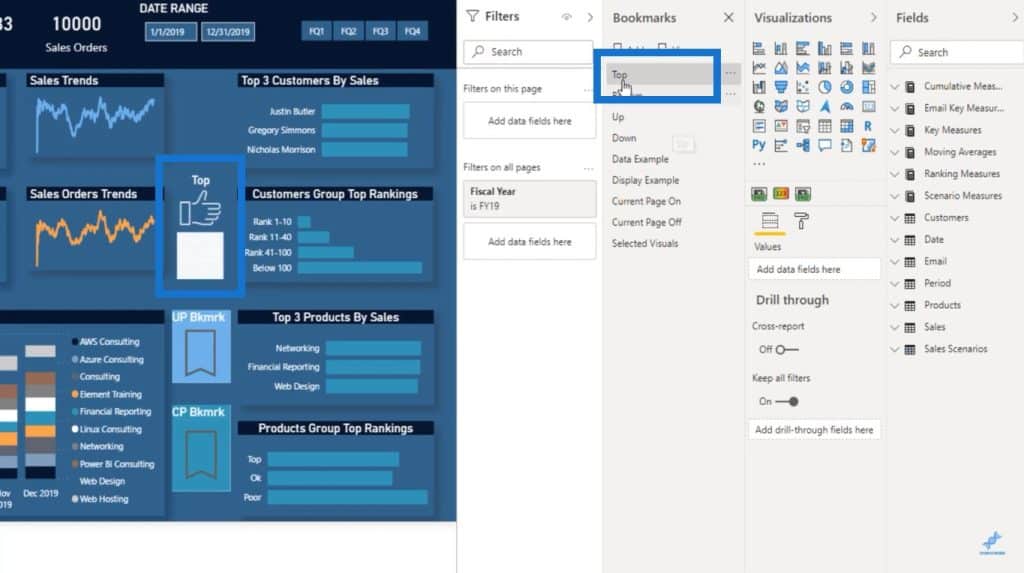
When we click on these three ellipses right beside Top in the bookmarks pane, you will see these options:

The Update function allows you to create a bookmark and make the changes that you want on the report page. You just need to click Update to save the current state of the report.
The Rename function allows you to rename the bookmark in the Bookmarks pane.
The Delete function deletes the current bookmark.
The Group function was something I discussed in one of my videos in Enterprise DNA TV. This function allows you to group your bookmarks by different pages. If I had like 5 or 6 bookmarks on the Sales Scenarios page and another 3 or 4 bookmarks on the Email Performance page, I could group those bookmarks according to what page they’re on. This way, it’s easier to navigate through those bookmarks.
However, today’s main focus would be on the Data, Display, Current Page, and the toggle between All Visuals and Selected Visuals.

So now we’re going to go over the Data Example here, which is a bookmark that I created. If we click on these three ellipses you can see that I have the Data switch here turned off.
When Data is turned off, if I click on one of the filters like Fiscal Quarter 1, it will not change the current state of the page.

But if I have the Data turned on with the green check, it will restate back to the original state where I didn’t have anything selected on the Fiscal Quarters slicer.
Highlighting A Table Using A Bookmark In Power BI
Now, let’s go over to the Display Example. When I click on the three ellipses, you can see I have Data turned off and the Display turned on.
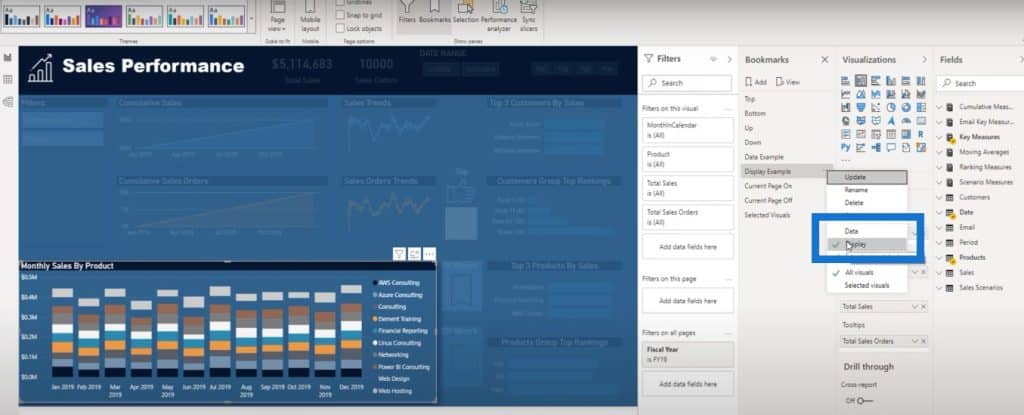
To create this bookmark, I went over here and clicked on More Options, then clicked on Spotlight.
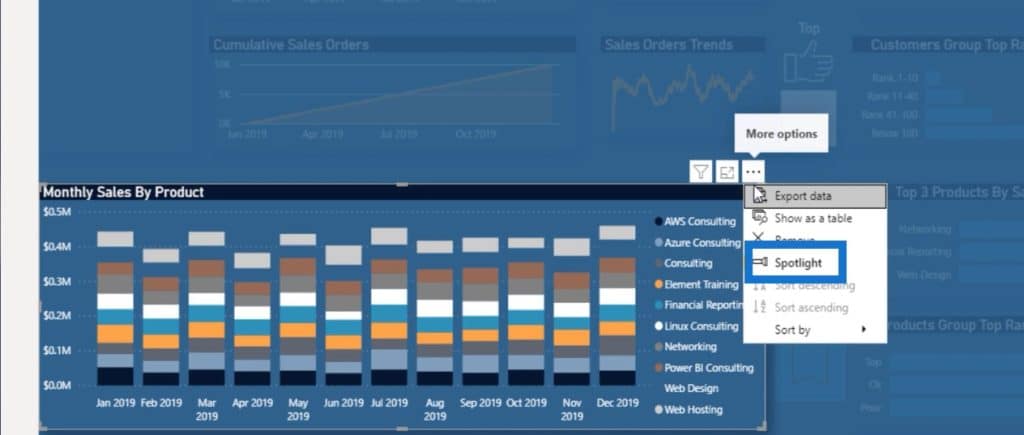
Having Display turned on will show this table at the very bottom of the dashboard while the other tables are not shown. This feature allows you to show particular information and hide everything else at once without having to click over in the Selection pane to hide the other visuals.
Current Page On & Off
I also have two different bookmarks set up here, one for Current Page On and another one for Current Page Off.
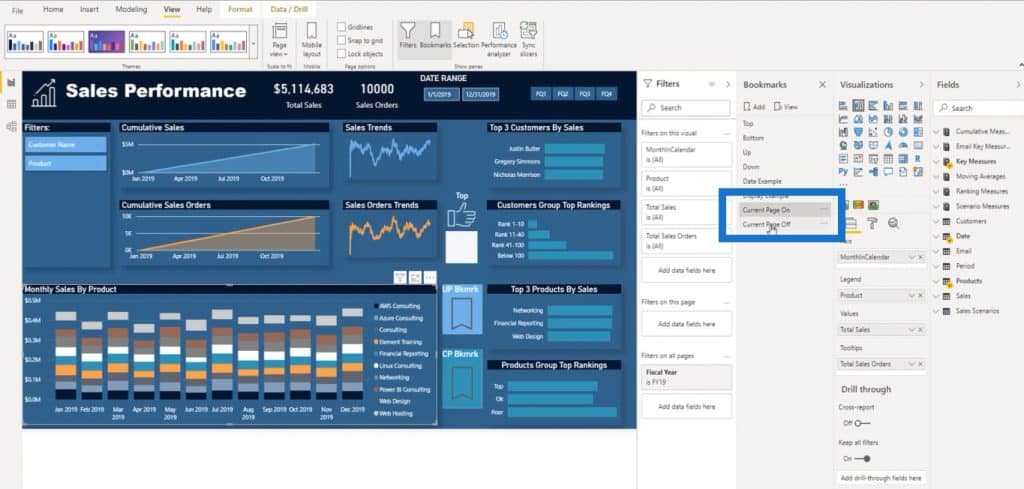
We’ll go through that examples now to show what this switch does inside of the bookmarks. I created this bookmark right here.
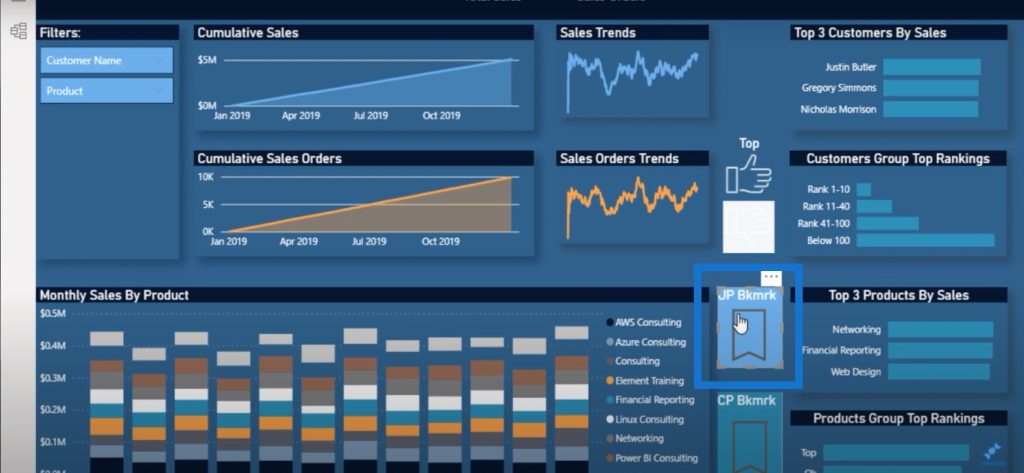
When you click on this bookmark, it’s going to take you to the Up bookmark. I created this by clicking on Action, selecting Bookmark as Type, choosing Up as the Bookmark, and creating a Tooltip.
Inside the Power BI desktop version, you will have to hit on the Control function and click to view, but once you’re viewing your reports on the web, you would just have to click on the bookmark, and not the Control key. So with the current page on, if I click on Control + Left, this is going to take me to the Up bookmark.

You can see that I have the current page turned on.

So if we click on Control + Left mouse click, it takes me to the Up bookmark. When the current page is on, it allows you to jump from page to page.
This is the Current Page Off.

If I highlight this bookmark, we can see that the Action is at Current Page On and once again the tooltip is in there to help the viewer see things easier.

But now if I click on Control + Left, it will not allow me to jump to a different page whereas before it keeps me in the current state because I have the current page turned off. That’s the difference between the current page on and the current page off.
All Selected & Selected Visuals In A Bookmark In Power BI
Now, if I click on Selected Visuals and the three ellipses, there is a toggle between All Visuals and Selected Visuals.

If I had all visuals turned on, the bookmark would affect all of the visuals that are on this page.
But in this example, I have the all visuals turned off. When I saved this bookmark, I went up to this particular slicer of our fiscal quarter. Instead of viewing all four quarters, I just selected FQ1 and turned on the Selected Visuals.
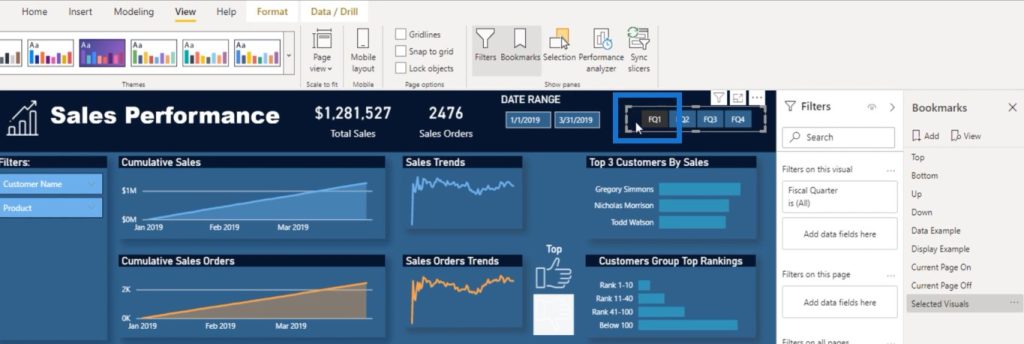
This way, whenever I click on this bookmark, it will only show the selected visual instead of all visuals on the report page.
***** Related Links *****
How To Control The Interactions Of Your Visuals In Power BI
Custom Conditional Formatting Techniques In Power BI
Using Filter Fields & Visual Interactions To Create Compelling Visualizations In Power BI
Conclusion
That’s all I wanted to show for today. I hope you learned something new on how to navigate and use these different options within the bookmarks functions in Power BI. You can use bookmarks to take your reports to the next level.
Cheers,
Jarrett


