In data analysis, interpolation plays a crucial role in estimating values that fall between known data points. This method is commonly used to fill in missing values, predict future trends, and make more accurate assumptions.
You can interpolate in Excel using a combination of functions like the LINEST, TREND, and FORECAST. These Excel functions help you estimate the relationship between variables in your data and predict unknown values based on that relationship.
By learning how to apply these techniques, you can enhance the accuracy of your forecasts and make better-informed decisions.

This article will guide you through the process of interpolation in Excel. We’ll cover the basics of interpolation, the different methods for interpolation, and the steps to perform interpolation in Excel.
We’ll also provide a step-by-step example to help you understand the process.
Let’s get started.
Understanding Interpolation in Excel

In Excel, interpolation is a method used to estimate unknown values that lie between two known values.
It’s a useful technique in data analysis, where you often encounter situations where you have data points at specific intervals and need to predict values at other intervals.
For example, you might have sales data for every month and need to estimate the sales for a particular day within a month.
Interpolation helps you make these estimates with reasonable accuracy.
There are different types of interpolation methods in Excel.
For example, linear interpolation involves estimating unknown values using a straight line that connects two known values.
This method is simple and widely used in various applications.
On the other hand, non-linear interpolation methods, such as polynomial and spline interpolation, involve using curves to estimate values between data points.
These methods are more complex but can provide more accurate estimates when the relationship between data points is not linear.
How to Perform Interpolation in Excel
In Excel, there are multiple ways to perform interpolation, depending on the type of data you’re working with and the specific requirements of your analysis.
In this section, we’ll explore some of the key interpolation methods and how to apply them in Excel.
1. Linear Interpolation
Linear interpolation is a simple and commonly used method for estimating unknown values between two known data points.
It assumes a linear relationship between the data points.
To perform linear interpolation in Excel, you can use the LINEST function to calculate the slope and intercept of the line that best fits your data.
The FORECAST function can then be used to predict the unknown value based on the known data points and the calculated slope and intercept.
LINEST Function
The following is the syntax for the LINEST function:

known_y’s: This is the known y-values (dependent variable) in your data.
known_x’s: This is the known x-values (independent variable) in your data.
const: This is an optional argument that allows you to force the intercept to be 0. If you set const to TRUE, the intercept will be 0. If you set it to FALSE or leave it blank, Excel will calculate the intercept normally.
The following is an example of the LINEST function:
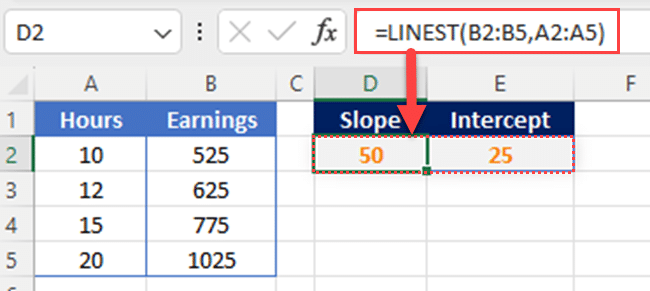
The result will be the array {50,25}, where the first value is the slope and the second value is the intercept.
FORECAST Function
Once you have the slope and intercept, you can use the FORECAST function to predict the y-value (dependent variable) at a specific x-value (independent variable).
The syntax for the FORECAST function is as follows:

x: This is the x-value (independent variable) at which you want to predict the y-value.
known_y’s: This is the known y-values (dependent variable) in your existing data.
known_x’s: This is the known x-values (independent variable) in your existing data set.
const: This is an optional argument that allows you to force the intercept to be 0. If you set const to TRUE, the intercept will be 0. If you set it to FALSE or leave it blank, Excel will calculate the intercept normally.
The following is an example of the FORECAST function to predict the y-value at an x-value of 14:
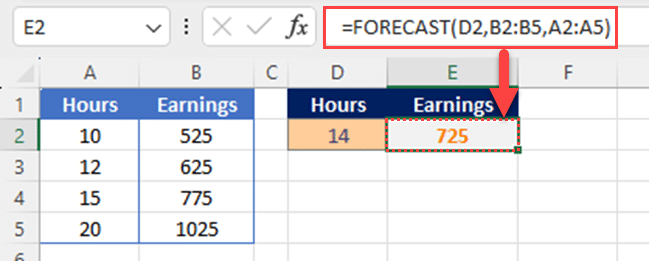
The result will be 725, which is the predicted y-value at an x-value of 14.
2. Polynomial Interpolation
Polynomial interpolation is a more complex method for estimating unknown values between data points.
It assumes a polynomial relationship between the data points and can provide more accurate estimates than linear interpolation.
To perform polynomial interpolation in Excel, you can use the TREND function.
This function calculates the y-values for a series of new x-values based on the existing x and y values (given data).
The syntax for the TREND function is as follows:

known_y’s: This is the known y-values (dependent variable) in your data.
known_x’s: This is the known x-values (independent variable) in your data.
new_x’s: This is the new x-values at which you want to predict the y-values.
const: This is an optional argument that allows you to force the intercept to be 0. If you set const to TRUE, the intercept will be 0. If you set it to FALSE or leave it blank, Excel will calculate the intercept normally.
The following is an example of the TREND function to predict the y-value at an x-value of 14:
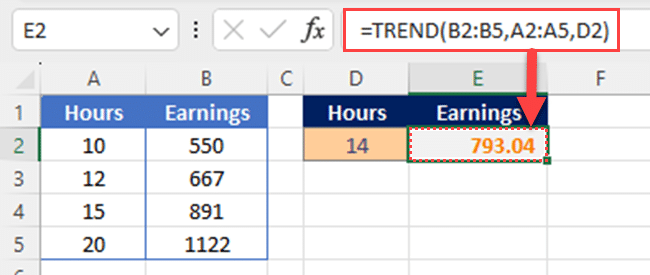
The result will be 793.04, which is the predicted y-value at an x-value of 14.
3. Forecasting
Forecasting is a type of interpolation used to predict future values based on historical data.
It is a common technique in business and finance to make informed decisions about future trends and outcomes.
In Excel, you can use the FORECAST.ETS and FORECAST.ETS.CONFINT functions for time series forecasting.
These functions use Exponential Smoothing (ETS) to estimate future values.
FORECAST.ETS Function
The syntax for the FORECAST.ETS function is as follows:

target_date: This is the cell containing the date or time for which you want to forecast the value.
values: This is the range of cells containing the historical data.
timeline: This is the range of cells containing the corresponding dates or times for the historical data.
seasonality: This is an optional argument that specifies the length of the seasonal pattern. If you leave this argument blank, Excel will automatically detect the seasonality.
data_completion: This is an optional argument that specifies how Excel should handle incomplete data. If you set this argument to TRUE, Excel will complete the data series with forecasted values. If you set it to FALSE or leave it blank, Excel will only forecast the values for the dates or times specified in the new_timeline argument.
The following is an example of the FORECAST.ETS function:
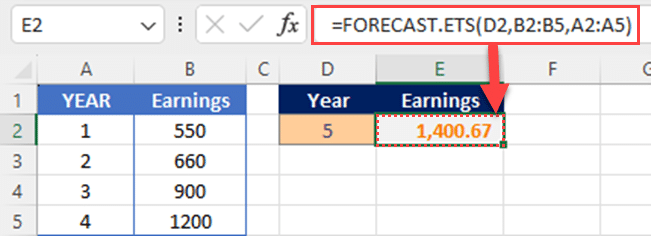
The result will be 1400.67, which is the forecasted value for the year specified in cell D2.
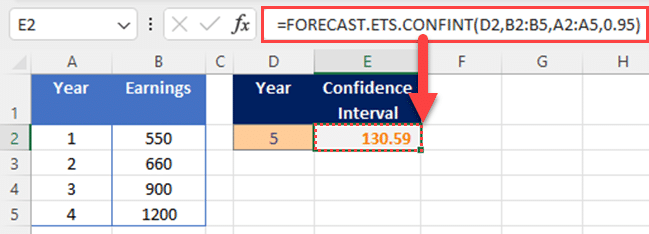
FORECAST.ETS.CONFINT Function
The FORECAST.ETS.CONFINT function can be used to calculate the confidence interval for the forecast.
The syntax for this function is as follows:

target_date: This is the cell containing the date or time for which you want to forecast the value.
values: This is the range of cells containing the historical data.
timeline: This is the range of cells containing the corresponding dates or times for the historical data.
confidence_level: This is the confidence level for the interval. For example, if you want a 95% confidence interval, you would set this argument to 0.95.
The following is an example of the FORECAST.ETS.CONFINT function:
Final Thoughts
Interpolation in Excel is a powerful technique that enables you to estimate values between known data points.
This method is essential in data analysis and helps in making informed decisions based on incomplete or limited data.
Excel offers various interpolation functions such as LINEST, TREND, and FORECAST that can be used to perform both linear and non-linear interpolation.
When applying interpolation in Excel, it’s crucial to understand the underlying assumptions and the type of relationship between the data points.
Linear interpolation assumes a straight-line relationship, while non-linear interpolation methods like polynomial and spline interpolation allow for more complex relationships.
As with any data analysis tool, it’s important to validate your results and consider the limitations of the interpolation method used.
In some cases, extrapolation (estimating values beyond the range of known data) may be necessary, but it comes with greater uncertainty.
By mastering interpolation in Excel, you can enhance your data analysis skills and make more accurate predictions in various domains.
If you’d like to learn how to Clean Your Data Like A Pro, check out the video below:
Frequently Asked Questions
How to interpolate in Excel with LINEST and INDEX functions?
You can use the LINEST function to calculate the slope and intercept of a linear regression line and the INDEX function to interpolate values. First, use the LINEST function to calculate the slope and intercept, then use the INDEX function to find the interpolated value using the slope, intercept, and known x-values.
What is the method to perform linear interpolation in Excel?
To perform linear interpolation in Excel, you can use the FORECAST function. First, calculate the slope and intercept using the LINEST function. Then, use the FORECAST function to find the interpolated value using the slope, intercept, and known x-values.
How to use INDEX and MATCH functions for interpolation in Excel?
The INDEX and MATCH functions can be used for linear interpolation in Excel. First, use the MATCH function to find the position of the lower value, then use the INDEX function to retrieve the corresponding value. Calculate the fractional position between the two data points and interpolate the value using the lower and upper values and the fractional position.
How to perform non-linear interpolation in Excel?
To perform non-linear interpolation in Excel, you can use the FORECAST and GROWTH functions. First, calculate the growth rate and y-intercept using the GROWTH function. Then, use the FORECAST function to find the interpolated value using the growth rate, y-intercept, and known x-values.


