In this tutorial, I’m going to show you how to create unique subtotals in your Power BI tables using the SWITCH TRUE logic. You may watch the full video of this tutorial at the bottom of this blog.
This is a breakout session from a financial reporting course released by Enterprise DNA.

The session includes a detailed application of a variety of financial reports such as income statements, balance sheets, and cash flow statements.
This technique focuses on how you can create generic template designs and subtotals.
General tables in Power BI don’t give you enough flexibility. They’re very limited in terms of creating unique custom designs or summary calculations.
Thus, this tutorial will walk you through the methods you can use to create subtotals like Total Revenue, Total Cost of Goods Sold, and Total Profits, along with how to place them into your preferred format in your reports.
Creating A Template In Excel
The first thing you need is to set up a template containing your subtotals in Microsoft Excel.
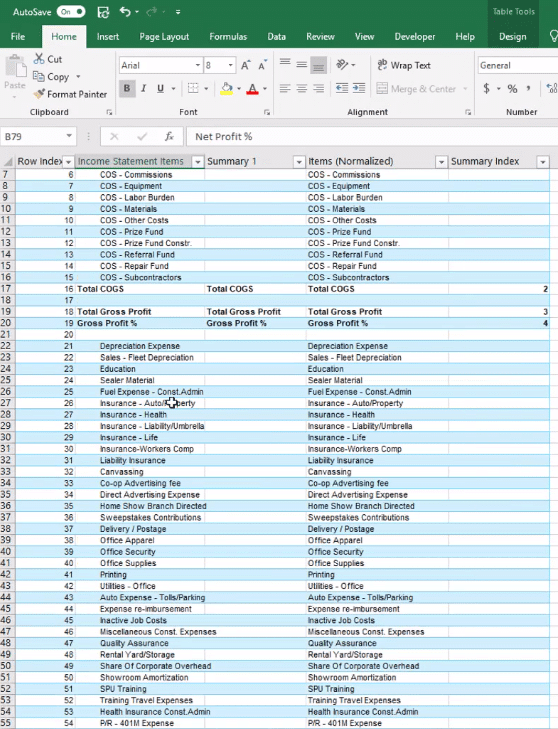
For this example, you can see that there’s Total Revenue, Cost of Goods Sold, and Gross Profit Percent:
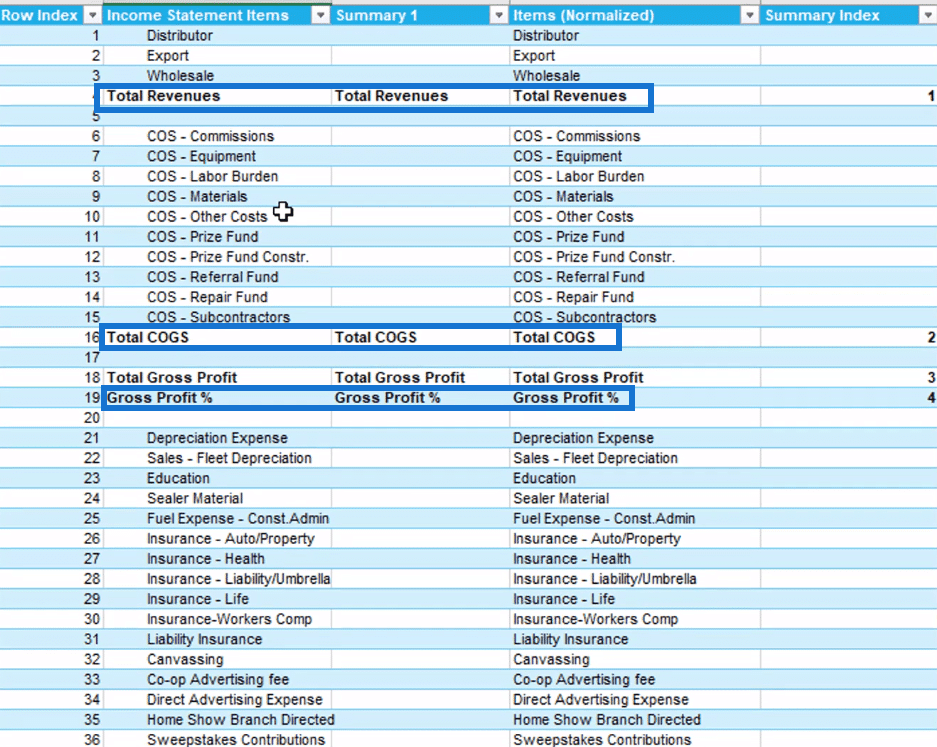
You need to make sure that the calculations are in the correct spots in the template table.
This is the data model used for this example:
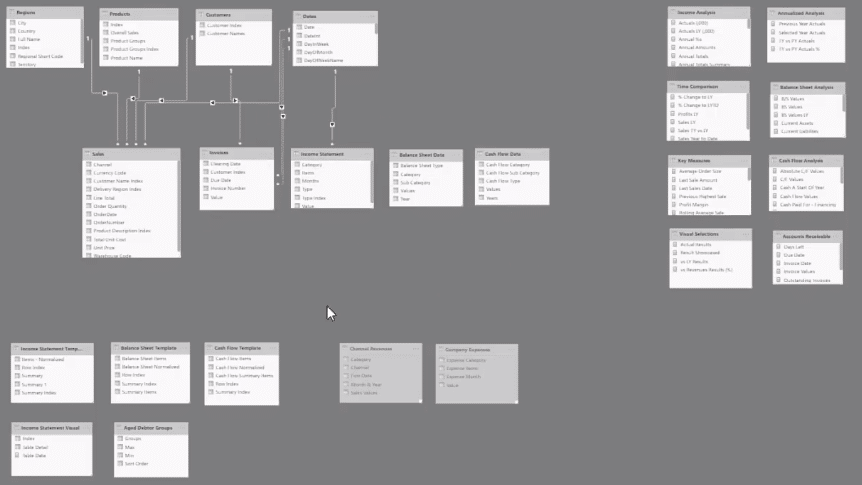
It contains the financial calculations and relationships used to create the report. It’s just a matter of allocating this raw data into a specific template.
Formulas Used For Subtotals
You need to create unique measures for each subtotal in Power BI.
For the Revenue, you need to have a separate measure which calculates the subtotal amount:

A different measure is also used to calculate the Cost of Goods Sold:

This is the formula for the Total Gross Profit:

Once you’ve created the subtotals in Power BI, you must allocate these to the correct rows in your template table.
Using The SWITCH TRUE Logic
You need to use the SWITCH TRUE logic to allocate the subtotals in specific rows within the report.
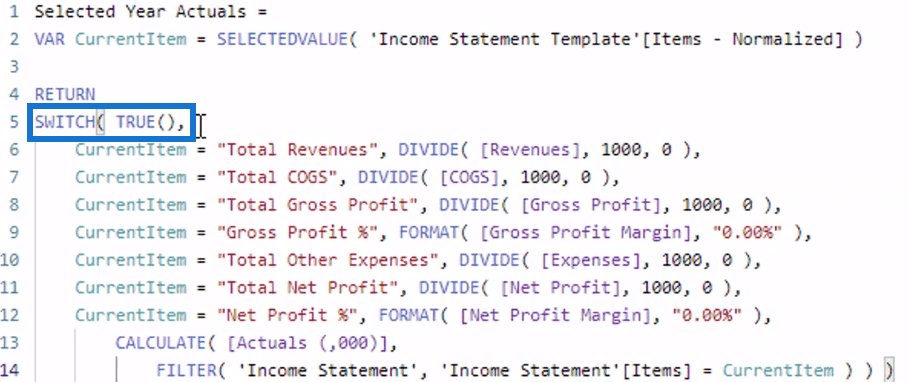
This formula logic is better compared to using nested IF statements.
For every single row in the table, it’s trying to work out the current row that you are in. If it matches, it will evaluate to TRUE, and will then input the subtotal measure to that row:
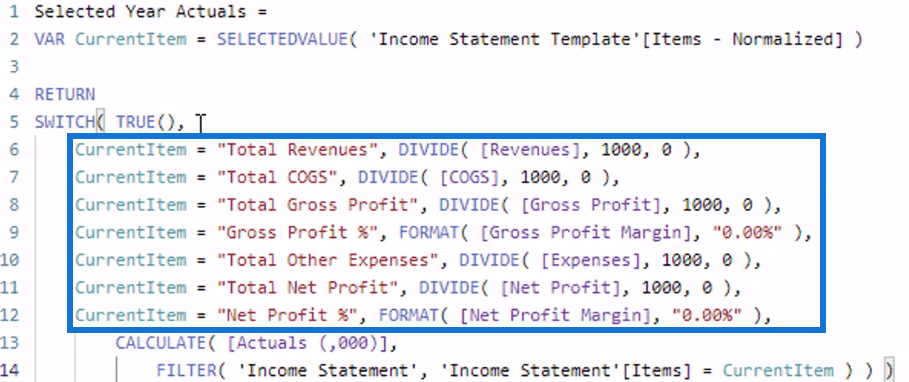
The DIVIDE function is simply used to reduce the figure from millions to thousands; it’s easier on the eyes. This portion in the formula will depend on the measures you have.
If you’re in a subtotal row, the formula will place the subtotal measure there. It will do that for all the subtotals you’ve created.
You can use this to create any unique table. All you have to do is use SWITCH TRUE to allocate the measures to a specific row in a table.
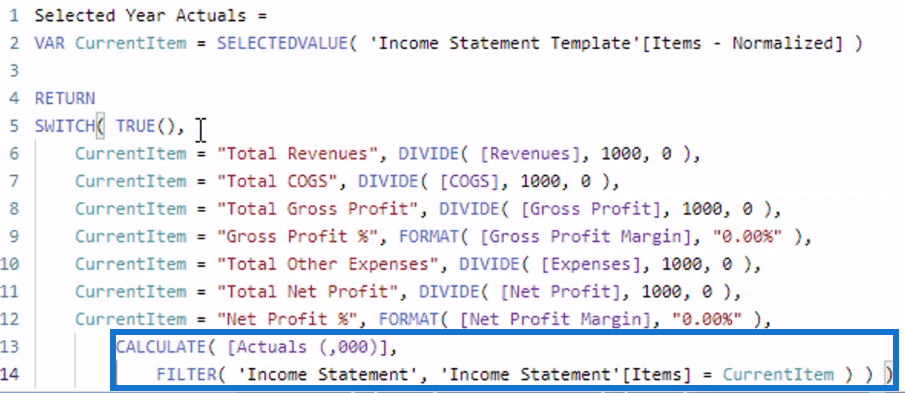
For those rows that aren’t subtotals, all you need to use is a SUMIF formula in Microsoft Excel.
If an amount doesn’t belong to any subtotal, this part of the formula will work out its row in the table and then allocate the calculation to that row.
Conclusion
To summarize, you first need to calculate your subtotals in a template and then use SWITCH TRUE to allocate them to their respective rows in the Power BI table.
When you compare it to nested IF statements, the SWITCH TRUE logic simplifies the formula and makes it easier to understand.
The technique used in this tutorial is also reusable. You can use it to create any type of unique table in Power BI.
If you want to review the full course module, check out the Enterprise DNA website.
All the best,
Sam
***** Related Links *****
Power BI Financial Reporting: Allocating Results To Templates At Every Single Row
Power BI Financial Reporting Tips And Techniques For Accounting & Finance
Power BI Reporting Templates Expanded – Power BI Visualization Concepts
***** Related Course Modules *****
Financial Reporting W/ Power BI
Scenario Method Workshops
DAX Formula Deep Dives
***** Related Support Forum Posts *****
Financial Reporting In Power BI – Custom Subtotals
Finance Template And Dozens Of Subtotals And Totals
DAX For Dynamic Subtotals & Grand Total
For more subtotal support queries to review see here….


