In this tutorial, you will learn how to create a list and page break in Microsoft Report Builder. A list is a simple, free-form report layout that is mainly used when dealing with grouped data. It displays your data in a tabular format, similar to an Excel spreadsheet.
You can customize the appearance of your list by changing the font, color, and other formatting options. You can also apply filters and sort your data to highlight specific information.
Setting Up The Report
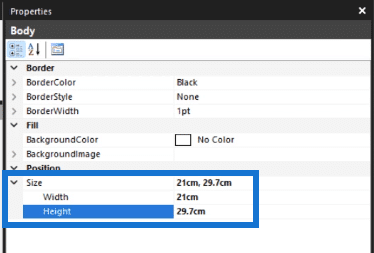
The first thing you need to do is set up the basic structure of your report. The report page is 21cm wide and 29.7cm long in this example.
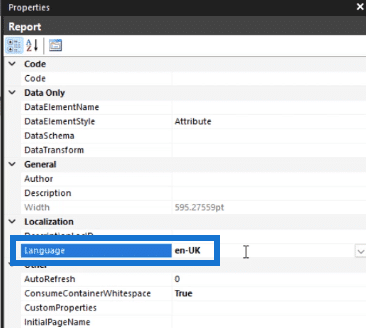
Next, set your preferred language. In this case, it’s en-GB which means that the report will use the English (Great Britain) language. This step sets the language properties for the entire report.
You can also click on the Property Pages button. This opens the Report Properties window, where you can make additional formatting changes to your paginated report.
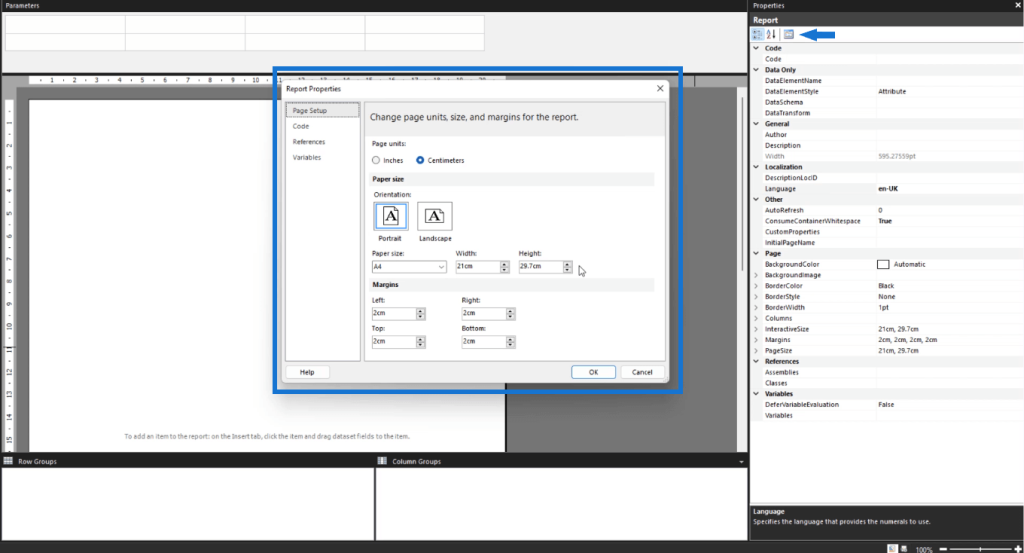
You can make further changes to the elements in your report, such as the margins, position, and borders, according to your preference.
Creating A List In Microsoft Report Builder
To add a list to your paginated report, go to the Insert tab and select List.

Drag your mouse pointer to control the size and position of the list.
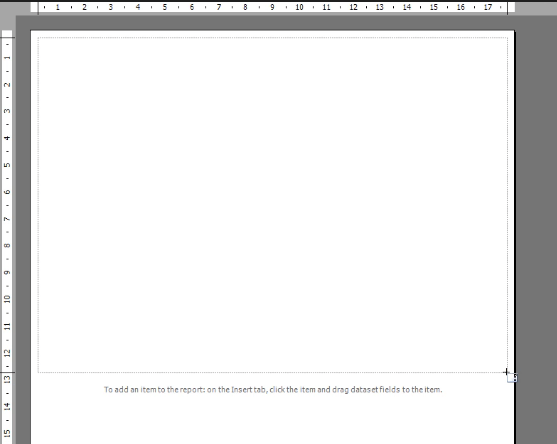
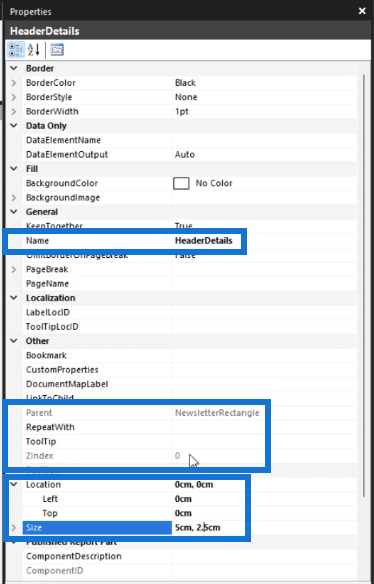
You can make further changes by using the Properties pane.
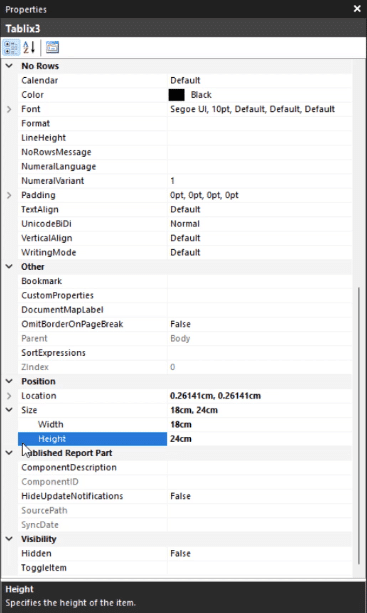
Depending on the size of the item you inserted, other formatting elements on the page can be affected. So make sure to review and make changes when necessary.
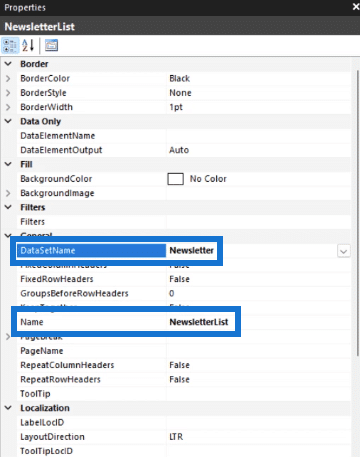
It’s a best practice to give distinct names to each item you insert in your report. This is especially useful when you need to make changes in the future because it’ll be easier to identify and locate the items.
Assign the DataSetName option to the data set you want in your list. In this case, it’s the Newsletter data set.
Adding Page Breaks In Microsoft Report Builder
Since this example is using a regional newsletter, you need to be able to group by region. To group data by region, you need to add a page break.
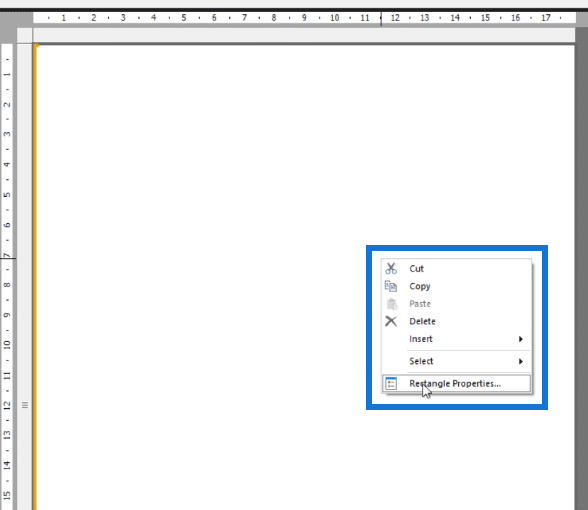
To do that, right-click on your canvas and select Rectangle Properties.
In the Rectangle Properties window, select the page break you want to apply to your report.
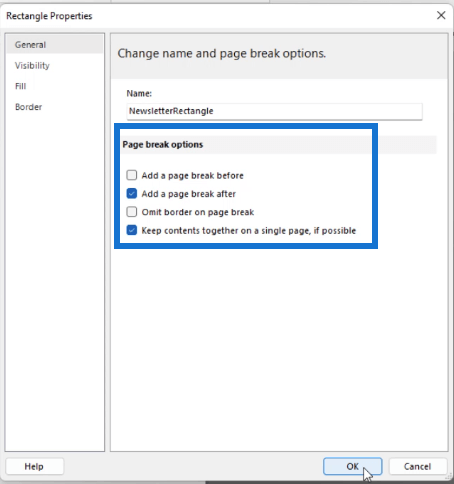
In this case, the page breaks are added after each group. This will automatically create a separate page for each region territory.
To add groups to your list, go to the bottom part of Report Builder. You’ll see headings for the Row Groups and the Column Groups. Under Row Groups, click the drop-down arrow, choose Add Group, and then Parent Group.

Since you’ve already linked the list to the dataset, you can see the different fields you can choose as groups.
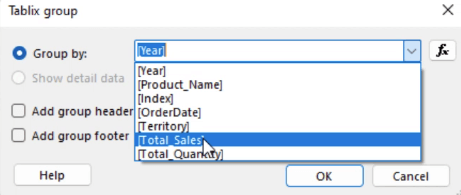
In this case, the list is grouped by Territory. Once you click OK, you’ll see that a Territory column appears on your canvas.

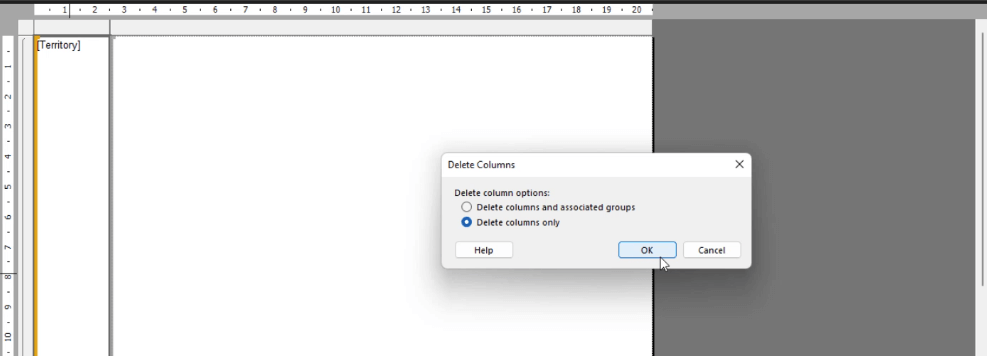
To remove this, right-click on it and select Delete Columns. When the pop-up window appears, choose Delete columns only. This deletes the column while retaining the group by formatting.
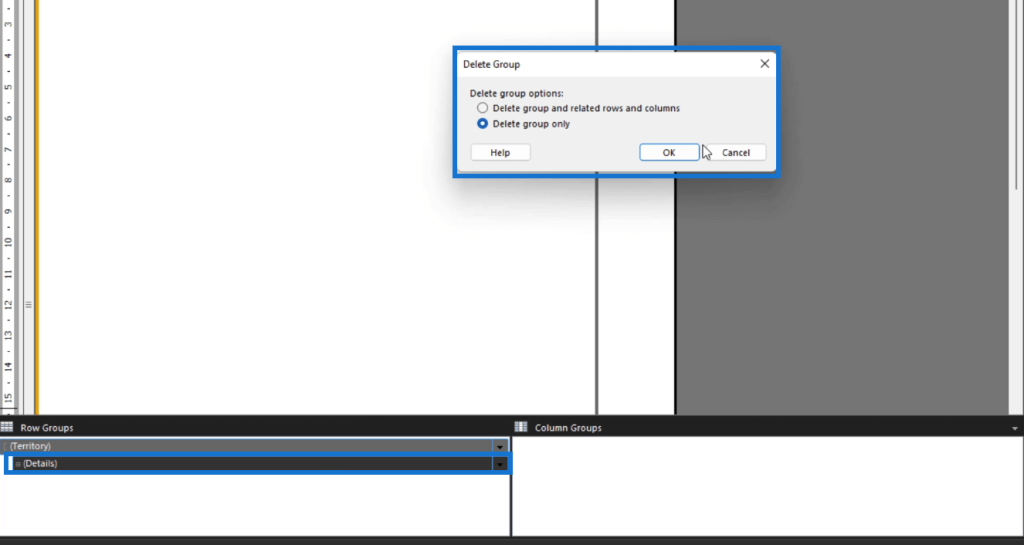
Do the same for the rows. Click the drop-down arrow for Details in the Row Groups and select Delete Group. When the pop-up window appears, choose Delete group only.
Adding Elements In the List
To add elements to your list, right-click on it and select Insert. Then, choose what you want to add. In this case, a Rectangle is added. This will cluster the text elements in your Territory group.
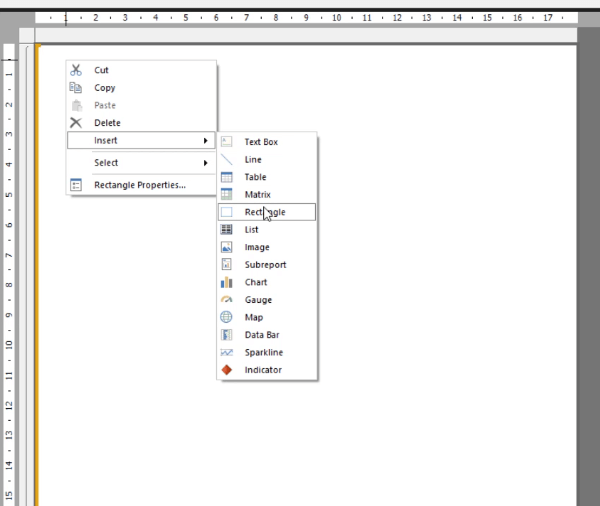
Again, make sure to rename each element and perform the formatting changes you need.
***** Related Links *****
Create A Paginated Report: Adding Texts & Images
Paginated Report In Power BI: An Introduction
Report Builder Tutorial: How To Add A Table
Conclusion
In conclusion, creating a list in Microsoft Report Builder is a useful tool for organizing and displaying data in a clear and concise manner. Whether you are working with a small or a large dataset, a list can help you present your information in a way that is easy to understand and analyze.
By following the steps outlined in this article, you can easily create a list that can be customized to meet the specific needs of your report.
All the best,
Sue Bayes


