In this post, I’m going to show you what is probably the quickest and most effective way to create a detailed date table in Power BI. You may watch the full video of this tutorial at the bottom of this blog.
If you want to analyze anything over time, there is likely no more important table to create for any Power BI model than a great date table.
Creating The Date Table In Power BI
A date table can be created in a few ways. In this example I use ‘M’ code within the query editor.
If you want to follow along, you can download the code within this course:
Ultimate Beginners Guide to Power BI
Look for the file that looks like this one below.
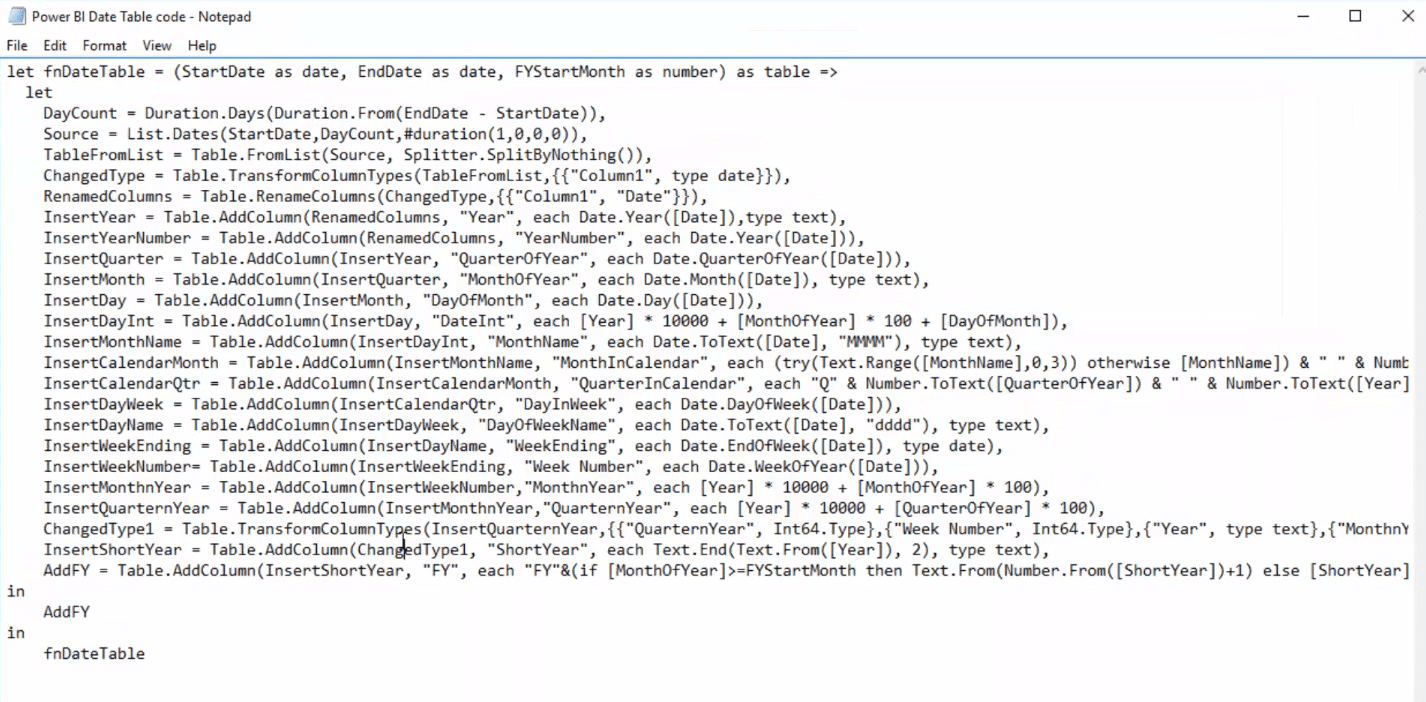
Now, we can dive into creating our date table.
1. Create A Blank Query
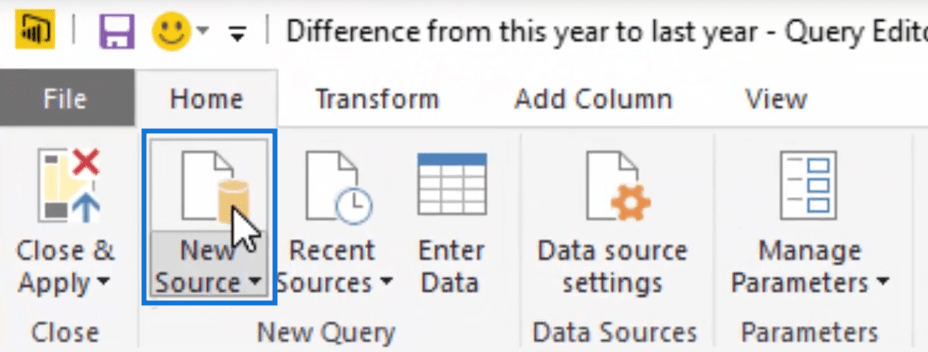
The first thing that we have to do is to create a blank query. To do this, select New Source.
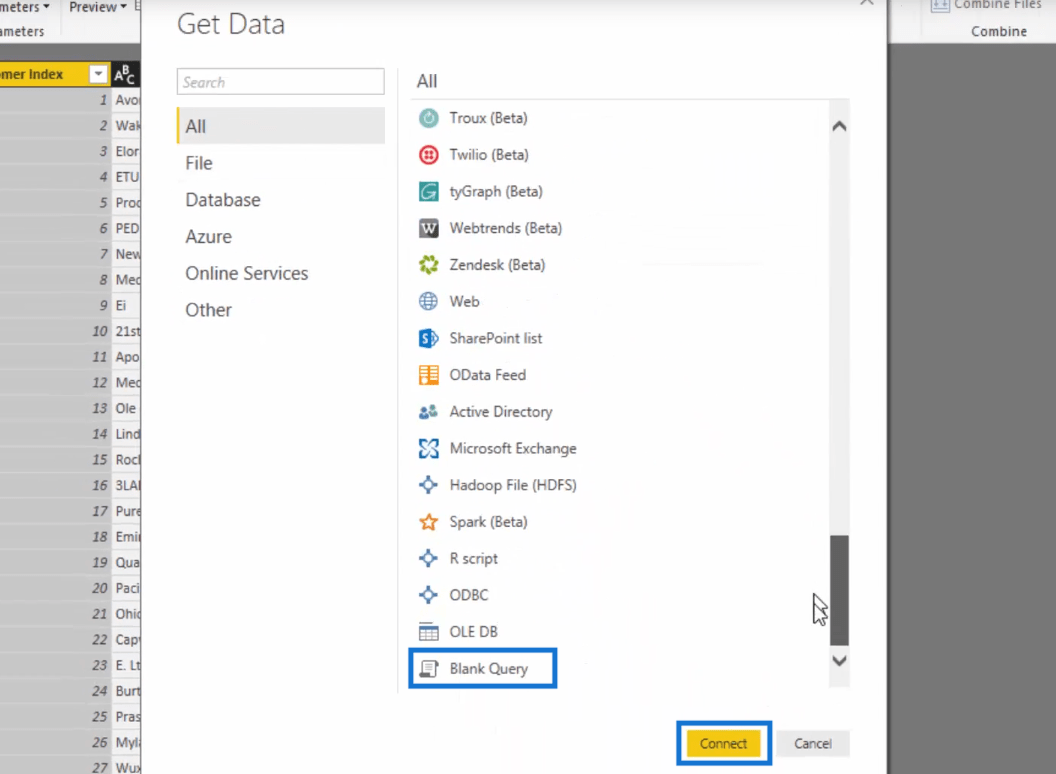
You’ll get a pop up window like this one below.
Just scroll down and look for the Blank Query Option. Select this option and then click Connect.
After clicking Connect, you’ll get a blank query.

2. Using The ‘M’ Code
The next step now is to change the code that is within this query. This is where the ‘M’ Code comes in.
So select the Advanced Editor on top.
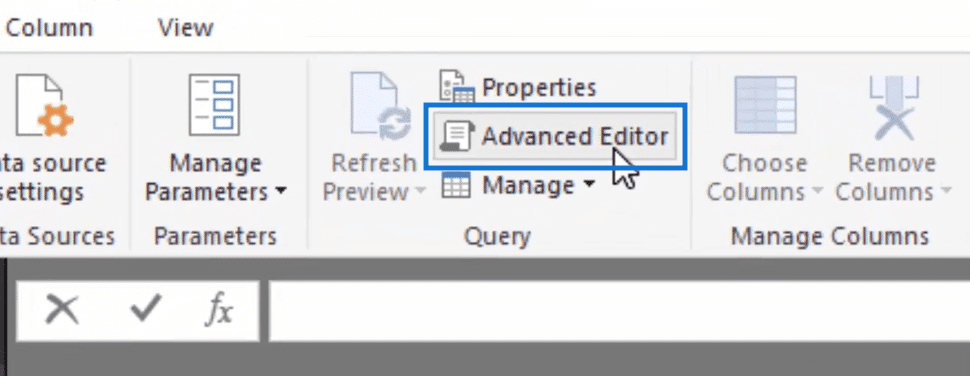
You’ll get an Advanced Editor pop up window with some existing text. Delete this text then copy and paste the date table code onto the Advanced Editor.
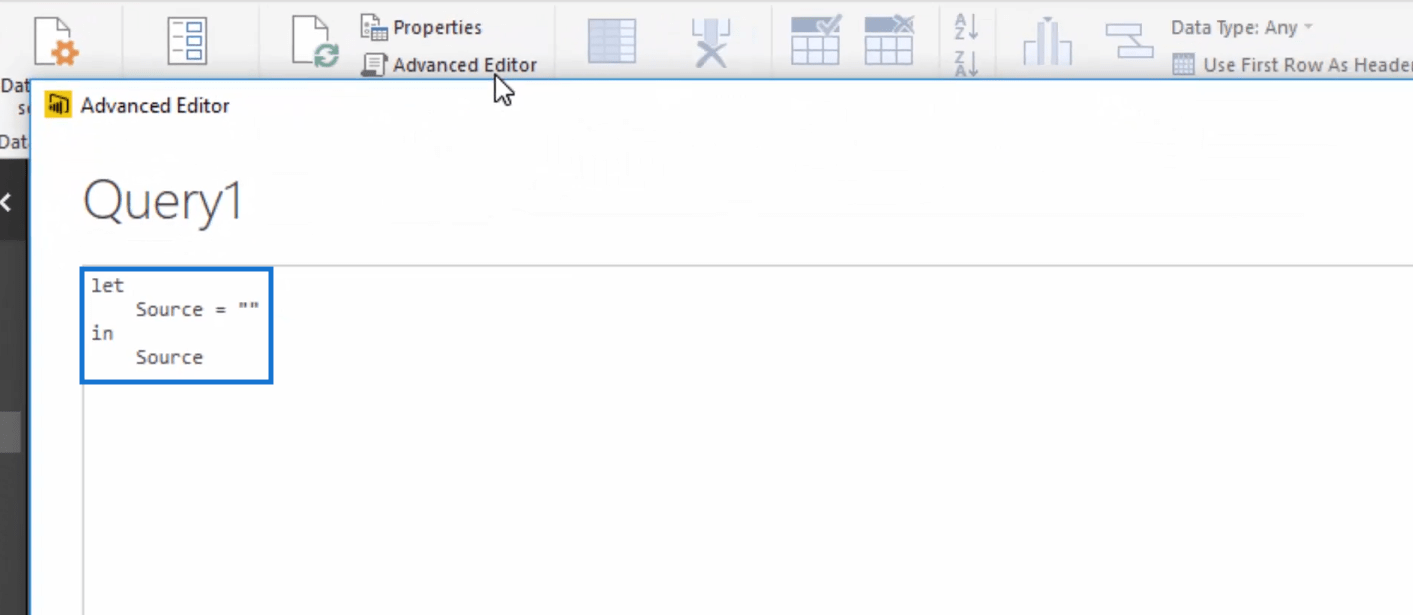
You should have something that looks similar to this.
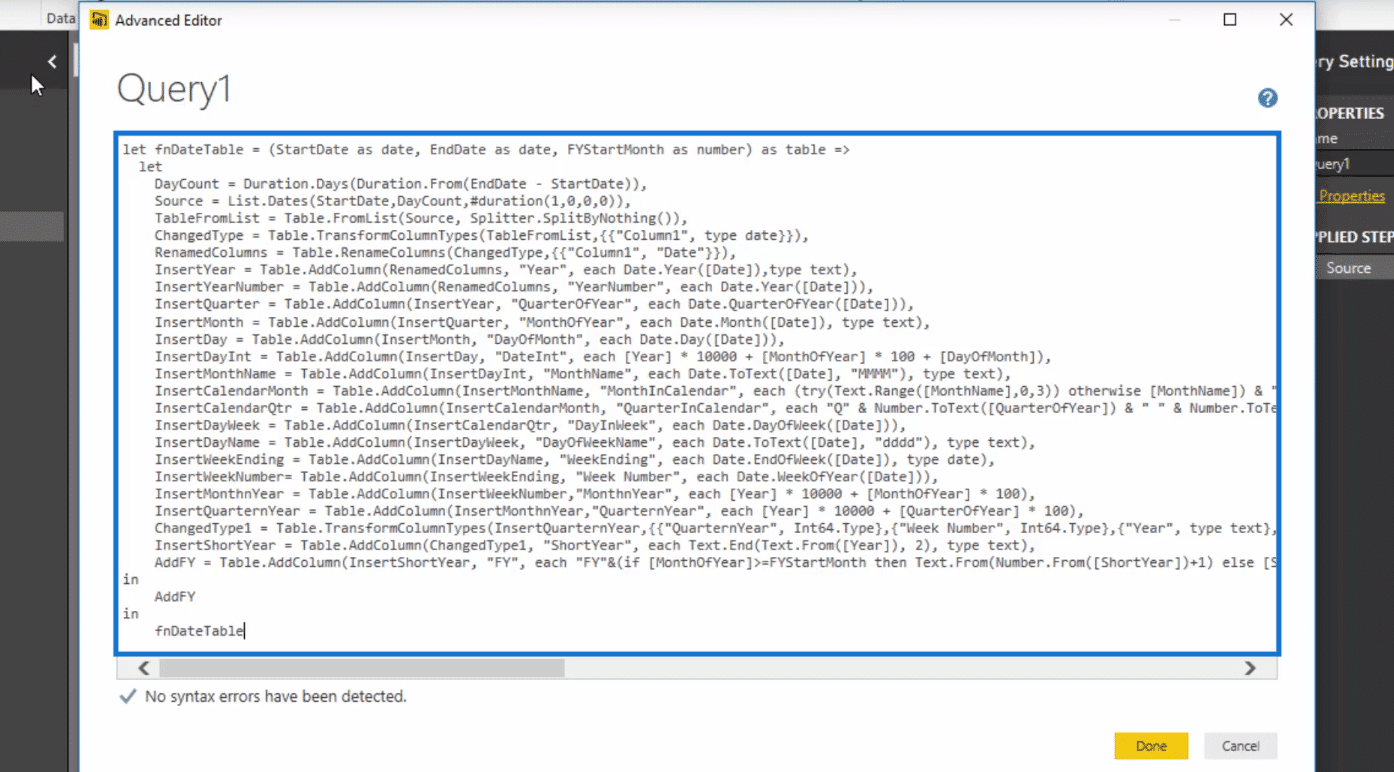
After pasting the date table code, click Done.
3. Input Parameters
You’ll see now that we have some parameters. We can actually input some parameters for this dates table.
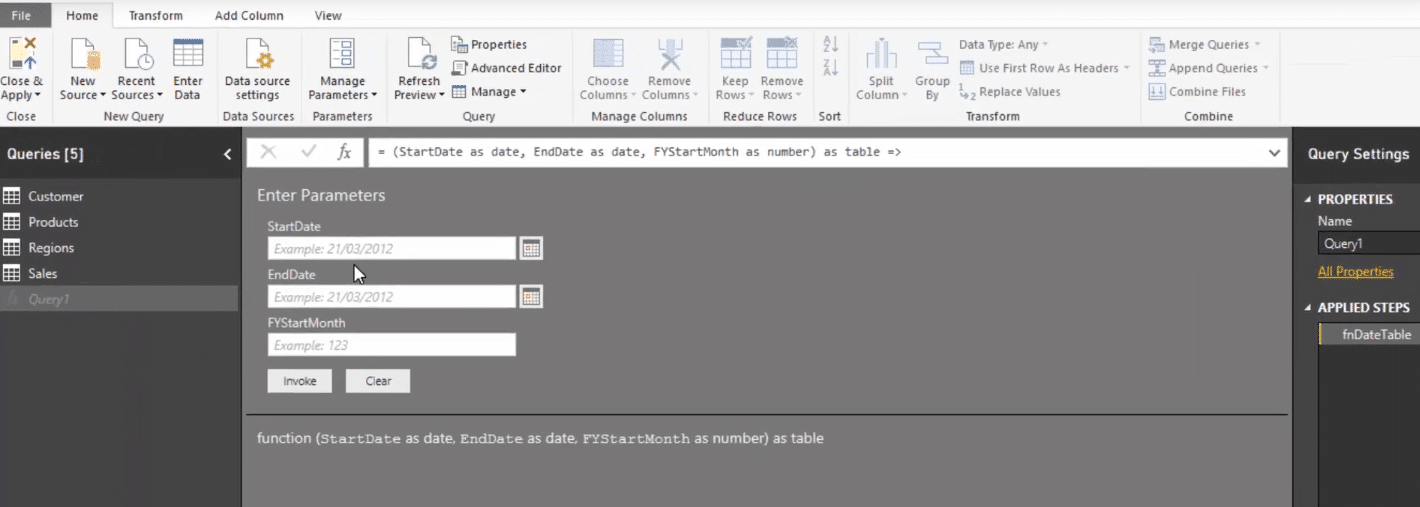
For the StartDate, let’s say 1st of January 2014 and for the EndDate, 31st of December 2016.
We also have an option to set the Financial Year Start Month. You can choose whatever month here but for this particular example, let’s choose July.
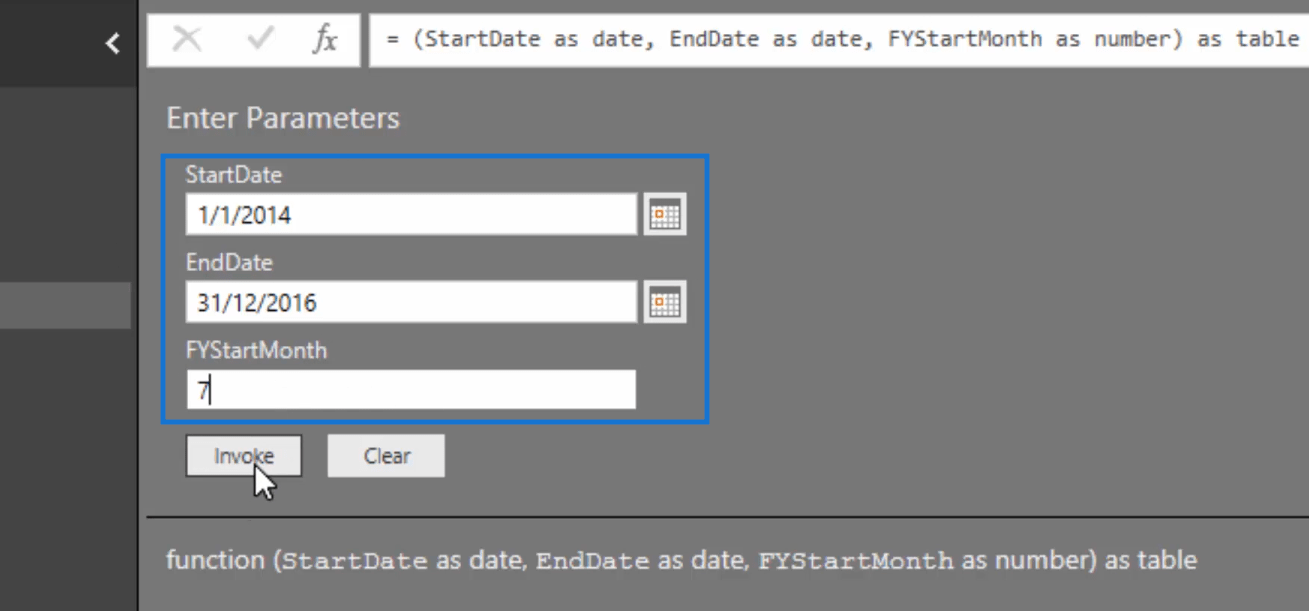
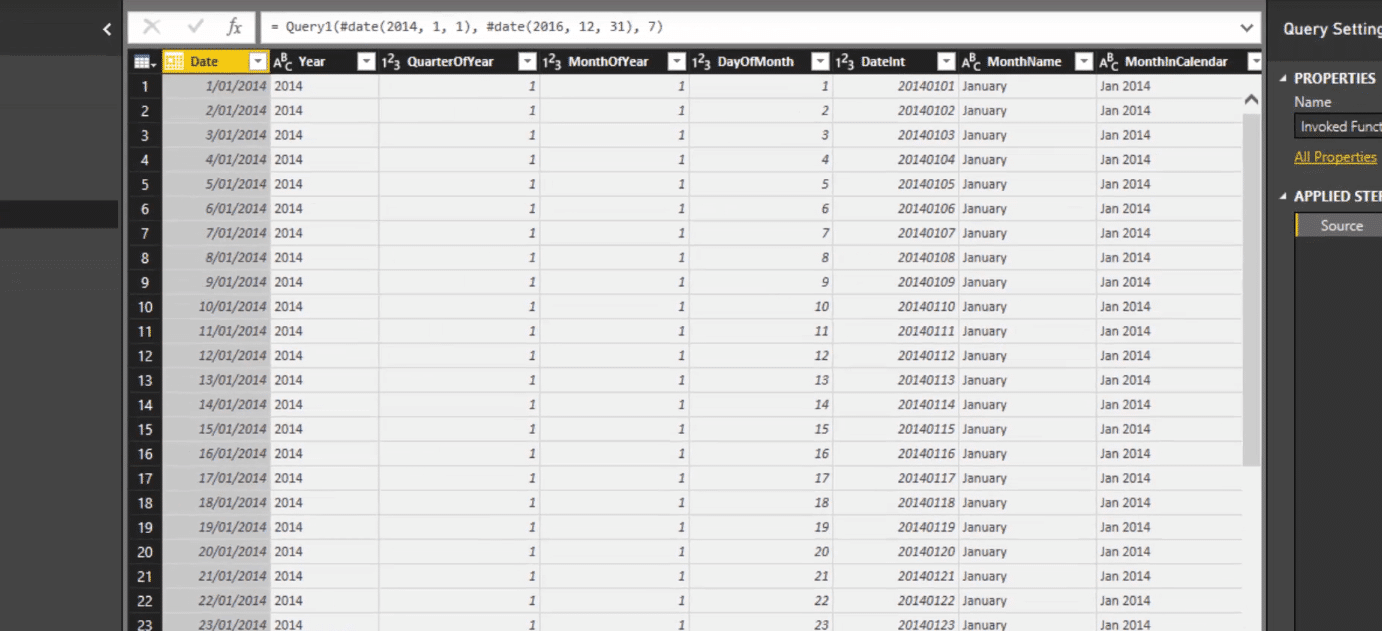
After clicking Invoke, you’ll have this entire table.
4. Reviewing The Table
Let’s do a quick review of what was created for us here.
We have month and year and quarter and year.
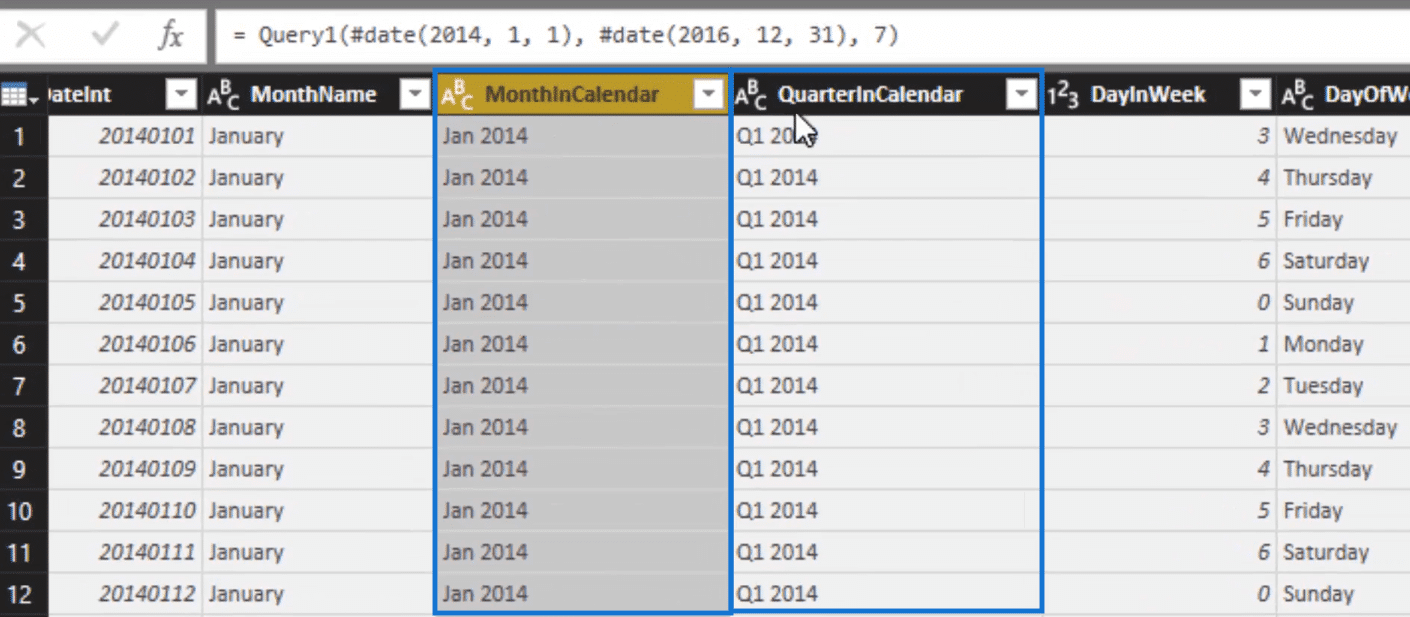
We also have day of the week and week ending.
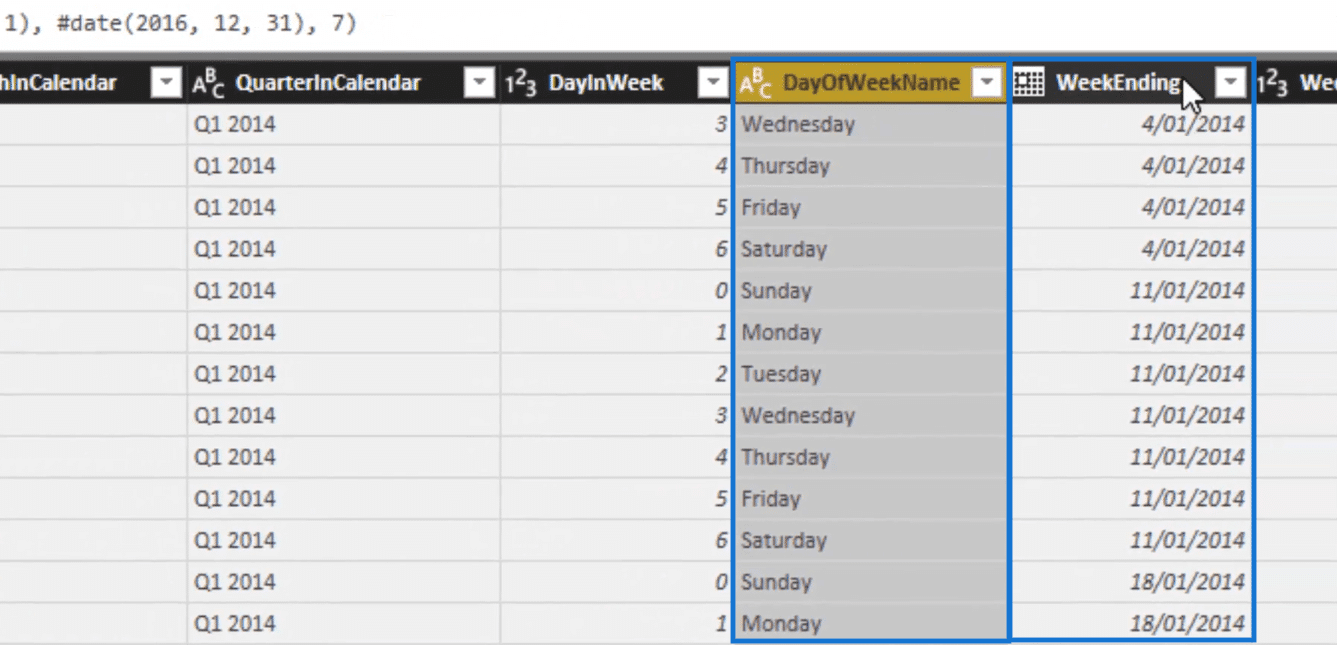
But what is awesome is we also have this index column. Creating this can be quite difficult so having this ready for our use is really helpful.
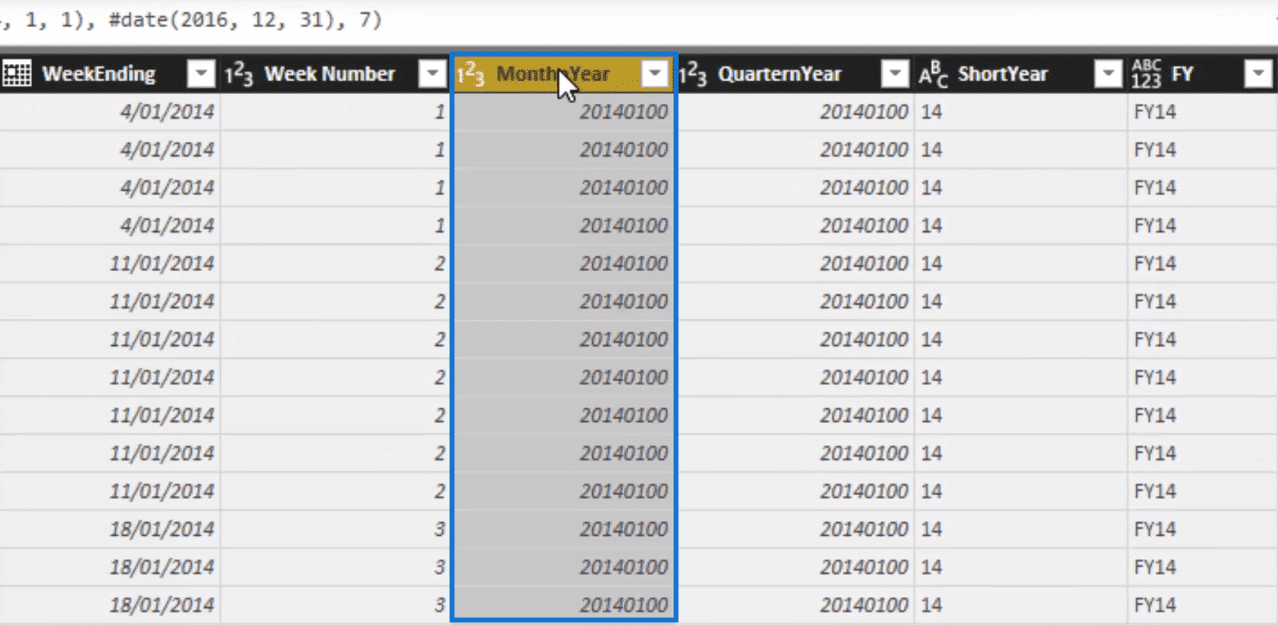
This index column, for example, can sort the month and year column. Since it is a text value, it can only sort itself alphabetically. So the index column can do the sorting for us.
Aside from that, the index column can also sort quarter and year, and of course, day and week.
And you’ll see that we also have financial year in our table so we can slice our tables by financial year.
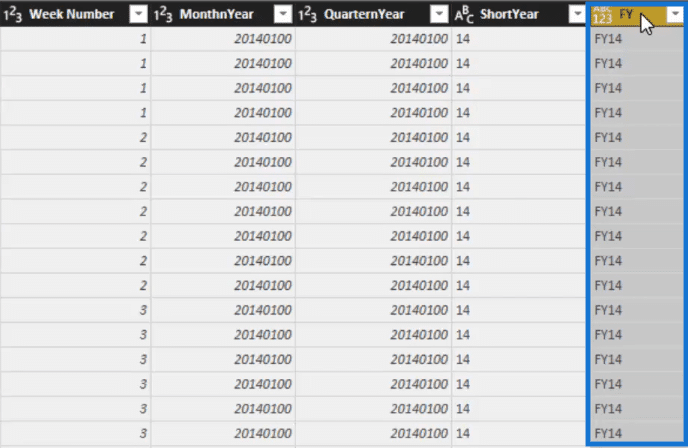
What is amazing is that you don’t have to create all of these individually. They have all been created in one go.
5. Indicate The Name
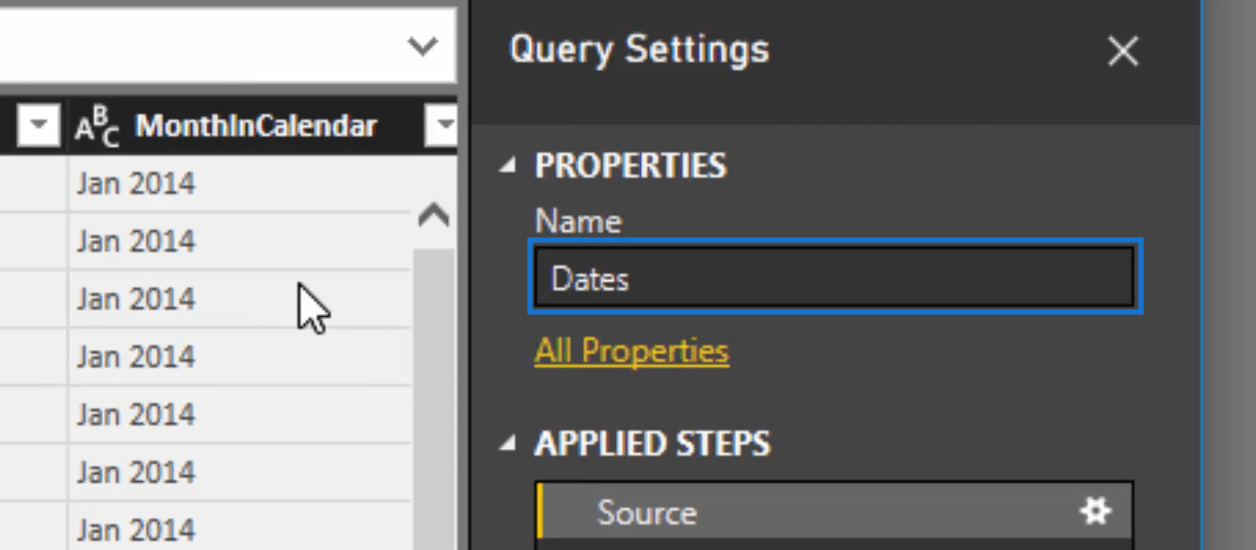
Of course, we need to write the name of this table.
So, on the right side you’ll see a box for the name under properties. There you can write Dates.
6. Close The Query Editor
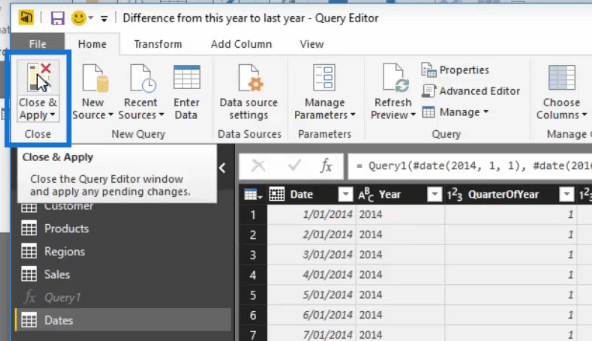
To finally execute all the changes we made, click Close & Apply at the upper left corner of your query editor.
7. Integrate The Date Table Into The Data Model
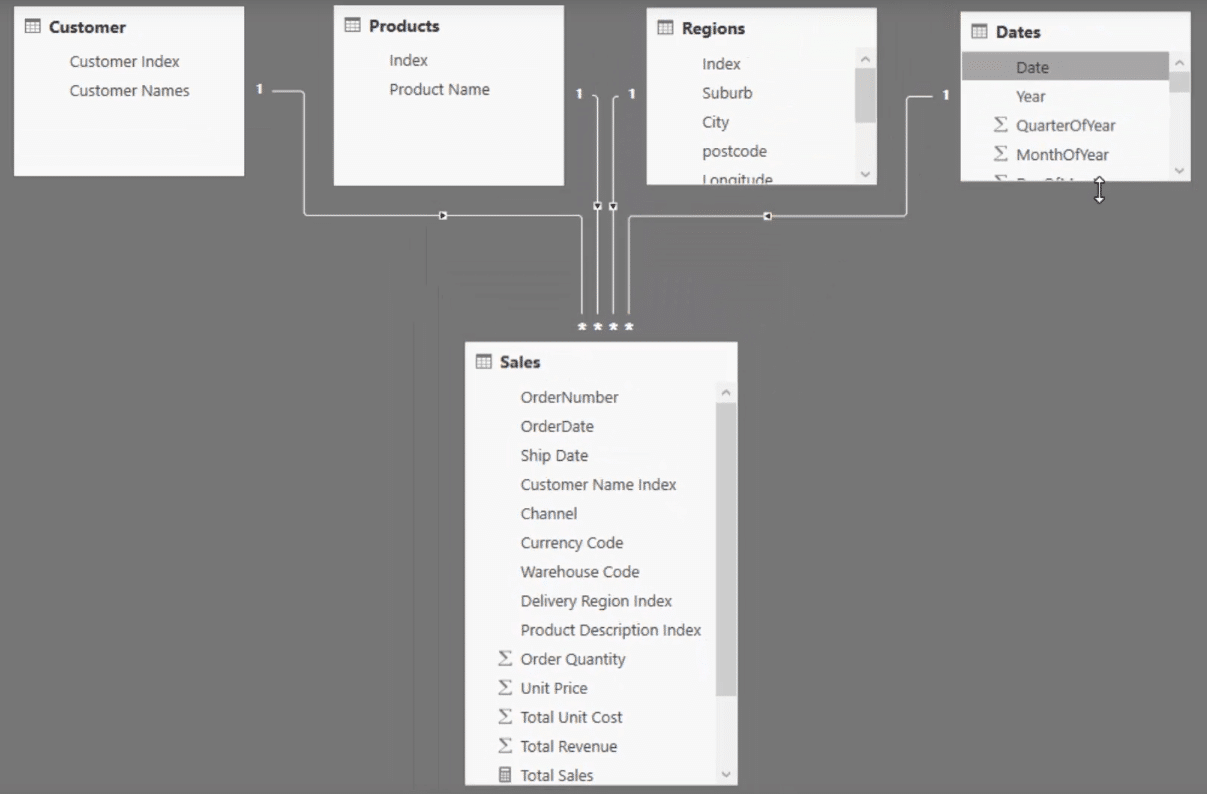
Now we can integrate our date table into our data model. To do that, we just need to connect from date to the order date.
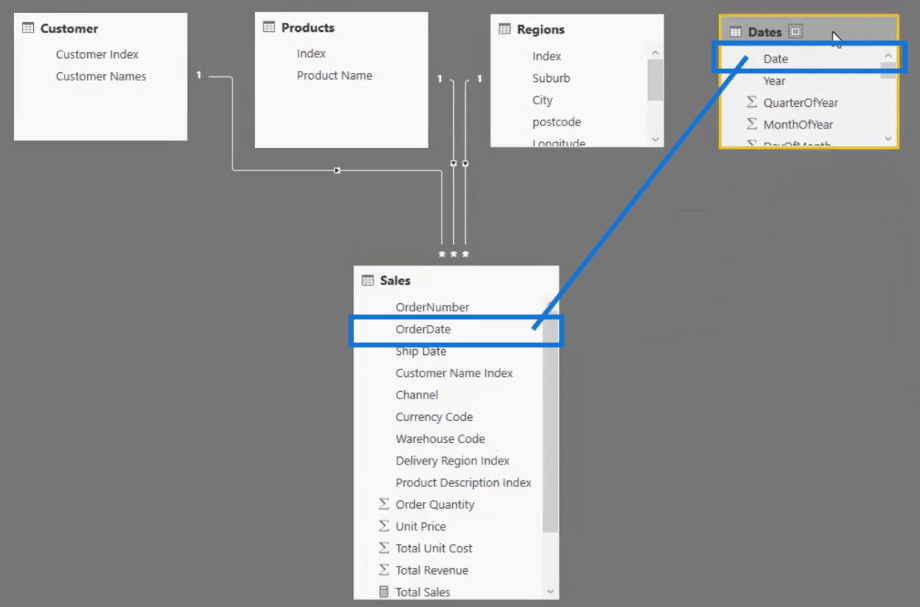
And we now have our complete data model. Quick and easy.
Why Build A Relationship Over To The Fact Table
I rarely, if ever, run any time analysis over date tables in fact tables.
I always create a date table and then build a relationship over to the fact table (like a sales data table).
Why should you do this? Well, there are a few reasons.
But the key is learning here is how to create a really good date table, fast.
You want to make sure that you have all the right code in place to do this over and over again.
***** Related Links*****
How To Create Unique Financial Year Quarters In Power BI
Filter Your Data By Unique Financial Years & Quarters – Power BI Modeling Technique
Month to Date (MTD) To Today’s Actual Date In Power BI Using DAX
Conclusion
So we have just run through a very quick way to create a detailed date table in Power BI.
I personally think this is a really efficient way to do it, because you can make other small changes to the table within the query editor at the same time.
Hopefully you can utilize this in your own work for some compelling time intelligence analysis.
If you haven’t downloaded the code yet, again you can get it within this course.
Ultimate Beginners Guide to Power BI
Cheers,
Sam


