
There are times when you need to calculate the count of values in your Excel list that don’t repeat or are unique.
At other times, you may simply want to know the total number of distinct values in your Excel list. Based on your needs, you have to use different formulas and methods.
If you want to find the number of unique and distinct values in Excel, you can use the below formulas.

- For unique values: =SUM(IF(COUNTIF(range,range)=1,1,0))
- For distinct values: =SUM(1/COUNTIFS(range, range))
In this article, we’ll show you how to use Excel formulas and features to count unique values as well as distinct values.
By mastering these Excel functions, you can improve your data analysis skills and ensure accurate reporting on unique and distinct values within your spreadsheet.
Let’s get started!

What’s the Difference Between Unique and Distinct Values?
There’s a difference between unique and distinct values, so let’s go over the basics first.
1. Unique Values
Unique values refer to items in a dataset that occur only once. In other words, there are no duplicates or repetitions of these values within the dataset.
For example, if you have a list of numbers like [1, 2, 3, 4, 5], each number appears only once, so these are unique values.

2. Distinct Values
Distinct values refer to all different items or elements in a dataset, regardless of whether they occur once or more than once.
For example, if you have a list of numbers like [1, 2, 2, 3, 3, 3, 4, 5], there are duplicates (e.g., 2 and 3 are repeated), but there are still distinct numbers (1, 2, 3, 4, and 5) because they are all different from each other.
In summary, “unique values” specifically refer to items that occur only once, while “distinct values” encompass all different items in a dataset, regardless of their repetition.
OK, now that we’ve gotten that out of the way, let’s take a look at how you can count unique values and distinct values!
How to Count Unique Values in Excel?
In Excel, unique values refer to unique numbers and texts in a dataset, without any repetitions. By learning how to count unique values in Excel, you can gain insights into your data by understanding the frequency of specific elements and identifying patterns.
In this section, we’ll give you three formulas that you can use to count unique values.
1. Count Unique Values Using SUM, IF, and COUNTIF
You can use a combination of SUM, IF, and COUNTIF functions to count the values that exist only once in a list range.
Consider the following example:
=SUM(IF(COUNTIF(range, range)=1,1,0))
OR
=SUM(IF(COUNTIF(A1:A6,A1:A6)=1,1,0))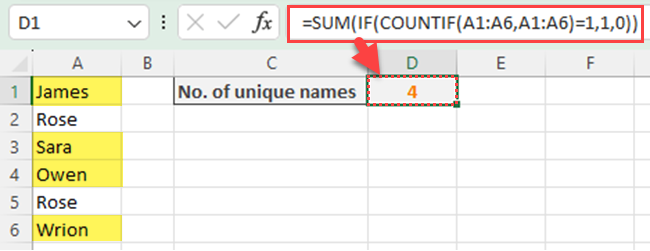
Here, the range denotes the starting and ending cells. This is an array formula, which means you must press CTRL + SHIFT + ENTER after typing the formula.
This formula only counts non-duplicate values.
2. Count Unique Values Using SUMPRODUCT, IF, and COUNTIF
You can use another formula to count unique numeric values or unique text values in Excel. In this formula, instead of using the SUM function, you can use the SUMPRODUCT function.
=SUMPRODUCT(IF(COUNTIF(range, range)=1,1,0))
OR
=SUMPRODUCT(IF(COUNTIF(A1:A6,A1:A6)=1,1,0))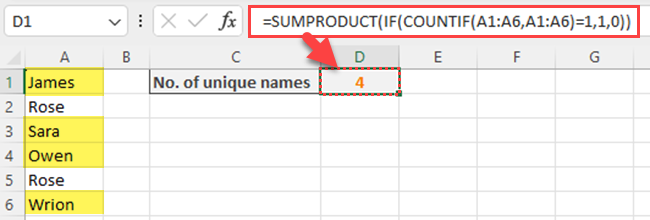
This formula is very similar to the previous formula. Here also, the range denotes the starting and ending cells. This is an array formula, which means you must press CTRL + SHIFT + ENTER after typing the formula.
Using this formula, you can count non-duplicate values.
3. Count Unique Values Based on a Condition
When you want to find the number of unique values of a list based on a condition, you can use the following formula.
=SUMPRODUCT(IF(COUNTIFs(range, range, range, criteria)=1,1,0))For example, if I want to count the unique numeric values which are greater than 5, I can use the below formula.

=SUMPRODUCT(IF(COUNTIFS(A1:A10,A1:A10,A1:A10,">5")=1,1,0))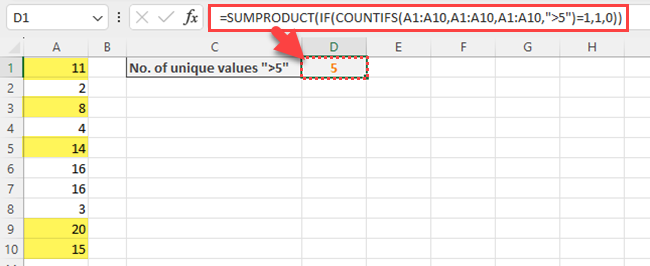
Now that we’ve gone over some ways to count unique values in Excel, let’s discuss how you can do the same with distinct values in the next section.
How to Count Distinct Values in Excel?
Sometimes, you may want to find how many different values in your Excel list. You can use different Excel formulas as well as Excel options such as Pivot Tables to find the distinct values in Excel.
1. Count Distinct Values Using UNIQUE and COUNTA
You can easily combine the UNIQUE and COUNTA functions to count distinct or different values in Excel.
The UNIQUE function extracts the distinct elements from a range, while the COUNTA function returns the count of non-empty cells.
=COUNTA(UNIQUE(range))
For example, if you want to count different colors in the range A2 to A6, you can write a formula like this:
=COUNTA(UNIQUE(A2:A6))
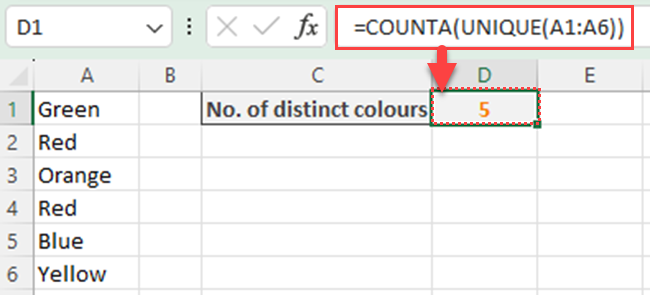
This formula will return the count of distinct values in the given range.
The above formula perfectly works for counting numeric values.
For example, if you want to find the number of distinct values in the range A2 to A5 of the below image, you can use the below formula.
=COUNTA(UNIQUE(A2:A5))
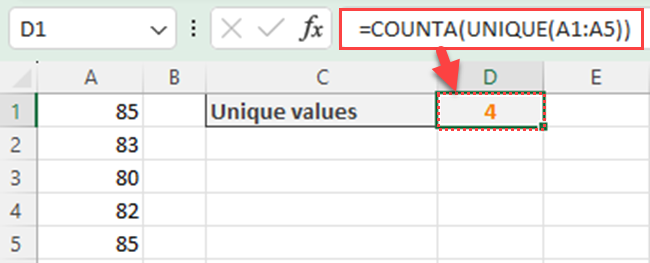
In the above formula, all different or distinct values are counted.
2. Count Distinct Values Using SUMPRODUCT
The SUMPRODUCT function is another useful function for counting distinct values. It returns the sum of the products of corresponding ranges or arrays. With the following formula, you can find how many distinct values in a given column:
=SUMPRODUCT((range<>"")/COUNTIF(range,range))
=SUMPRODUCT((A1:A6<>"")/COUNTIF(A1:A6,A1:A6))
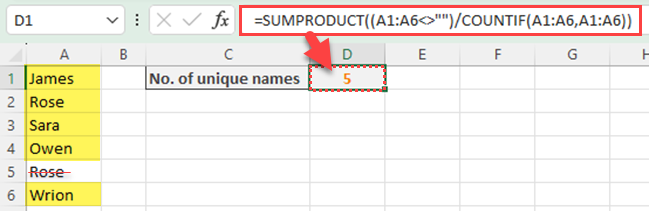
This formula returns the number of distinct values by removing any duplicates.
3. Count Distinct Values Using SUM and COUNTIF functions
You can even combine the Excel SUM function and COUNTIF function to count different values. The COUNTIF function counts values based on a condition.
For instance, to count the number of distinct items from a list of values in the range B5, you can use the below formula.
=SUM(1/COUNTIF(B5:B14, B5:B14))
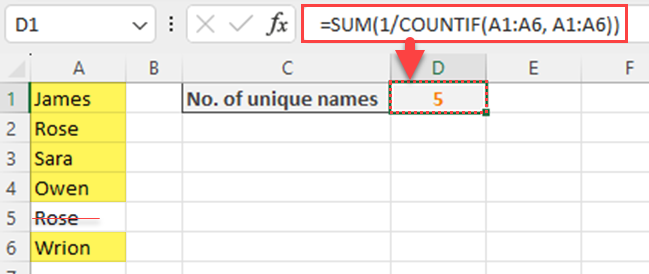
This formula works by dividing 1 by the count of each value’s repetitions and then summing those numbers up to obtain the distinct count.
If you want you can replace the COUNTIF function of the above formula with the COUNTIFS function.
4. Count Distinct Values Using FREQUENCY, MATCH, ROW, and SUMPRODUCT
Additionally, if you only want to find the number of different values within a range, you can use a formula that combines the FREQUENCY, MATCH, ROW, and SUMPRODUCT functions.

- FREQUENCY: A powerful tool for counting distinct values within a range. It calculates how often values occur within a range and returns a vertical array of numbers.
- MATCH: Another useful tool that can be used with other functions for counting distinct values. The MATCH function finds unique occurrences by returning a relative location of an item in a range.
- ROW: A simple yet handy function. It’s used to find out the row number of a particular cell or reference.
SUMPRODUCT(--(FREQUENCY(MATCH(range, range, 0), ROW(range) - ROW(first_cell) + 1) > 0))For instance, if you have data in cells A1 to A6, you would use:
SUMPRODUCT(--(FREQUENCY(MATCH(A1:A6, A1:A6, 0), ROW(A1:A6) - ROW(A1) + 1) > 0))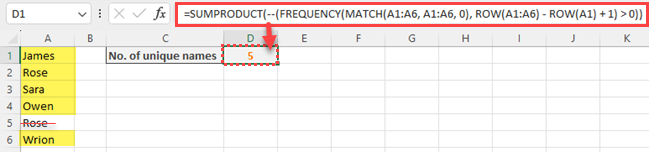
Formulas to Count Distinct Values Based on Criteria
In some cases, you may need to do a distinct count based on certain criteria.
For example, you can use a formula that combines the UNIQUE, COUNT, and FILTER functions. This formula helps you to count different values based on a specific condition:
=COUNT(UNIQUE(FILTER(A1:A10,A1:A10>5)))
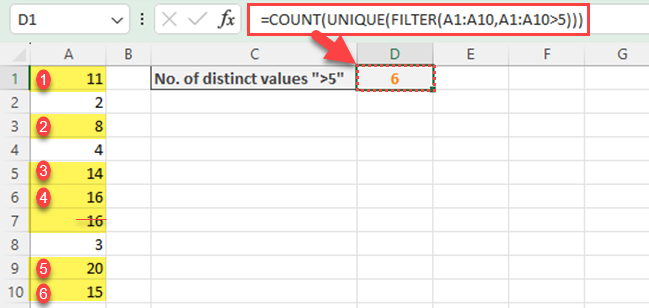
This formula returns the count of distinct numeric values that meet the specified condition.
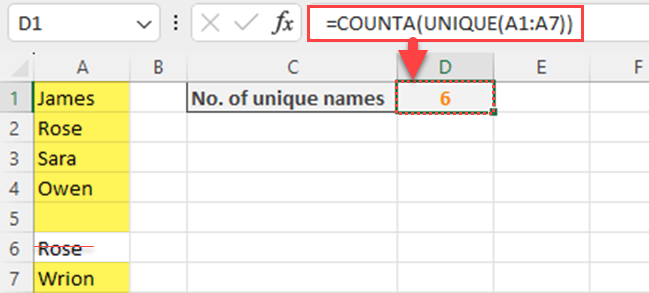
It is important to note that blank cells may sometimes be counted as distinct values, which can lead to incorrect counts.
For example, in the below image, you can see that the blank cell is counted as a distinct value.
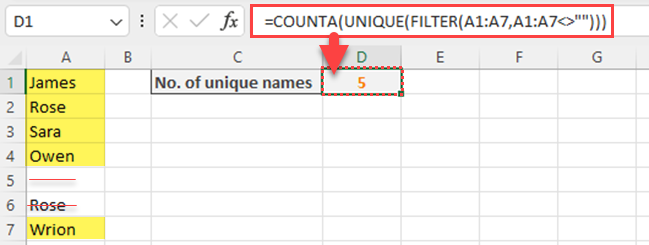
To exclude such blank cells, you can add the FILTER function into your formula, like this: =COUNTA(UNIQUE(FILTER(A2:A7, A2:A7<>””)))
In summary, counting distinct values in Excel is an essential skill for data analysis and summarization.
Using the UNIQUE, COUNTA, FREQUENCY, and FILTER functions, you can easily do the counting of distinct values in different scenarios, including basic counting, numerical data analysis, and conditional counting.
Next, we’ll go over how you can use pivot tables to count distinct values in Excel.
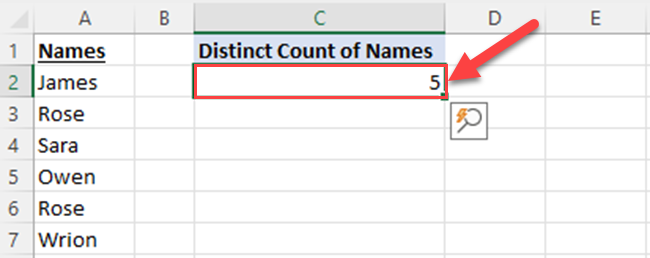
Using Pivot Tables to Count Distinct Values in Excel
Pivot tables are like super tools in Excel. They let you look at data in different ways and get the main points fast. And if you want to count distinct or different values in your data set, the use of a pivot table is a great way to do it.
For that, you have to follow the below steps.
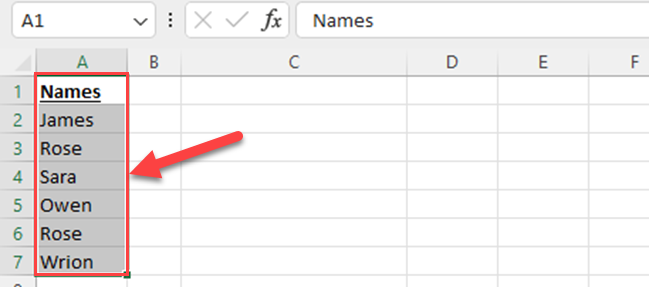
Step 1: To start, select all the values in your data range including the heading. In the below case, you can select the range A1 to A7.
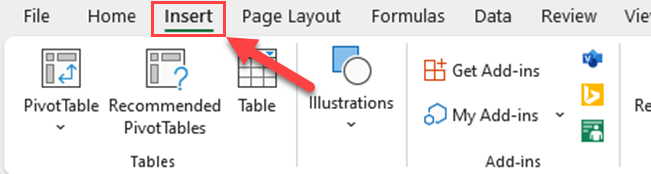
Step 2: Go to the “Insert” tab in your Excel Ribbon.
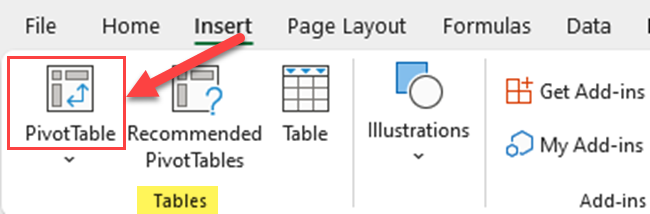
Step 3: Click on the Pivot Table icon on the “Tables” group.
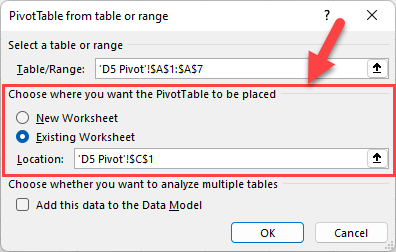
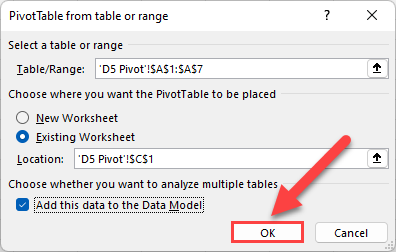
Step 4: Choose where you want to show the distinct count as the place where you want the PivotTable to be placed. In this case, I have given the cell reference cell C1 of the same sheet.
Step 5: Check the box “Add this data to the Data Model”.
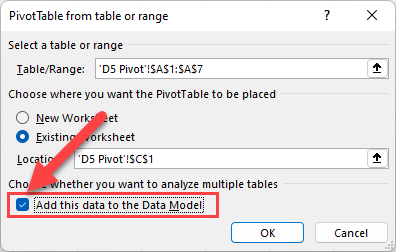
Step 6: Click the OK button of the “Pivot Table from table or range” dialog box.
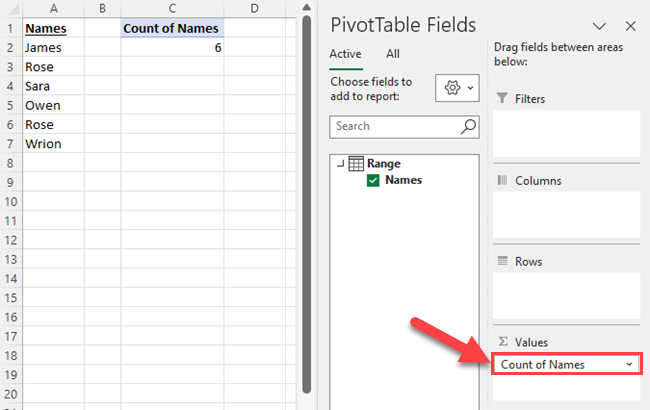
Step 7: Drag the field where you want to count the distinct values to the “Values” area. In this case, I have dragged the “Name” field to the “Values” area.
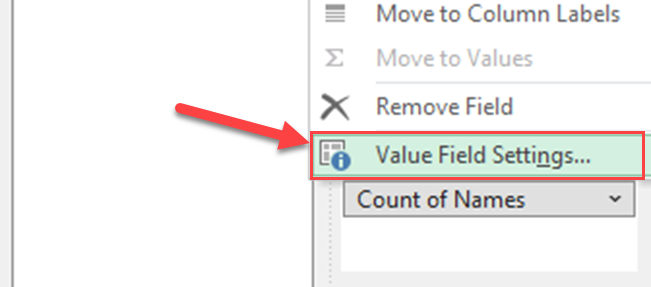
Step 8: Click on the field in the Values area and select “Value field settings” from the expanded list.
Step 9: Select “Distinct Count” as the Summarize value field by of the Value field settings dialog box.
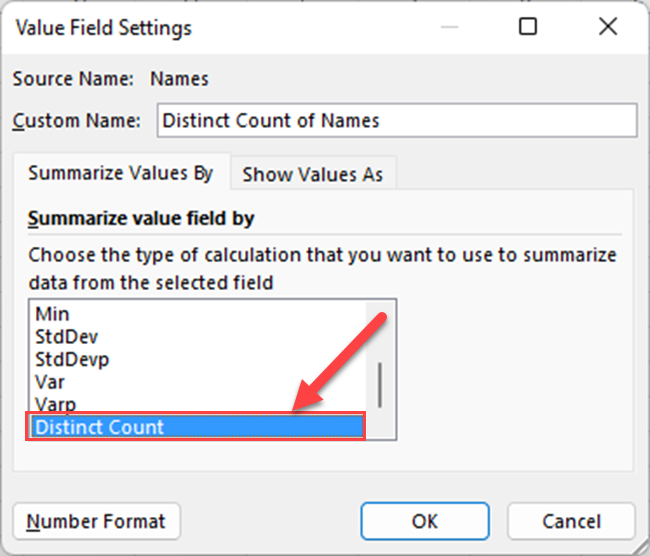
Now you can see the distinct values count of the selected range.
Final Thoughts
Now you’ve got a clear understanding of the contrast between unique and distinct values, and you know how to count them in Excel quite easily. It’s crucial to choose the right formula depending on your specific requirements.
If your task involves dealing with unique and distinct values alongside applying certain conditions, consider combining them with advanced Excel functions.
Additionally, when you need to count distinct values in Microsoft Excel, remember that Pivot Tables can be a valuable tool for this purpose.
If you’d like to learn different approaches on how you can count distinct values in Microsoft Excel, from a more traditional way to a more modern technique, check out the video below:
Frequently Asked Questions
How do I count unique values with multiple criteria?
To count unique records with multiple criteria, you can use a combination of SUMPRODUCT, IF, and COUNTIFS functions. The formula is SUMPRODUCT(IF(COUNTIFs(range, range, range, criteria)=1,1,0)).
You can also combine SUM, IF, and COUNTIFS functions. Then, the formula is SUM(IF(COUNTIFs(range, range, range, criteria)=1,1,0)).
What is the formula for counting unique values in Excel?
In Excel, you can use the formula SUMPRODUCT(IF(COUNTIF(range, range)=1,1,0)) or SUM(IF(COUNTIF(range, range)=1,1,0)) to count unique values in a specified range.
Can Excel count distinct values?
Yes, Excel can count distinct values. You can use the UNIQUE function along with COUNTA to achieve this. The formula =COUNTA(UNIQUE(range)) will count distinct values in the specified range.
How to count unique text values in Excel?
To count unique text values in Excel, you can also use the formula SUMPRODUCT(IF(COUNTIF(range, range)=1,1,0)) as well as SUM(IF(COUNTIF(range, range)=1,1,0)). This formula works for different data types, including text, numbers, dates, and times.
How to count specific names in a column?
To count specific names in a column, you can use the COUNTIF function. The formula =COUNTIF(range, “name”) will count the occurrences of the specified name in the given range.
What is the difference between COUNTIF and COUNTIFS functions?
The COUNTIF function is used to count cells that meet a single criterion, while the COUNTIFS function is used to count cells that meet multiple criteria. COUNTIFS allows you to set multiple conditions, which is useful when you want to count cells based on several conditions at once.


