
Do you want to calculate the skewness of your data to understand its distribution? Well, you’re in the right place. You can easily calculate skewness in Excel to analyze the symmetry of your dataset.
To calculate skewness in Excel:
Use the =SKEW.P function for the entire population.
Use the =SKEW function for a sample of the population.
Enter your dataset as an argument for either function.

In this article, we’ll go over the Excel functions you can use to find skewness in your data. We’ll also discuss the purpose of skewness, how to interpret the results, and its implications for your data analysis.

Let’s get started!
What is Skewness?
Skewness is a measure of the asymmetry of the probability distribution of a real-valued random variable about its mean.
Yes, we know it’s a mouthful!
In simpler terms, it tells us whether the data is more concentrated on one side of the mean compared to the other (more negative values or more positive values).
There are three types of skewness:
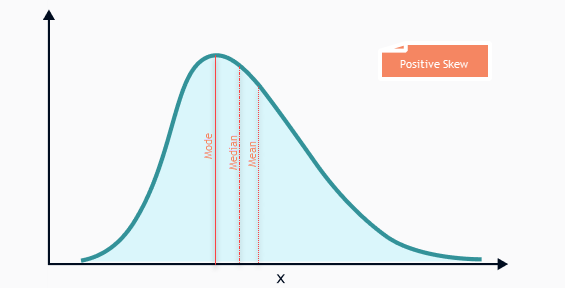
1. Positive Skewness: The data is skewed to the right, which means the tail on the right side of the distribution is longer or fatter than the left side.

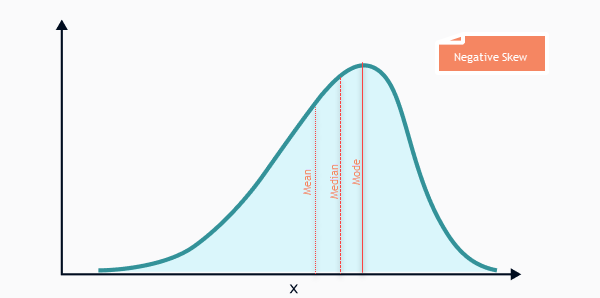
2. Negative Skewness: The data is skewed to the left, which means the tail on the left side of the distribution is longer or fatter than the right side.
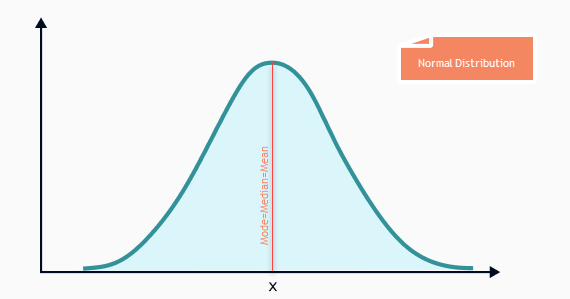
3. Zero Skewness: The data is symmetric, which means the distribution is balanced on both sides of the mean.
Skewness can be calculated using an Excel function – the SKEW function.
In the following section, we’ll go over the steps to find skewness using the SKEW function.
How to Calculate Skewness in Excel
To calculate the skewness of a sample in Excel, you can use the SKEW function, which has the following syntax:
SKEW(number1, [number2], …)
Where number1 is the first argument, and so on, up to a maximum of 255 arguments representing the sample data. It returns the skewness of a sample of the population, which is an estimation of the population skewness.
If the skewness is between -0.5 and 0.5, the data are fairly symmetrical. If the skewness is less than -1 or greater than 1, the data are highly skewed.
A skewness value of 0 indicates a symmetrical distribution. Positive skewness values indicate a right-skewed distribution. If the value is negative, the data distribution is negatively skewed or skewed to the left.
Let’s go over a few examples to better understand how to calculate skewness in Excel.
Example 1: Calculating Skewness of Sample Data
Suppose you have a sample dataset in columns A and B of an Excel spreadsheet. To find the skewness of this sample data, you can use the SKEW function like this:
=SKEW(B2:B9)
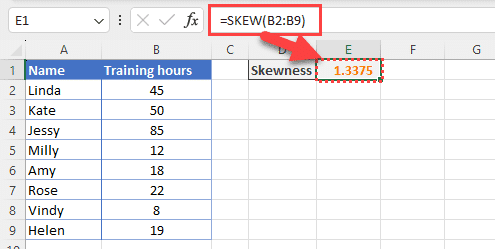
This formula will return the skewness of the sample data in cell E1. In this case, the result is 1.3375, which indicates that the data is highly positively skewed.
Example 2: Calculating Skewness of a Population
If you want to calculate the skewness of an entire population, you can use the SKEW.P function, which has the same syntax as the SKEW function. However, the result will be an estimation of the population skewness.
Let’s look at an example.

Suppose you have a population dataset in columns A and B of an Excel file. To find the skewness of this population data, you can use the SKEW.P function like this:
=SKEW.P(B2:B9)
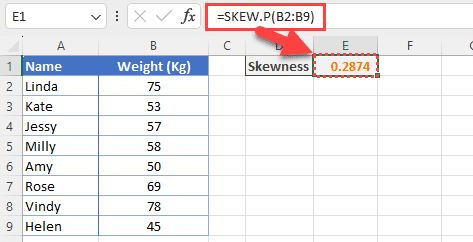
This formula will return the skewness of the population data in cell E1. In this case, the result is 0.2874, which indicates that the data is slightly positively skewed.
In the next section, we’ll go over the SKEW function and how to use it to calculate skewness in Excel.
Important Points When Calculating Skewness
When calculating skewness, there are a few important points to keep in mind to ensure accurate results.
In this section, we’ll go over these key points to help you understand how to properly calculate skewness in Excel.
1. Skewness Formulas
There are two formulas for skewness that you can use in Excel:
The Fisher-Pearson coefficient of skewness (SKEW.P) is used to estimate the population skewness. This formula divides the numerator by the population standard deviation raised to the power of 3.
The moment coefficient of skewness (SKEW) is used to calculate the sample skewness. This formula divides the numerator by the sample standard deviation raised to the power of 3.
When calculating skewness in Excel, it’s important to choose the appropriate formula based on whether you are working with a sample or the entire population.
2. Sample Size

Skewness is influenced by the size of your sample. For small sample sizes, the skewness value may not be a reliable indicator of the true skewness of the population.
In general, the larger the sample size, the more reliable the skewness estimate.
3. Outliers
Skewness is sensitive to outliers. Extreme values in the dataset can significantly impact the skewness value.
It’s important to examine the dataset for potential outliers and consider their influence on the skewness measure.
In the next section, we’ll go over a few additional tools that can be used to find skewness in Excel.
Additional Tools to Calculate Skewness in Excel
In addition to the SKEW function, there are other tools and functions in Excel that you can use to calculate skewness.
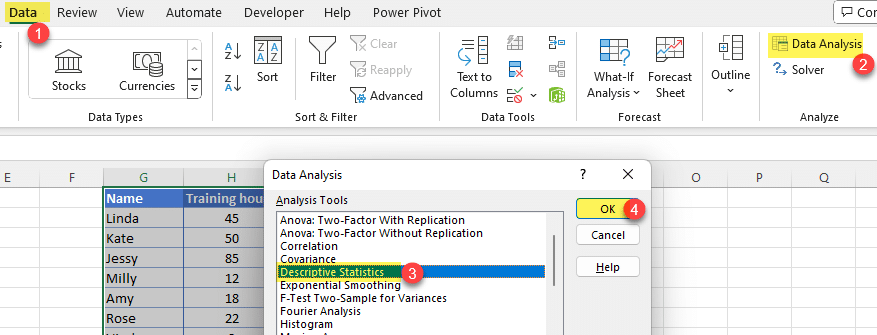
For example, you can use the Descriptive Statistics feature of the Excel data analysis toolpack.
Final Thoughts
Finding skewness in Excel is a straightforward process that allows you to gain valuable insights into the distribution of your data.
By using the SKEW function, you can quickly determine the level of asymmetry in your dataset.
Remember that a skewness value close to zero indicates a symmetrical distribution, while positive and negative values indicate right and left-skewed distributions, respectively.
When interpreting your results, consider the impact of outliers and the sample size on the skewness value.
If you’d like to learn how to use ChatGPT for data analytics, check out our Excel video below:

Frequently Asked Questions
How do I calculate skewness for multiple columns in Excel?
To calculate skewness for multiple columns in Excel, use the SKEW function. Select data cells, input =SKEW(A1:A100, B1:B100, C1:C100) in a new cell, adjusting ranges.
What does a skewness value of 1 mean in Excel?
A skewness value of 1 in Excel indicates a moderately skewed distribution. Positive values like 1 suggest that the tail of the distribution is longer on the right side, while negatives would indicate a longer left tail.
In both cases, the majority of the data points are concentrated on the opposite side of the tail.
How to find the skewness of a sample in Excel?
To find the skewness of a sample in Excel, use the SKEW function. This function calculates the skewness based on a sample of the data.
What is the SKEW function in Excel used for?
The SKEW function in Excel is used to calculate the skewness of a distribution. Skewness measures the asymmetry of a distribution.
A value of 0 indicates a symmetrical distribution, while positive and negative values indicate right and left-skewed distributions, respectively.


