Working out your profit margins in Power BI with a basic data set can seem like it requires a few steps. You may watch the full video of this tutorial at the bottom of this blog.
Maybe you think you need to use calculated columns to get the result.
Well, you certainly don’t need to do that. There is a much simpler way.
Using measures, you can start with simple information like price and costs, and then via ‘measure branching’, you can work your way up to a profit margin figure that can be filtered by anything in your data model.
This is what we’re going to focus on in this article. After reading this post, you will surely be amazed by how useful this simple process can be in your reports.
Calculating Percent Profit Margins In Power BI
Before we actually start working out our profit margins, let us have a quick look at our underlying sales table so that we know what we are working on.
As you can see, we have the order quantity, the unit price, total unit cost and total revenue.
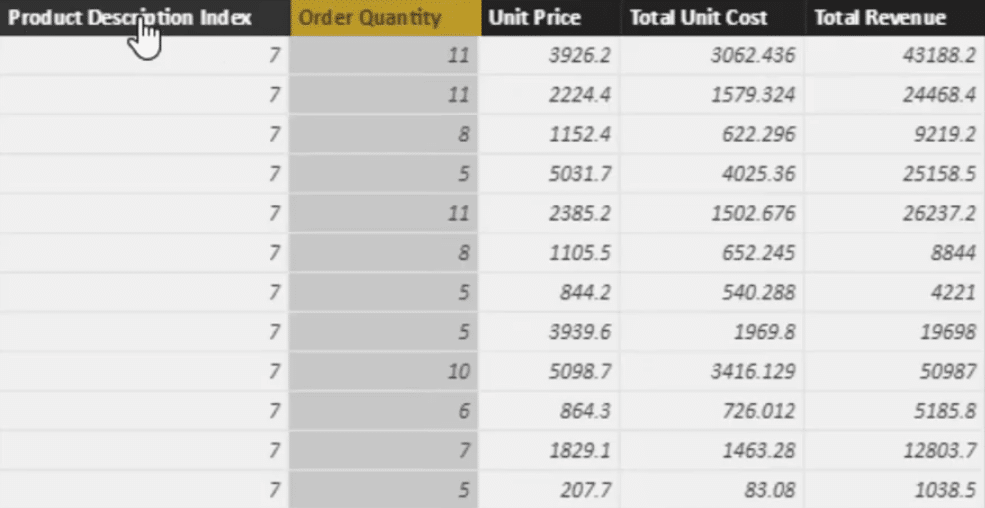
With these, we can create our simple measures that will eventually enable us to calculate our percent profit margins.
So let’s dive into the process.
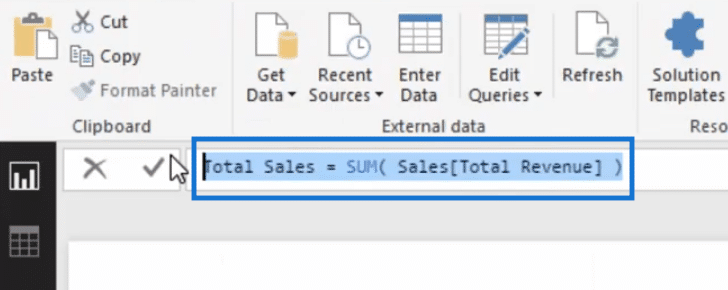
1. Total Sales Measure
The first thing we need to do, obviously, is to create a simple measure. In this particular example, let’s work out the total sales which is a sum of the total revenue column.
2. Calculating Total Costs Using Iterating Function
Since we need to know what our total profits are, the next thing we need to find out is the total costs. We can do this by using an iterating function.
We don’t have a total cost column in this case so we’re going to use SUMX to compute total cost.
Using SUMX, we’ll go to the sales table and multiply the unit cost by the sales quantity for every single row in that table.

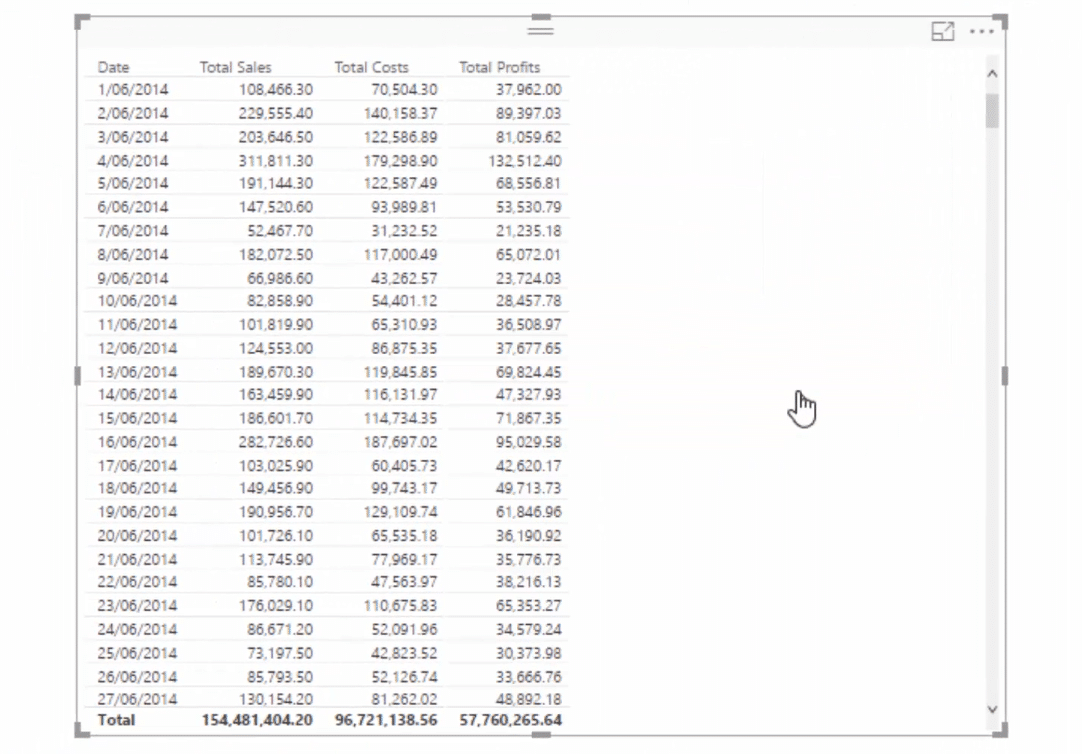
Let us first double check our total costs formula before moving on to the next step.
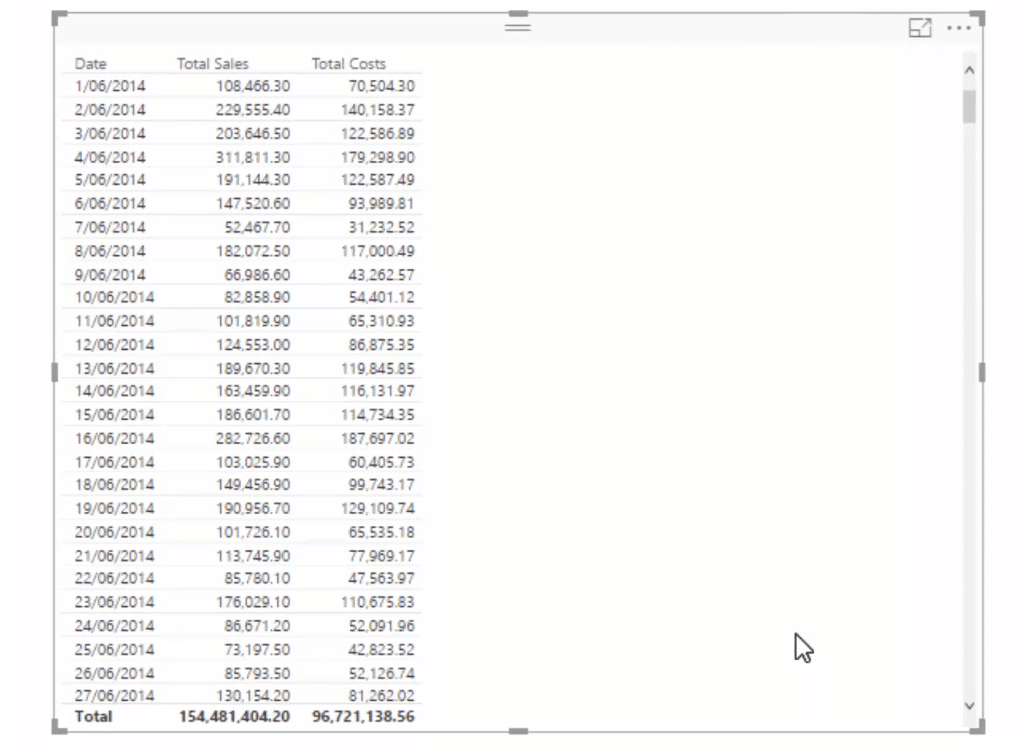
So let’s create a table using our measures.
We’ll bring in our date, total sales for every single day, and total cost for every single day.
This is the table that we’ll be able to create.
3. Total Profits Measure
Now that we have our total sales and total costs measures, we can now calculate our total profits. To get this, of course, we simply subtract total costs from the total sales.
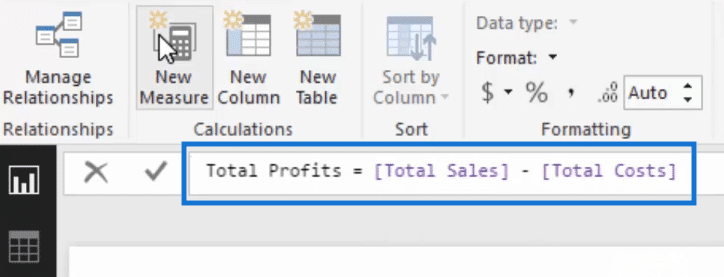
We’ll just drag total profits measure into our table and then we get a total profits column.
4. Calculating Margins
We can very easily calculate our margins after those first three simple steps. And of course, there is definitely no need to go back to our data table and add any columns.
What we need to do, again, is to simply create a new measure.
Let us call this % profit margins.
For the formula, we’re going to use DIVIDE, total profits by total sales, and then put in zero as the alternative result.

Let us then drag this measure into our table to see our profit margins per day.
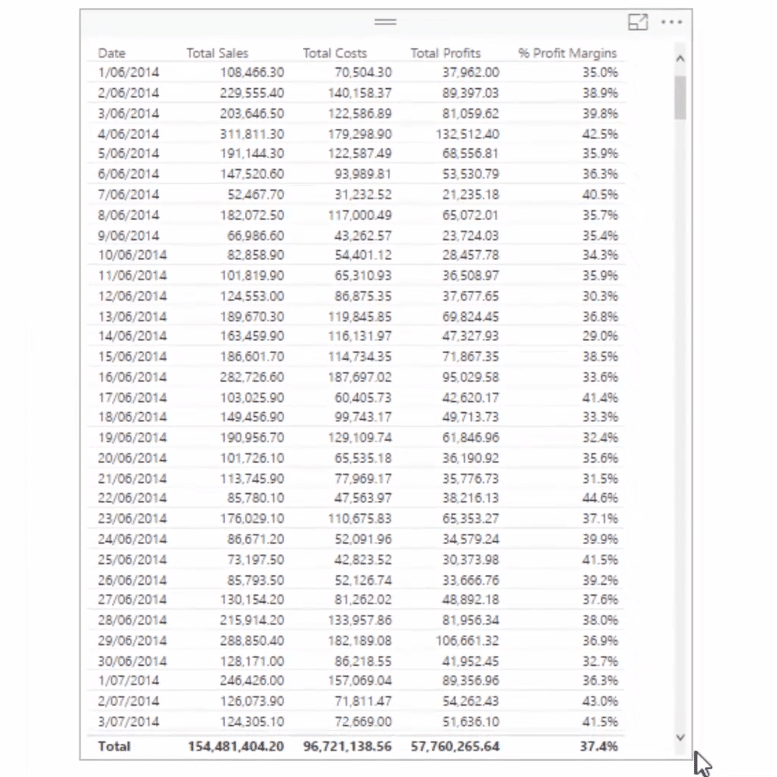
So we’re able to work out our percent profit margins using measures.
This is a very simple and quick process but the output undoubtedly has many uses.
Uses Of Percent Profit Margins Calculation
Let us now look at the different ways that we can use percent profit margins in Power BI reports.
1. Profit Margin Per Customer
First, we can look at the profit margin per customer.
We’re going to drag in profit margin then add the customer names.
We now have a table that shows the profit margin per customer.
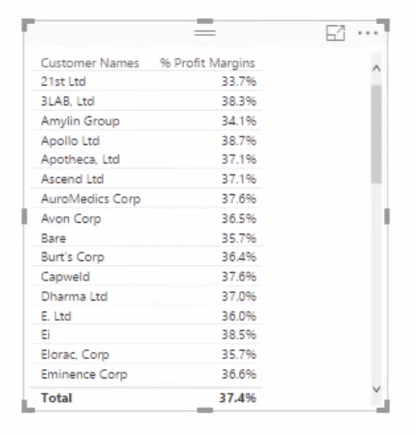
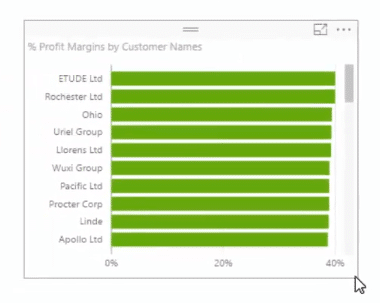
If you need a visualization, of course that’s also possible and you can convert the table into a visual very easily.
2. Profit Margins Over Time
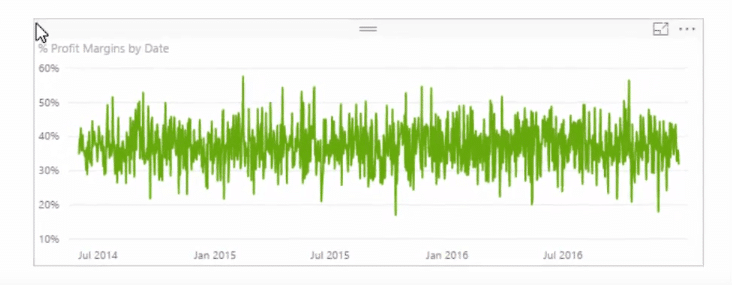
We can also look at our profit margins over a time period.
What we can do is just copy and paste the table with the percent profit margin per day.

Then we can convert this table into a line graph.

Now we have a visual that shows the percent profit margins over time.
3. Comparing Margins Per Product
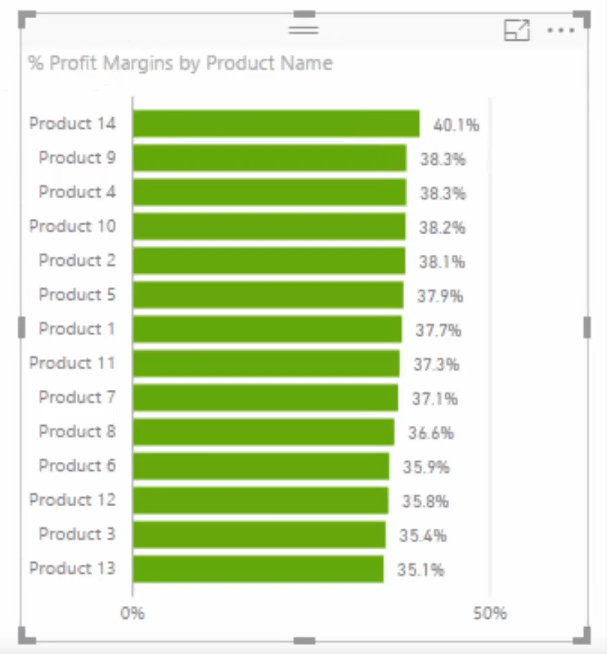
Using our percent profit measure, we can also see what is our highest and lowest margin products.
Let’s copy and paste our visualization with profit margin and customer names.

Then we’re going to add product name and then turn on data labels.
Now we can compare profit margins by product with Product 14 as the highest and Product 13 as the lowest.
4. Looking At Margins Dynamically
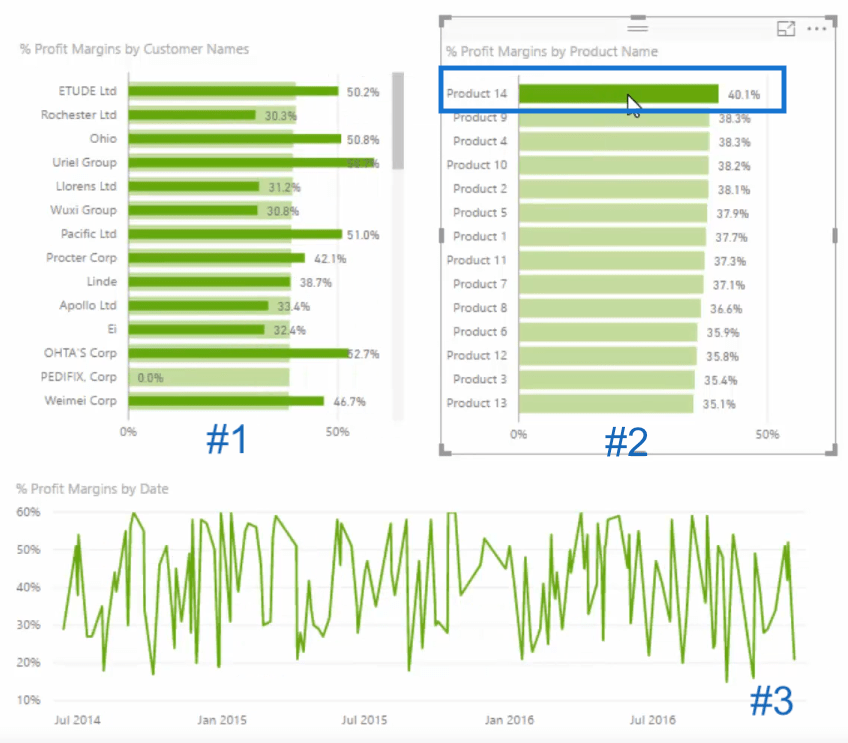
With all the visualizations that we have created, we can look at our margins dynamically.
If we click into our Product 14, for example, we can see how things have tracked over time dynamically for this specific product as shown in the visual number 3.
We can also see how much of the profit margin per customer is product 14 in the first visualization.
Then the visualizations will show the different margins as we click on the different products.
***** Related Links*****
Develop Advanced Scenario Analysis Models Using DAX in Power BI
Are Margins Expanding Or Contracting? Solve in Power BI
Analyze Margin Changes Overtime – Analytics with Power BI and DAX
Conclusion
In this post, we have seen how to work out our profit margins in Power BI using measures.
The key takeaway here is not actually how to exactly work out profit margins, but about how we get there.
The layering of measures on top of each other allows you to create these branches. They can produce quite complex results, but your formulas remain relatively simple as you step through to the end number.
There are so many ways you can use this – not only with the profit margin number, but also with aspects like percentage growth, time comparison results, and much more.
Starting with your simple core measures is certainly the best way to develop your models. It makes bringing in more advanced techniques like time intelligence and scenarios analysis that much easier.
Thanks for reading this article. If you’re interested in learning some more about profit margins, you can check out this post.
Calculating How Much Profit We May Be Losing Out On – Power BI Analytics
Cheers,
Sam


