
Knowing how to calculate percentage change is one of the core essential Excel skills you need to know. The best part? It’s a quick and easy process.
To calculate percent change in Excel, you can use the following formula.Percentage Change = ((New Value – Old Value) / Old Value) * 100
For example, if the old value is in cell A1 and the new value is in cell B1, the percentage formula is:

= ((B1 – A1) / ABS(A1)) * 100
But wait, there’s more, a lot more.
In this article, we’ll show you not only how to calculate percentage change but, importantly, how to enhance the display of the change to make your spreadsheet look incredible too.

Let’s get started!
What is Percentage Change?
Just to clarify for those of you new to this, Percentage difference/ change is a simple way to express a change in value as a percentage of the original value. It’s useful for comparing the magnitude of changes over time or across different variables.
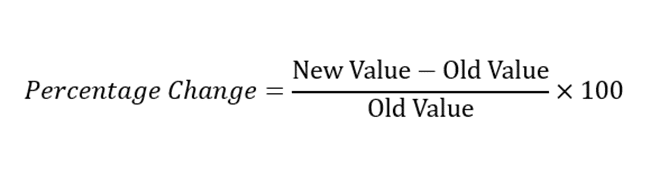
The percentage difference formula is:

Percentage Change = ((New Value – Old Value) / Old Value) * 100
To calculate the percentage change between two values, subtract the old value from the new value, divide by the old value, and multiply by 100.
For example, if a product’s price increased from $20 to $25, the percentage change would be:
Percentage Change = (($25 – $20) / $20) * 100 = 25%
In Excel, there are multiple ways to calculate percentage change.
You can use one of the below formula.
= (new value – old value) / old value
=(new value/initial value)-1
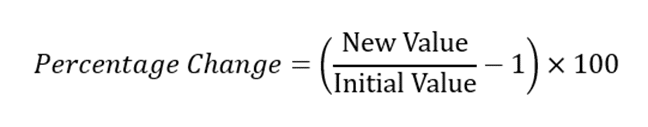
Both formulas give you the same result. You can also use Excel’s built-in percentage format to display the percentage change.
How to Calculate Percentage Change in Excel
Calculating the percentage difference in Excel is a straightforward process, let’s look at it step-by-step.
1. Calculate Percentage Change Using Formulas
To calculate the percentage change in Excel using formulas, follow these steps:
Step 1: Subtract the Old Value from the New Value
First, subtract the old value from the new value.
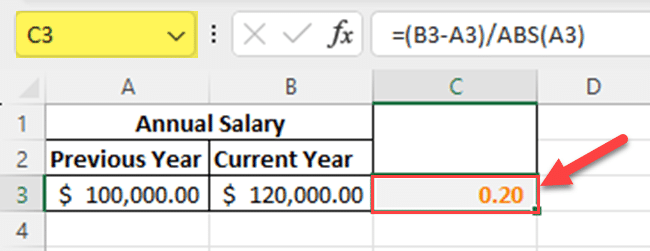
For example, if the old value is in cell A3 and the new value is in cell B3, you can use the formula:
= B3 – A3
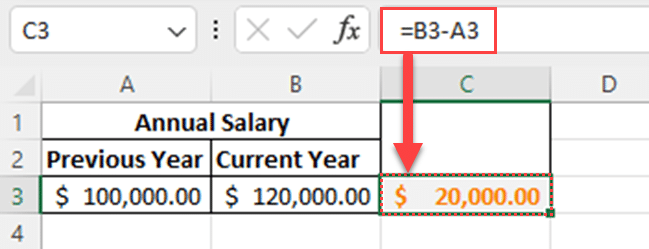
This will give you the difference between the two values.
Step 2: Divide the Result by the Absolute Value of the Old Value
Next, divide the result by the absolute value of the old value.
The ABS function can be used to ensure that the division is performed correctly, regardless of whether the change is an increase or decrease.

The formula would look like this:
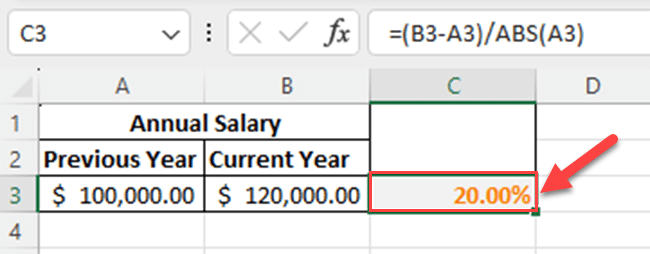
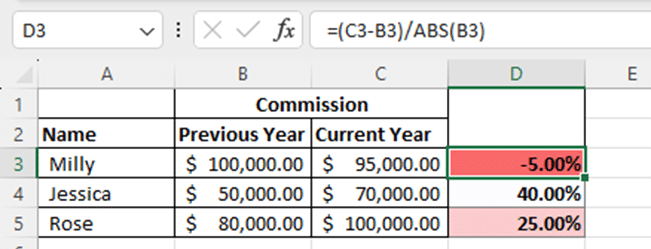
= (B3 – A3) / ABS(A3)
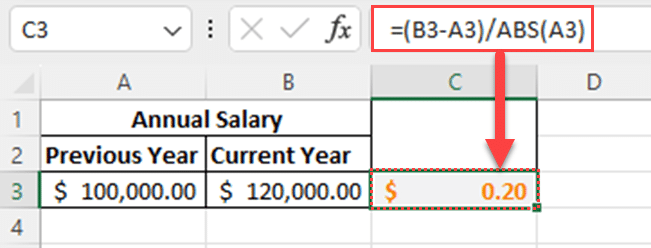
This step normalizes the difference, expressing it as a proportion of the original value.
If you get a negative value, it indicates that there is a percentage decrease.
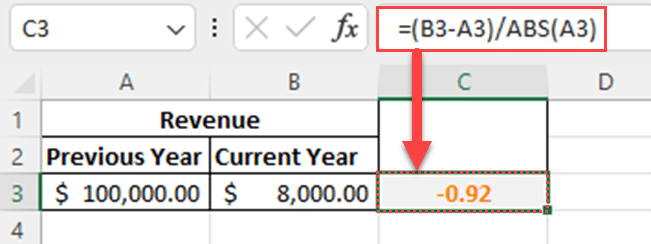
The final result is not showing as a percentage value and it is showing as a decimal number.
Let’s see how to show the final value as a percentage value in the next section.
How to Display Percentage Change in Excel
After calculating the percentage change in Excel, it’s important to present the information clearly in your spreadsheet.
In this section, we’ll go over two common ways to display the percentage change in Excel:
Percentage formatting
Conditional formatting.
1. Displaying Percentage Change Using Percentage Formatting
Excel provides a straightforward way to display percentage difference using the Percentage number format.
This format will automatically convert decimal values into percentages and round the result to the desired number of decimal places.
To apply the Percentage number format, follow these steps:
Step 1
Select the cell with the resulting value.
Step 2
Right-click on the selected cell to open the context menu.
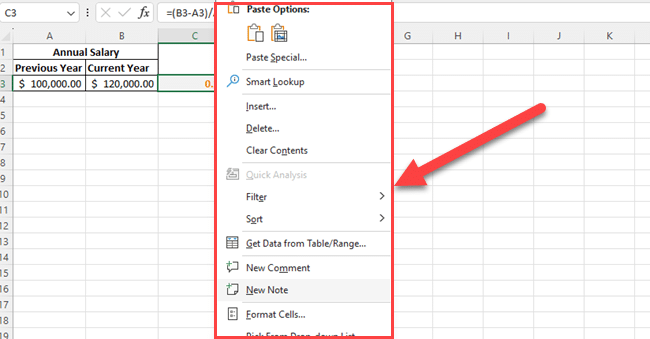
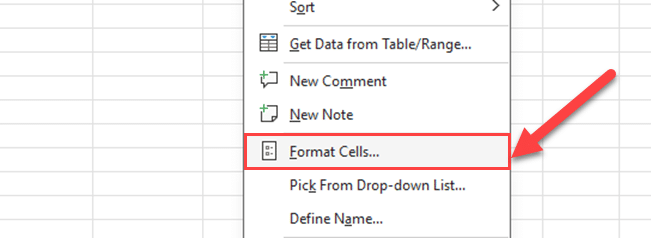
Step 3
Click on Format Cells. Alternatively, you can use the keyboard shortcut Ctrl + 1 to open the Format Cells dialog box.
Step 4
In the Number tab, select Percentage from the Category list.
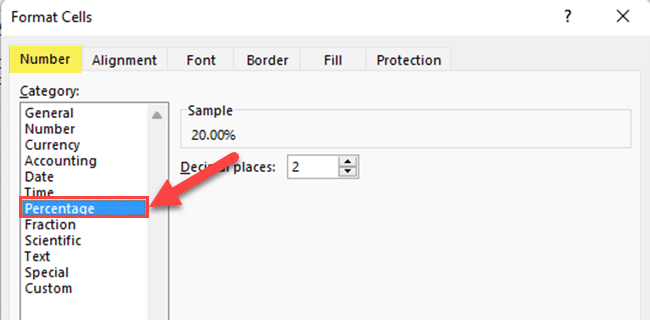
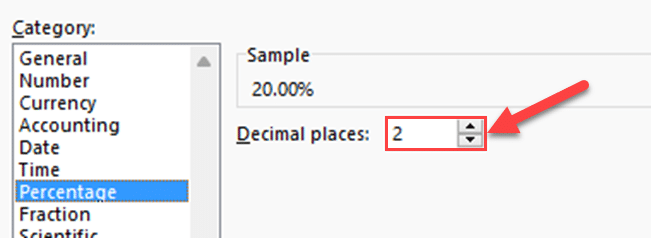
Step 5

Specify the desired number of decimal places.
Step 6
Click OK to apply the format.
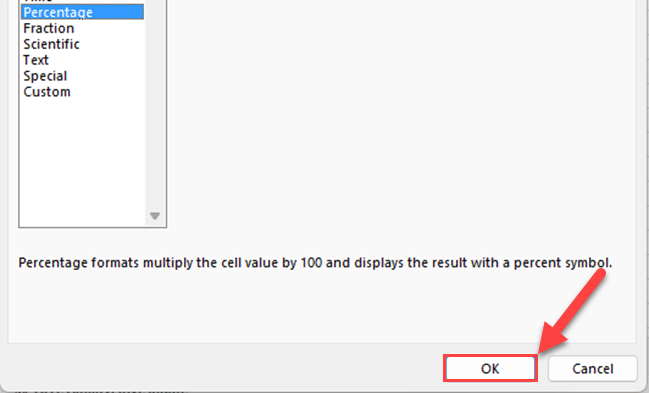
The selected cell will now display the percentage change as a percentage value with the specified number of decimal places.
2. Displaying Percentage Change Using Conditional Formatting
Conditional formatting in Excel allows you to highlight cells based on specific criteria, making it an effective way to visually display percentage changes in your data.
In this section, we’ll go over how to use conditional formatting to highlight cells with different percentage change ranges.
Taking your skills up a notch by using the functions you will learn here will make your percentage changes visually great to look at and easy to interpret.
How to Apply Color Scales to Highlight Percentage Change
One of the most common methods for highlighting percentage change is by using color scales.
This technique assigns different colors to cells based on their percentage change values, making it easy to identify trends and variations at a glance.
To apply a color scale to highlight percent change, follow these steps:
Select the range of cells that you want to apply the color scale to.
Go to the Home tab on the Excel ribbon.
Click on the Conditional Formatting menu in the Styles group.
Choose Color Scales from the drop-down menu.
Select a color scale option from the list.
The selected cells will now display the color scale based on their percent change values.
2. Apply Icon Sets to Highlight Percentage Change
Another useful method for highlighting percent change is by using icon sets.
This technique assigns different icons to cells based on their percent change values, allowing you to quickly identify positive, negative, or neutral changes.
To apply an icon set to highlight percent increase or decrease, follow these steps:
Select the range of cells that you want to apply the icon set to.
Go to the Home tab on the Excel ribbon.
Click on the Conditional Formatting menu in the Styles group.
Choose Icon Sets from the drop-down menu.
Select an icon set option from the list.
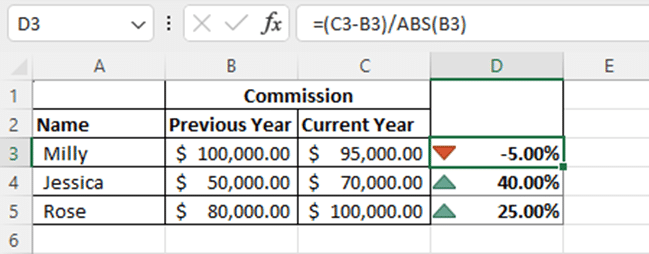
The selected cells will now display the icon set based on their percentage values.
Advanced Percentage Change Calculations in Excel
In this section, we’ll explore more advanced methods to calculate percent change in Excel.
Specifically, we’ll delve into the use of IF statements and conditional calculations.
1. Using IF Statements for Percentage Change Calculations
IF statements are a powerful tool for handling various scenarios when calculating relative differences.
You can use IF statements to check whether the old value is zero and, if so, avoid division by zero errors.
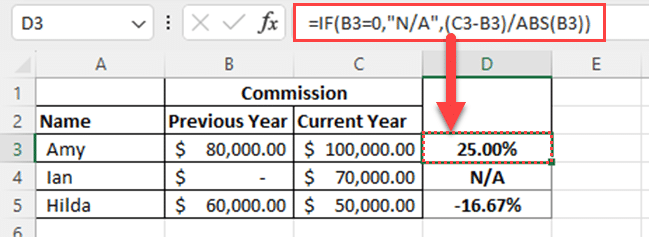
Consider the following formula to calculate percent change with an IF statement:
= IF(Old Value = 0, “N/A”, (New Value – Old Value) / Old Value)
In this formula, if the old value is zero, the result will be “N/A.”
Otherwise, it will calculate the percent change as usual.
2. Using Conditional Calculations for Percentage Change
Conditional calculations can be useful for customizing how percent change is calculated based on specific conditions.
For example, you can use a conditional calculation to switch between percentage increase and percentage decrease based on the sign of the result.
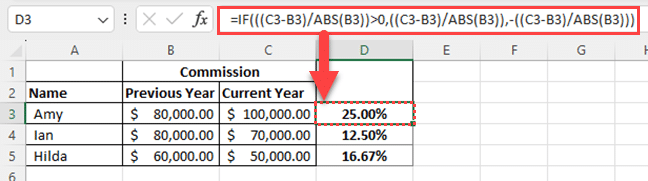
The following formula uses a conditional calculation to calculate percentage change:
= IF(Result > 0, Result, -Result)
In this formula, if the result is greater than 0, it will return the result.
Otherwise, it will return the result multiplied by -1, effectively changing the sign.
In the below simple example, Excel returns percentage decreases (negative values) also as positive values.
Final Thoughts
Calculating percent change in Excel is an essential skill for anyone working with data. It enables you to analyze trends, compare values, and make informed decisions.
In this guide, we’ve explored the various methods for calculating percentage change in Excel, including using formulas, and custom calculations.
We’ve also discussed how to display percent change effectively using formatting options and conditional formatting.
By mastering these techniques, you’ll be better equipped to work with your data and uncover valuable insights.
If you’d like to learn more about how to build and develop analytical solutions that will solve real-world business problems, check out the video below:
Frequently Asked Questions
In this section, you’ll find some frequently asked questions you may have when calculating percentage change in Excel.
How to Calculate a Percentage Increase in Excel?
To calculate a percentage increase in Excel, use the formula:
= (New Value – Old Value) / Old Value
This formula subtracts the old value from the new value, divides the result by the old value, and then multiplies by 100 to express the increase as a percentage.
How to Calculate a Percentage Decrease in Excel?
To calculate a percentage decrease in Excel, use the formula:
= (Old Value – New Value) / Old Value
This formula subtracts the new value from the old value, divides the result by the old value, and then multiplies by 100 to express the decrease as a percentage.
How to Calculate a Compound Annual Growth Rate (CAGR) in Excel?
To calculate a compound annual growth rate (CAGR) in Excel, use the formula:
= ((End Value / Start Value) ^ (1 / Number of Years)) – 1
This formula divides the end value by the start value, raises the result to the power of 1 divided by the number of years, and then subtracts 1 to express the growth rate as a percentage.


