In this tutorial, you’ll learn how to extract a query result from measures and tables in DAX Studio, and transform them into a text or Excel file.

In this example, this basic measure will be used:

When you run this measure, you’ll see that the results show a table comprised of two columns. The first column shows the Color, while the second column shows the Sales Amount.
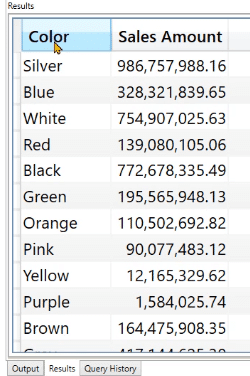
Currently, you can either take the result of the code and convert it into a measure or a calculated table. However, you can also extract the result.
Methods To Extract Query Results In DAX Studio
Timer Option
First, write an EVALUATE function in the query. Then, click the Output option under the Home tab and select Timer.
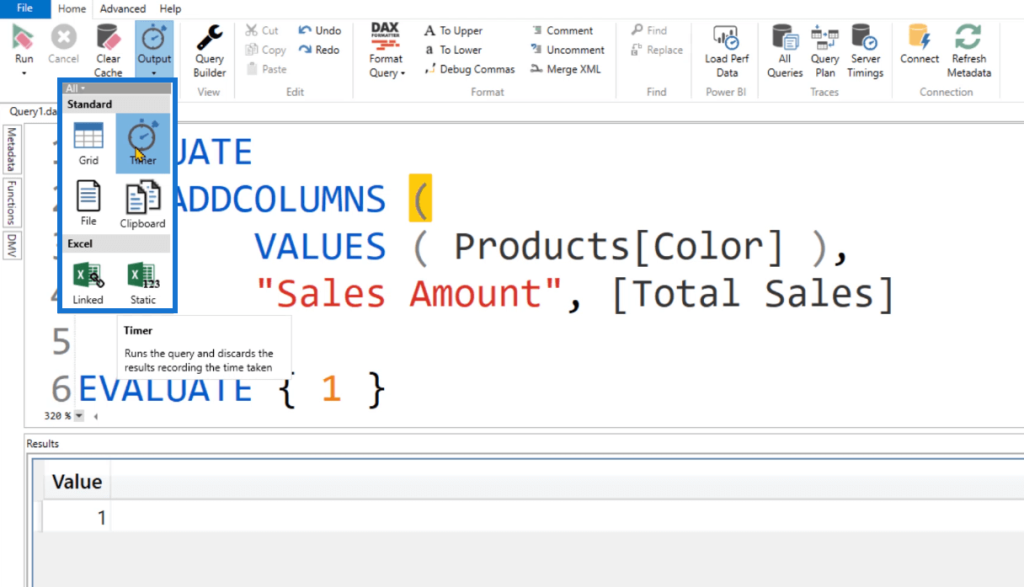
The Timer function is especially helpful when you’re executing a piece of DAX code that’s expected to return a million rows or more.
In the Output pane, you can see that the duration is 18 milliseconds.
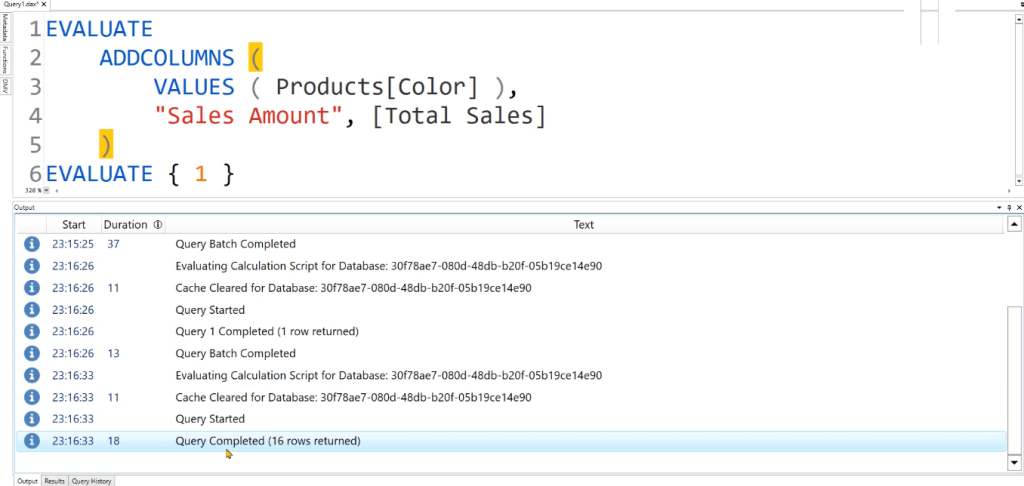
File Option
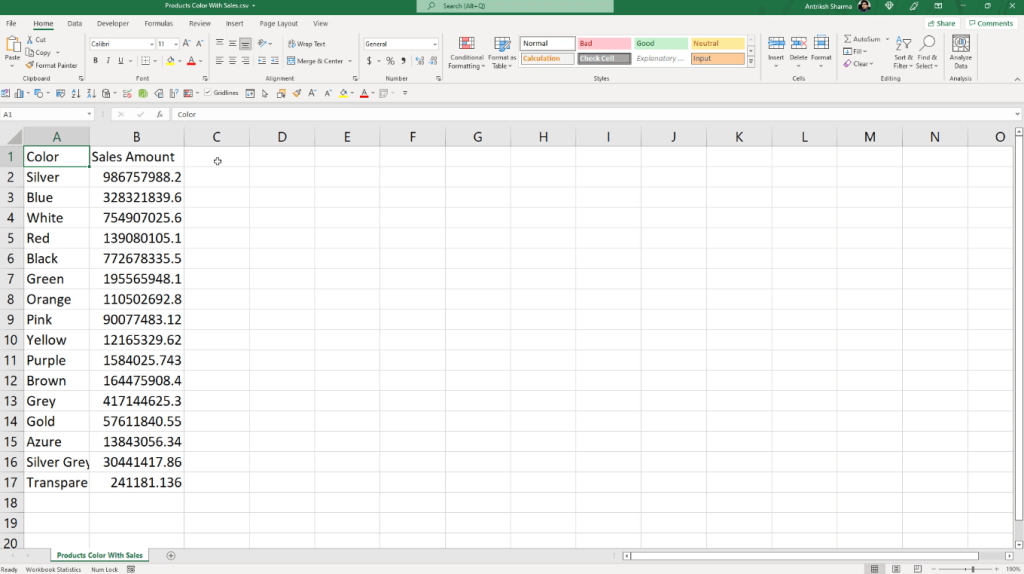
Under the Output button, there’s also the File option. When you click it and run the code, a dialog box will appear asking you to save the file in a .csv format.
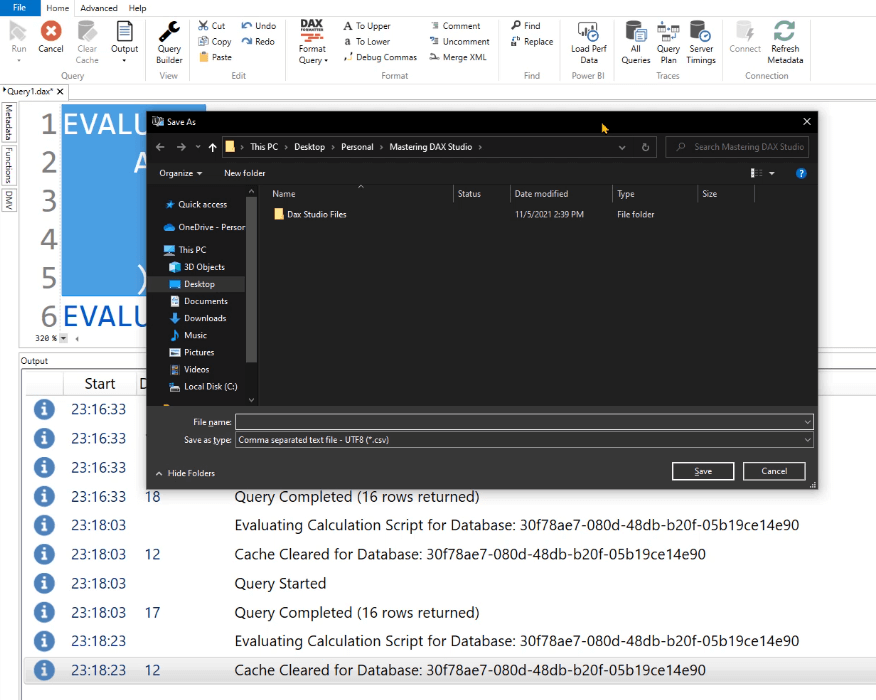
When you open the saved file, the Excel program launches by default. You can see that you’re able to export the result of the query into a text file in Excel.
Clipboard Option
The Clipboard option allows you to copy the results of a query in a temporary space in the memory. This allows you to use and paste the data in another location.
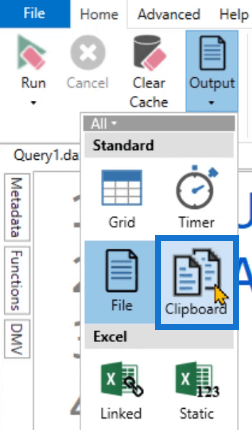
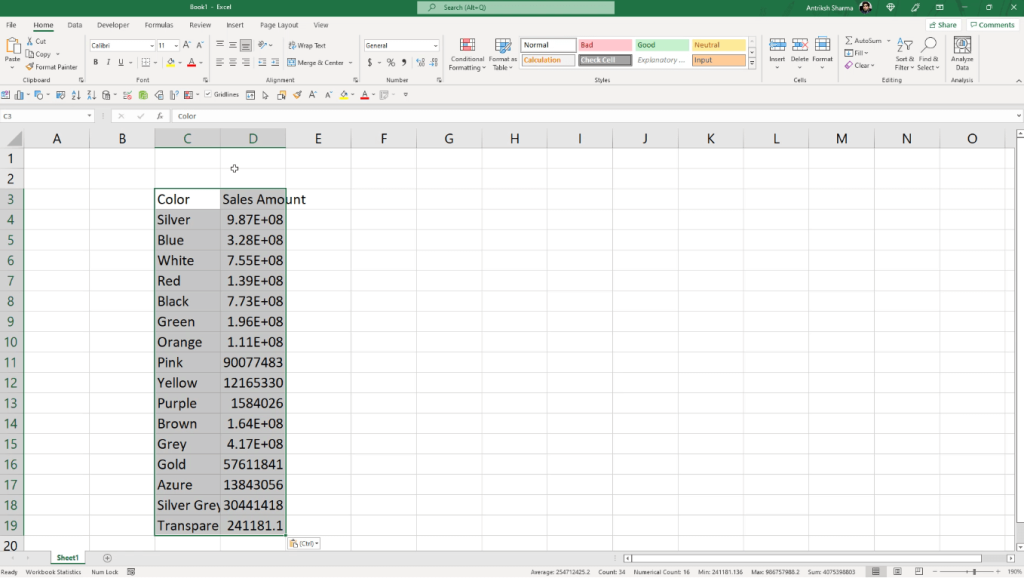
If you use the Clipboard option and then run the query, you can use the CTRL + V command to paste it in another program such as Excel.
Extract Query Results In DAX Studio To Excel
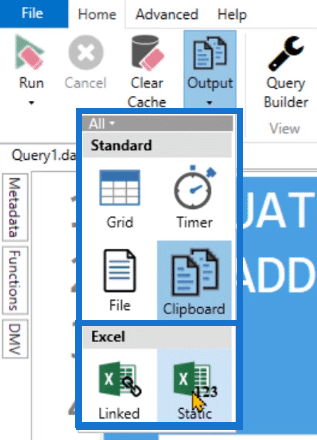
Another Output option in Power BI is Linked and Static.
Static Option
The Static option allows you to save your Power BI report in an Excel file.
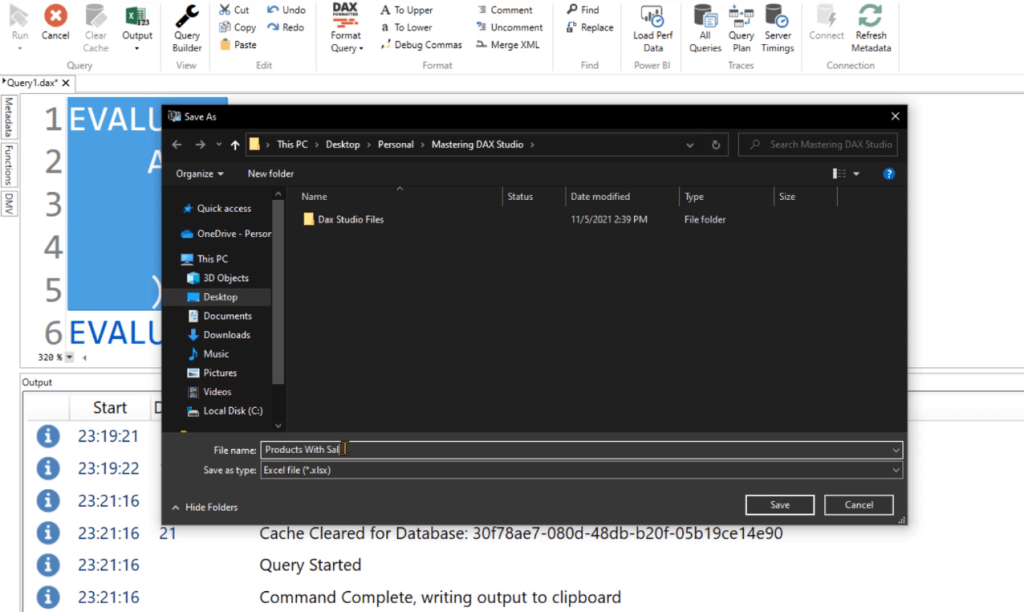
When you open this file, you’ll see that the table is already formatted in report form. The column headers are formatted with a blue background with white text. Each column can be filtered using the drop-down box.
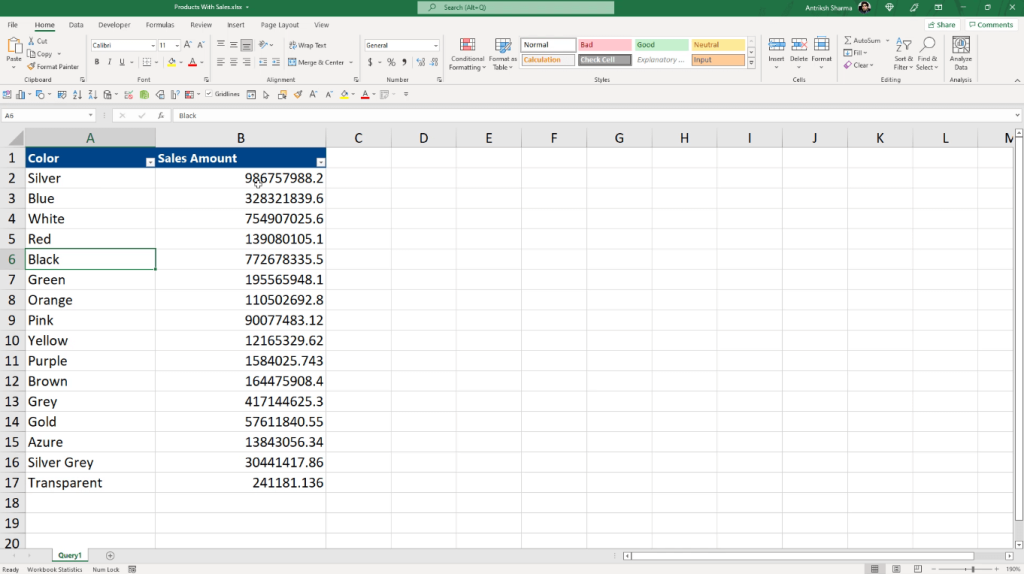
However, the Static option only creates an Excel report based on the current DAX query. It doesn’t automatically update if you make changes in DAX Studio.
Linked Option
The Linked option, on the other hand, creates an active connection between DAX Studio and Microsoft Excel and it remains active unless you cancel the connection manually.
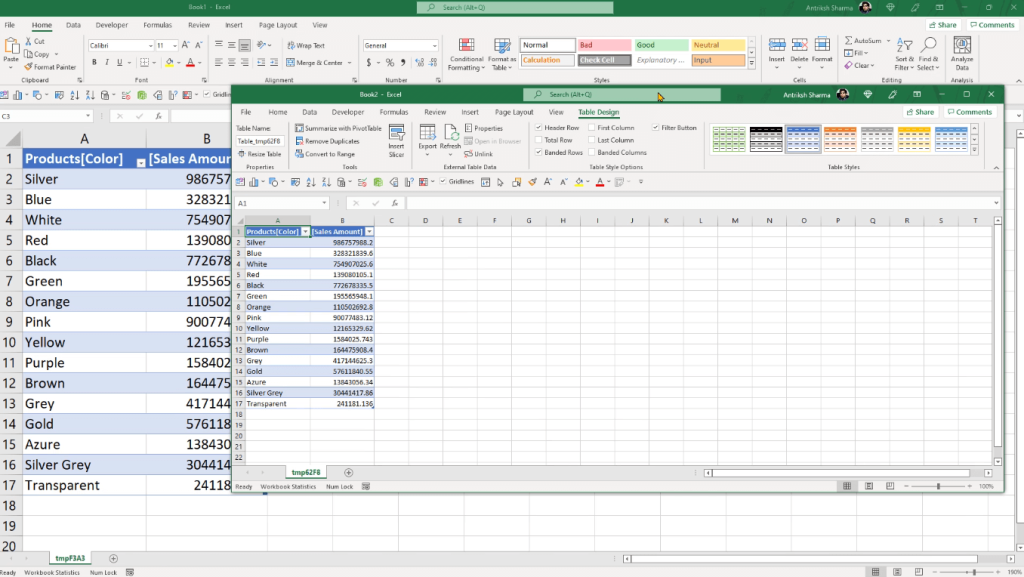
When you click the Linked option, Excel automatically opens.
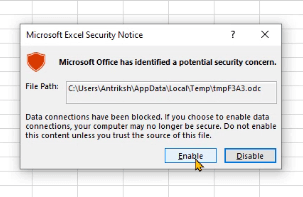
When you enable the connection, your DAX Studio data will be placed in a formatted Excel table.
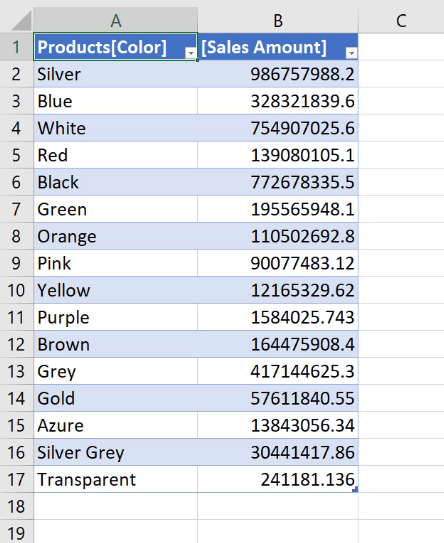
However, if you go back to DAX Studio, you need to cancel the connection before you can run the query again.
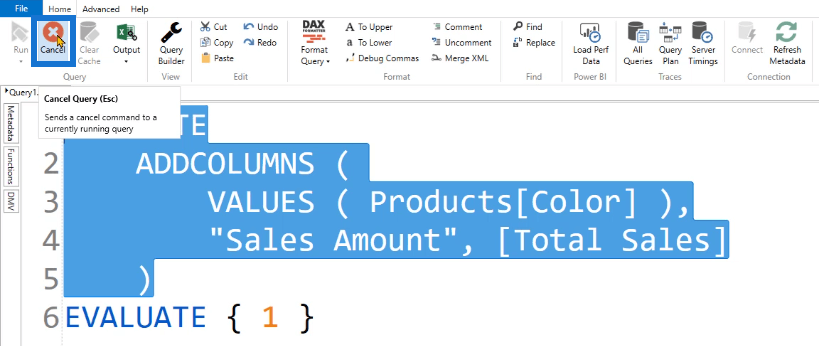
And if you run the query again using the Linked option, it will create a new Excel file.
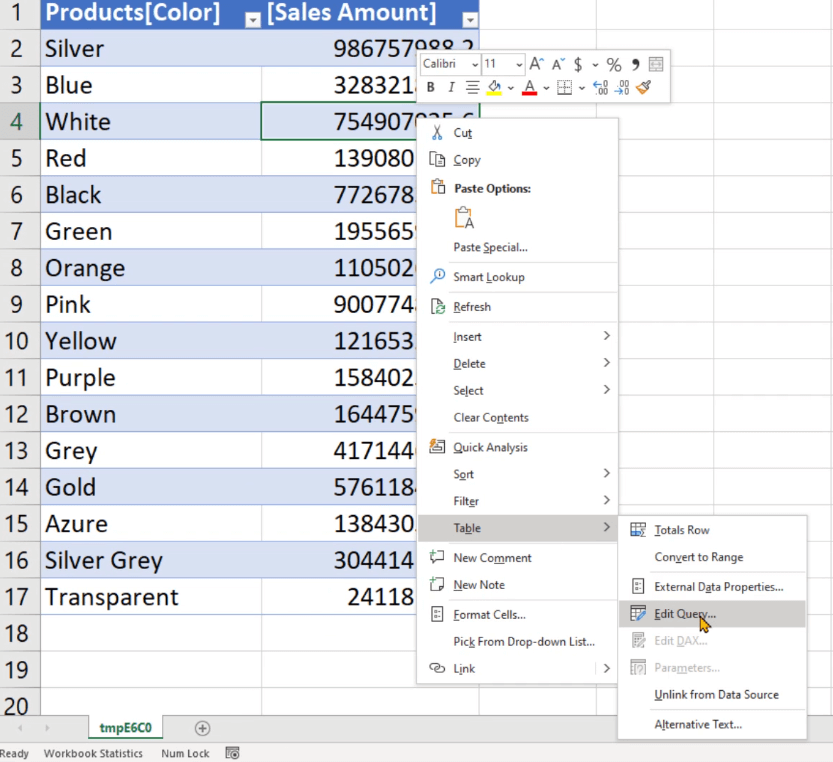
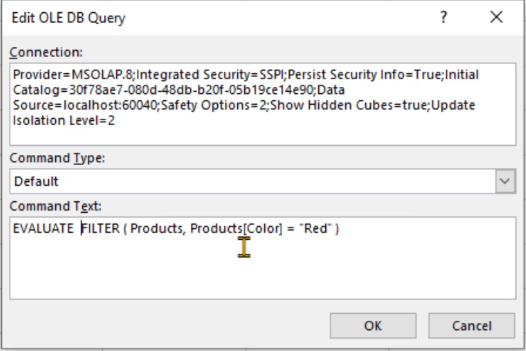
The great thing about the Linked option is that you can edit the query in Excel. You can do so by right-clicking on the table and selecting Table > Edit Query.
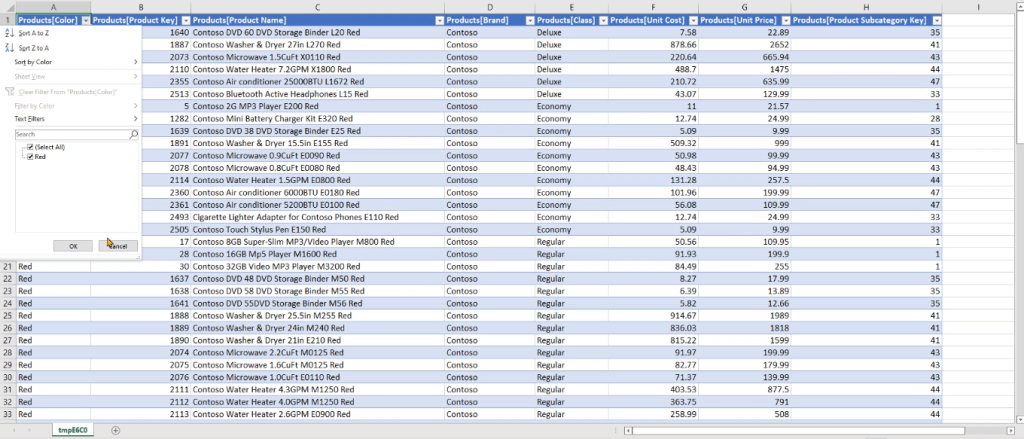
In the Edit OLE DB Query wizard, the Command Text textbox contains the same query in DAX Studio.
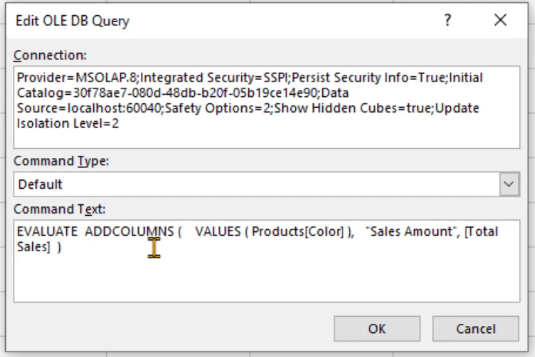
You can edit this to add in filters and other DAX functions or queries.
A Pivot Table For The Query Results In DAX Studio
You can also use your exported DAX Studio table to create a pivot table in Excel. Go to the Insert tab and select the Pivot Table option.

You can see that the Pivot Table Fields pane contains the same data as your data model in DAX Studio. Drag and drop these fields into their corresponding areas.
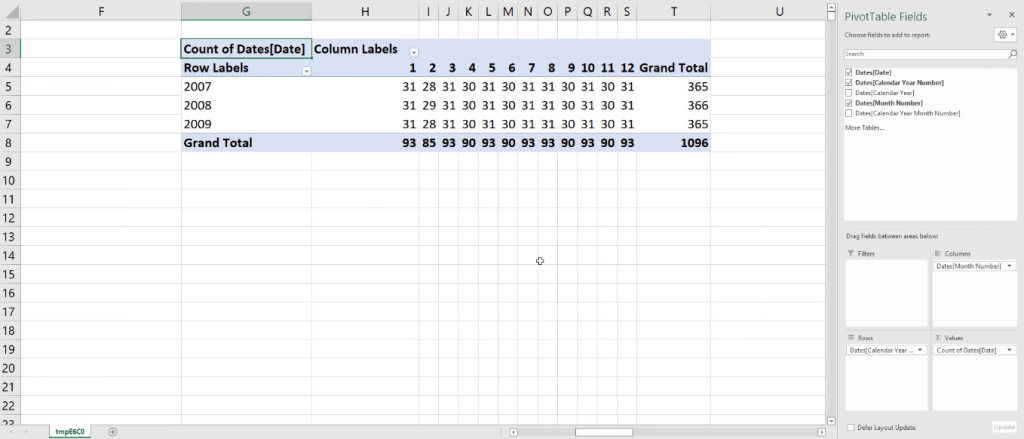
In this example, you’re able to create a pivot table that shows the number of days for each year in your data.
***** Related Links *****
What Is Power Query & M Language: A Detailed Overview
DAX Query Example Using Various Keywords & Functions
Export SharePoint Lists To Excel Or CSV File
Conclusion
This tutorial discussed the output option in DAX Studio. It has six sub-options that have varying processes but they all arrive at the same exact results.
If you want to extract a query result to an external program, you need to thoughtfully choose what option to use that fits your needs.
Each option has its pros and cons. By understanding their similarities and differences, you’re able to better identify which option to use on a case-to-case basis.
Enterprise DNA Experts


