
This tutorial will discuss how to create a calculated table and column in the Tabular Editor. You’ll learn how to pull out and summarize tables and columns using DAX functions. You’ll also understand why Tabular Editor is better at creating calculated tables and columns than Power BI Desktop.
Creating A Calculated Column
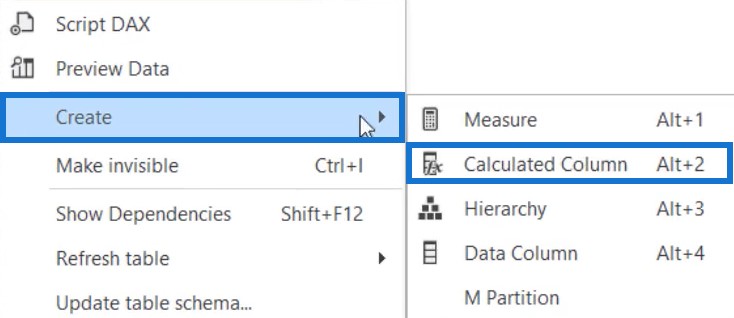
To create a calculated column, right-click on a table and select Create. Then, choose Calculated Column. For this example, a calculated column is created in the Sales table. After that, name the column Product Name.

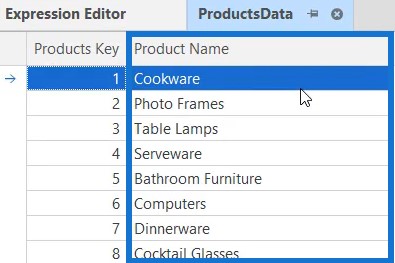
If you go to the ProductsData table, you can see a Product Name column.
You need to copy that column to the Sales table. Open the Product Name column in the Sales table and input the syntax. Use the RELATED function to access the relationship of the Sales table and ProductsData table and retrieve values. Once done, press CTRL + S so that changes can be saved.

Loading The Calculated Column
If you go back to the Power BI Desktop, you need to refresh the model so that the calculated column will be loaded.

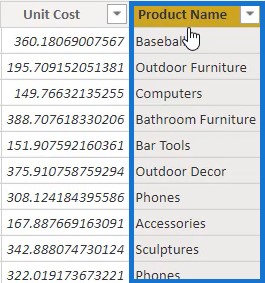
Next, if you go to the Sales table, you can see the Product Name column.
Now, create another calculated column in a dimension table and name it as the ProductsData table. Input the following syntax and name the column # Rows Sales.
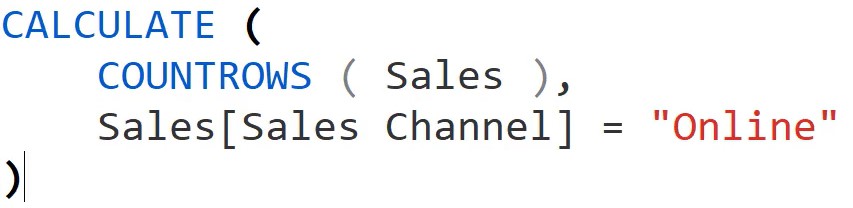
The Sales Channel column in the Sales table is used to determine the number of matching rows.
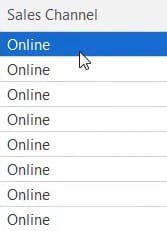
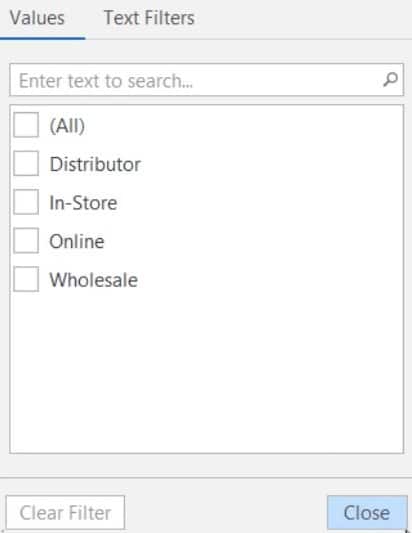
If you preview the Sales table, you can see that the Sales Channel column contains values like Online, In-Store, Distributor, and Wholesale.

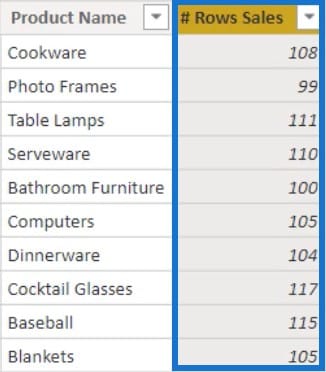
After that, press CTRL + S to save the changes in the tabular model inside Power BI and click Refresh Now to load the calculated column. If you open the ProductsData table, you can then see the # Rows Sales column which shows how many rows are there in each product name in the Sales table.
Creating A Calculated Table
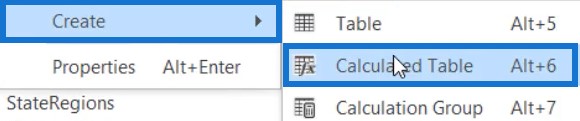
Aside from calculated columns, you can also create calculated tables in Tabular Editor. To create a calculated table, right-click on the Tables folder. Click Create and then select Calculated Table. Name the table Products And Region Sales.
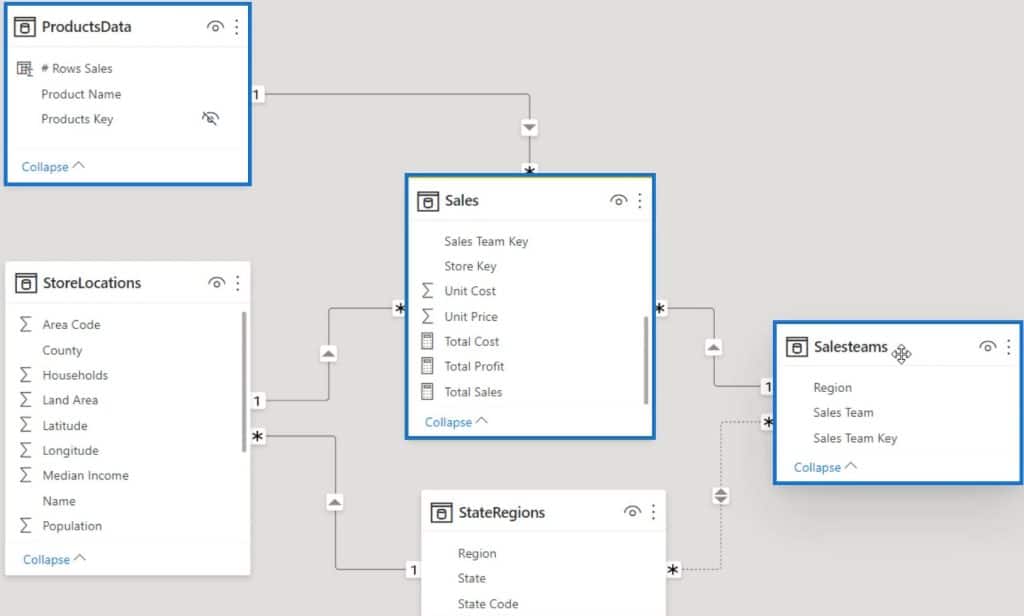
For this example, the calculated table will be a summary of some fields from the ProductsData, Sales, and SalesTeams tables. From the ProductsData table, Product Name will be used. Total Sales and Sales Channel will be used from the Sales table. And lastly, Region will be used from the SalesTeams table.
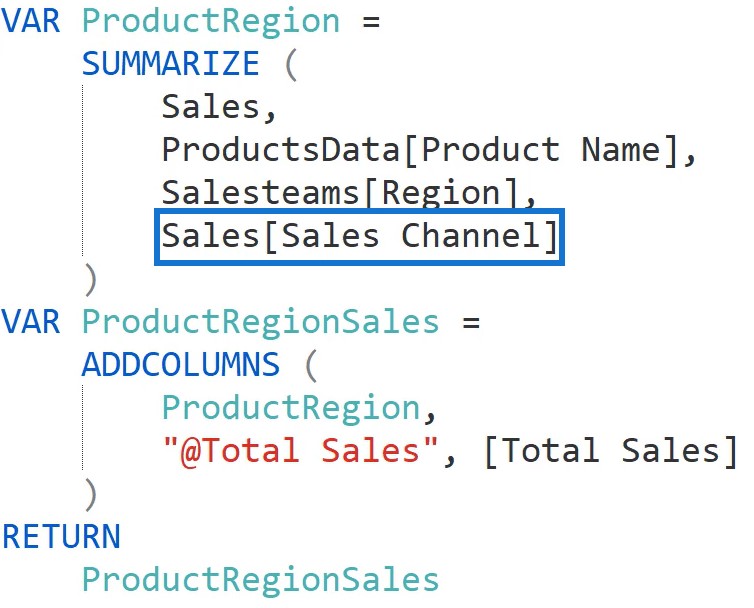
Next, double-click the calculated table to open the Expression Editor and to start creating codes. First, use the SUMMARIZE function to summarize the Fact table by the other tables. Create another variable that will add the Sales amount to each row of the tables using the ADDCOLUMNS function. Then, input the RETURN function with the ProductRegion variable.
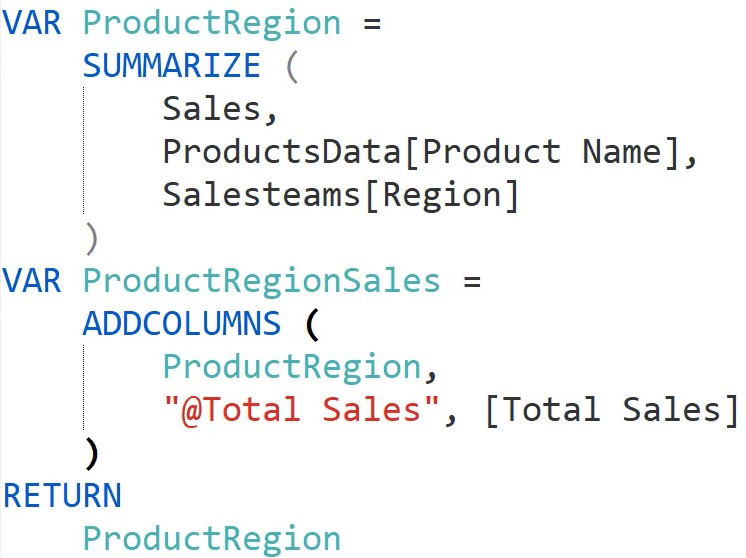
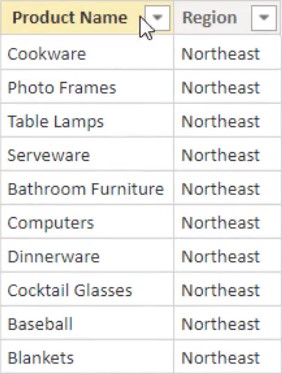
Once done, press CTRL + S to save the changes done in the model. Go back to the Power BI Desktop and refresh the table. After that, you can then see the Products and Region Sales table with two columns, namely, Product Name and Region.
Go back to the Tabular Editor and change the code. Instead of returning ProductRegion, return ProductRegionSales. After that, press CTRL + S and refresh the model in Power BI.
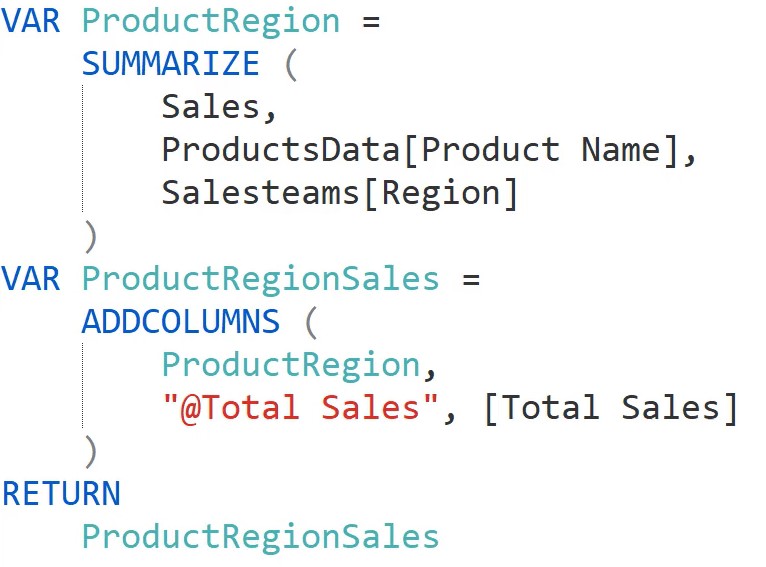
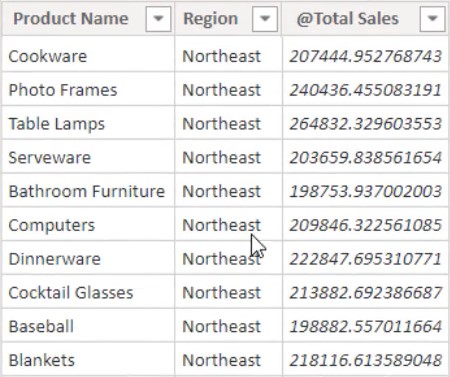
If you view the Products And Region Sales table, you can then see the @Total Sales column.
Adding Additional Fields In The Calculated Table
Go back to the Tabular Editor and add the Sales Channel from the Sales table to the summary of the first variable. Do this as seen below.
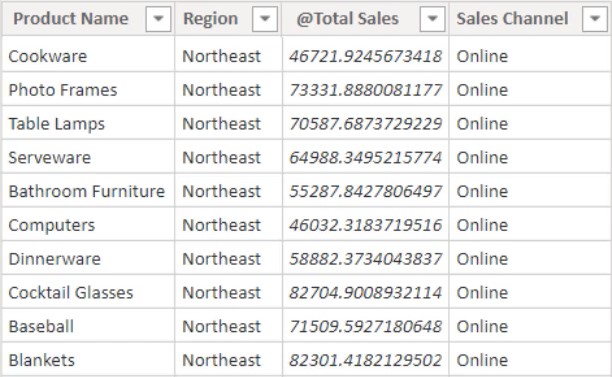
Once done, press CTRL + S and refresh the model in Power BI. You can then see the Sales Channel column in the calculated table.
***** Related Links *****
See Changing Results Using Calculated Columns In Power BI
Comparing Calculated Columns And Measures In Power BI
Tabular Editor 3: Beginner To Advanced – The Tenth New Course On Enterprise DNA’s Educational Platform In 2021
Conclusion
Using Tabular Editor to create calculated columns and tables is faster and more convenient than using the Power BI Desktop. It’s because you don’t need to directly refresh the metadata every time you perform an action. The only time the Tabular Editor is refreshed is when you press CTRL + S.
Enterprise DNA Experts


