For today’s blog, I’d like to quickly go over the feature Drillthrough in Power BI. This can be quite a powerful way to create a compelling navigation experience for the consumers of your report. I’ll be sharing a couple of examples of how you can apply this feature or function inside your report. You can watch the full video of this tutorial at the bottom of this blog.
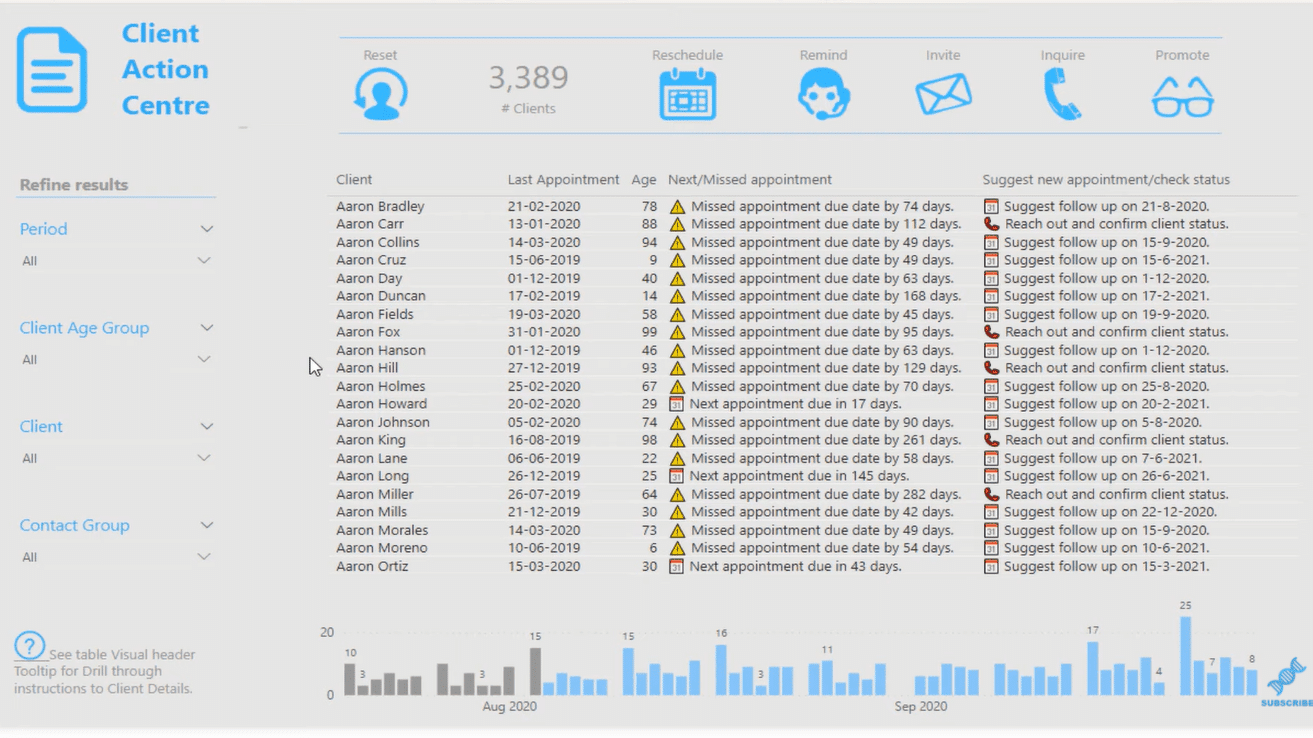
There used to be just one way to use Drillthrough in Power BI, but I discovered an improved way to utilize this function. For this example, I’m using this customer-related information report from Melissa, one of our Enterprise DNA experts.
The Functionality Of Drillthrough In Power BI
The idea of the Drillthrough functionality is for you to be able to narrow down a piece of analysis that you want to do. On a report page, you might have all the general information. But then you might want to dive into specific customers for example, which would be the perfect opportunity to utilize Drillthrough.
Another time in which you could maximize the Drillthrough function would be when you’re dealing with some regional analyses or you’re looking at all your products and you want to dive into one of your stores to understand the sales of specific products. Instead of having all that information on one report page or having to go to another page and then filter for a certain insight, you can just simply use Drillthrough.
It’s a great user experience to just have one click on the report page on a specific customer or product because then you can get the specific information you need; in the example below, it’s Client Details.
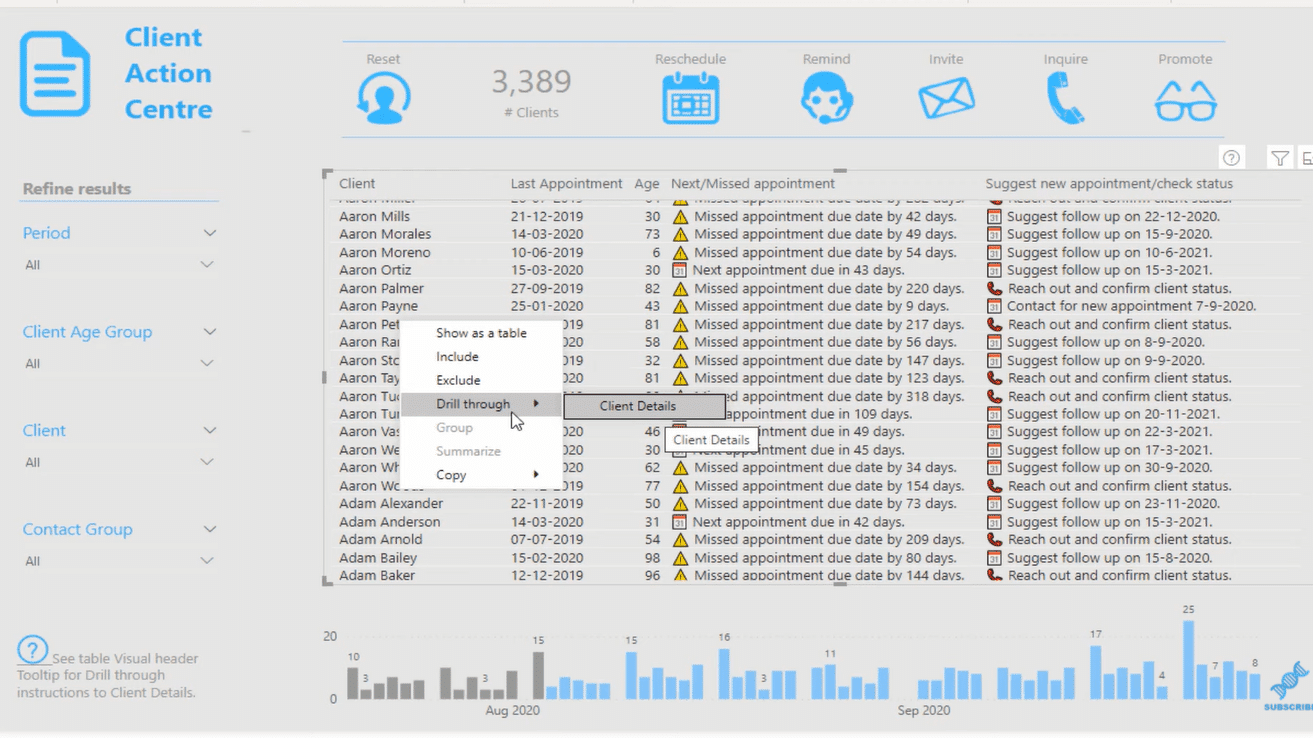
When you click on that, it will take you to a hidden page that has the client’s details. You only make this page available if someone uses the Drillthrough function.
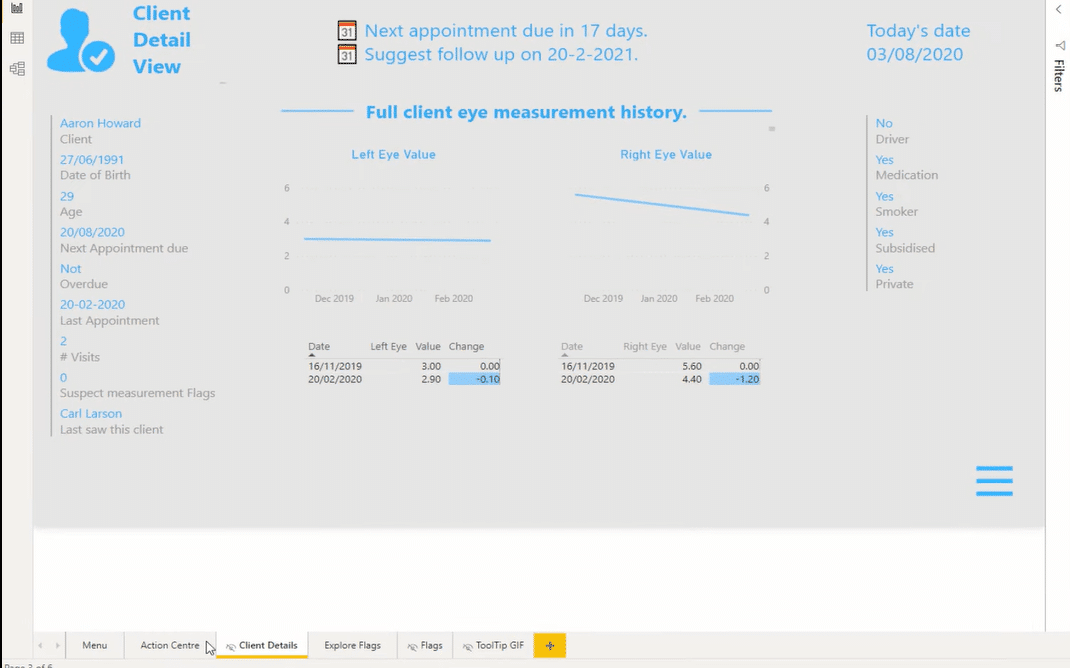
All you need to do is place the dimension that you want to filter across the entire page.
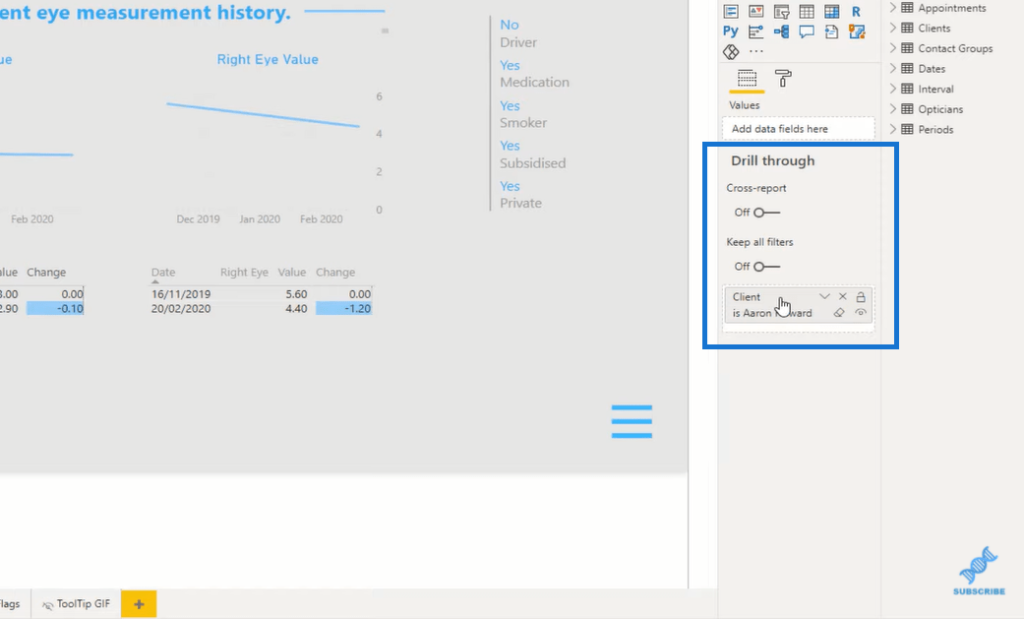
One of the things that I also like in this report is that Melissa added this dynamic GIF, which shows you how to do the Drillthrough.
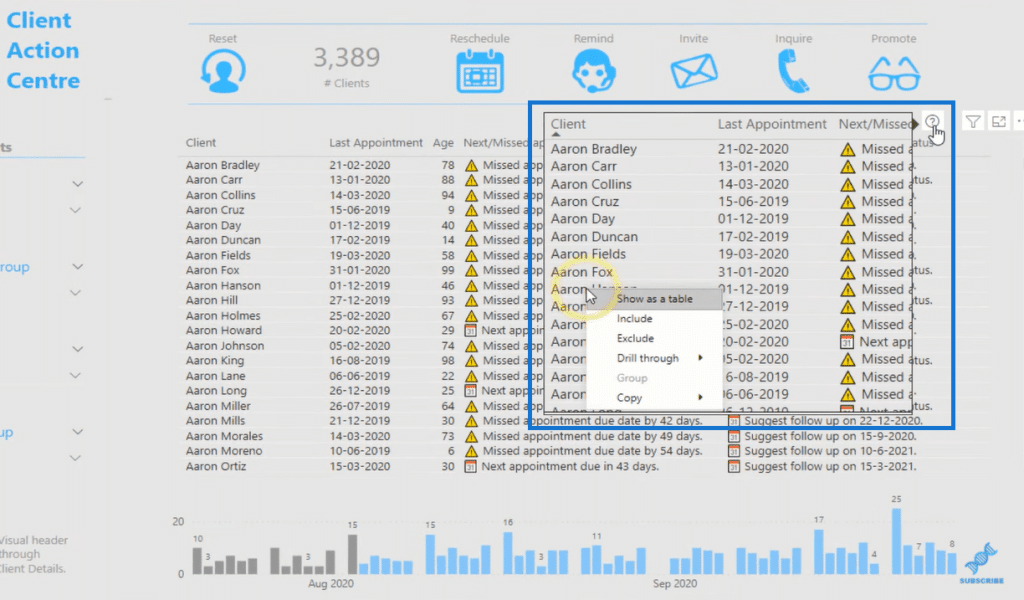
However, many users are not aware or will not know that you have the Drillthrough functionality available unless they right-click on something, and that’s the downside of this feature. This is why I want to show you a new and improved way of using Drillthrough.
New Way Of Using Drillthrough In Power BI
This is the Enterprise DNA Learning Plan, which is a sort of recommendation system for working through our content. What we’ve done on this page is that we’ve added the ability to drill through by clicking on an image.

An example might be that you want to check out a course. In this case, you can select a course. When you do this, you will notice that the image in the upper right corner changes as well.

When you click on that Drillthrough image, it will take you to the course details that had been set up on a different page.
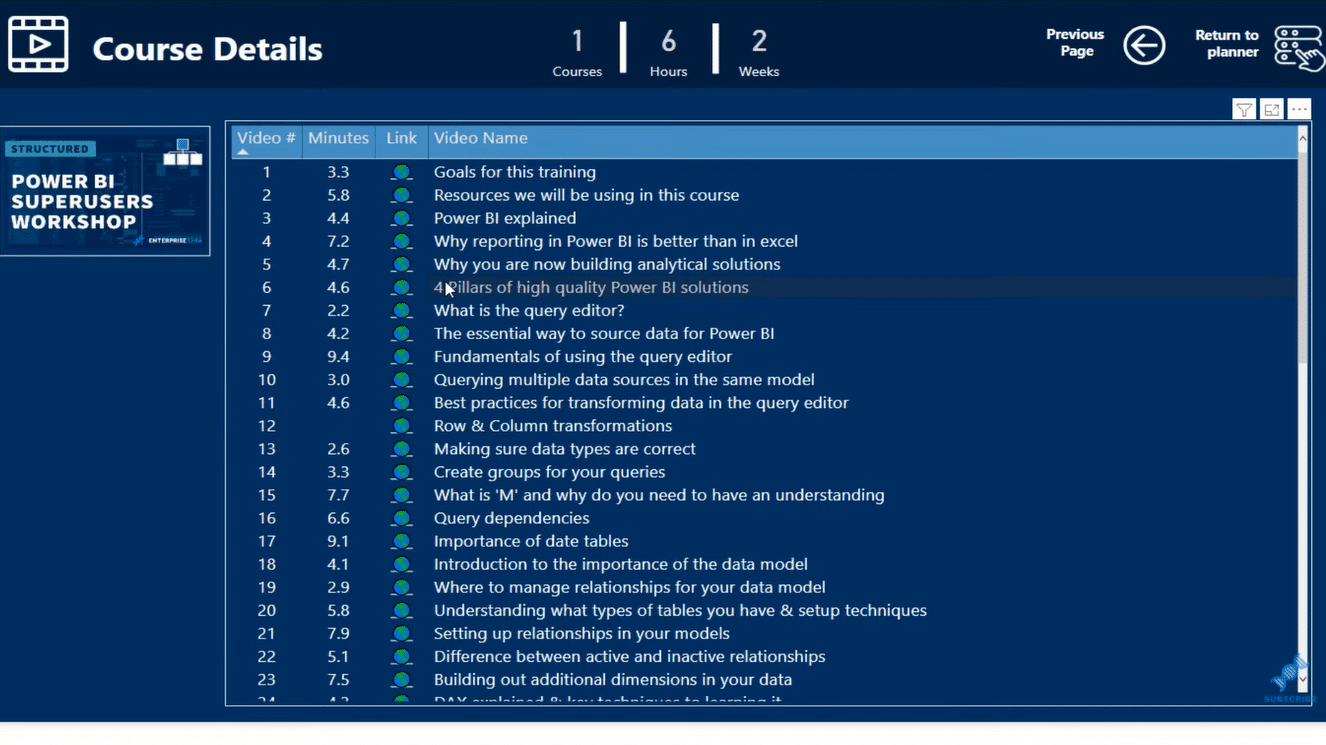
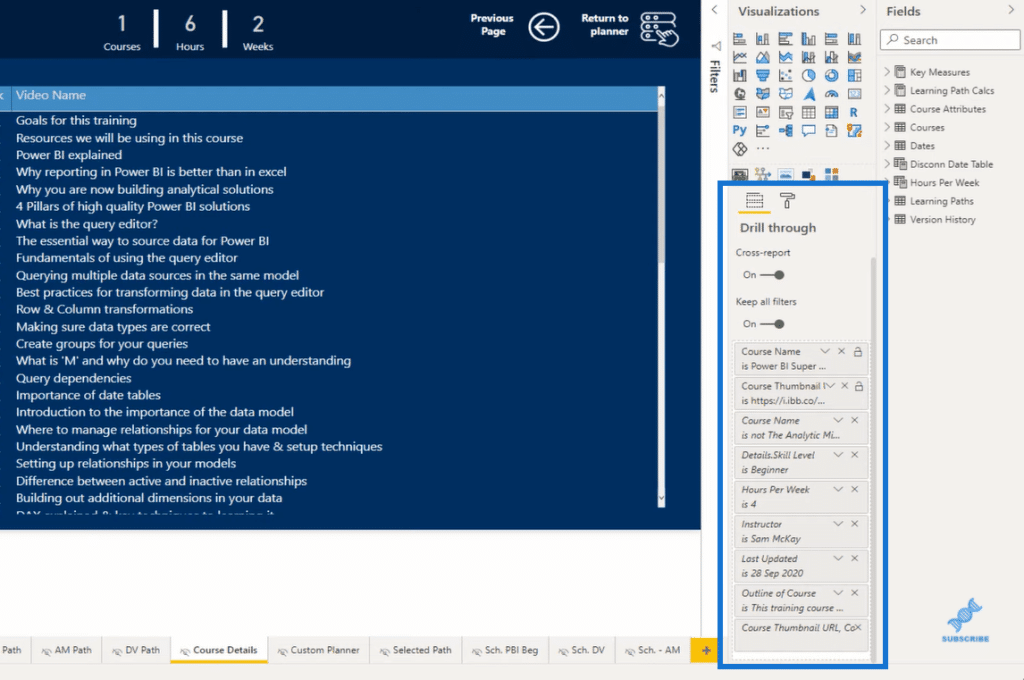
If you look at the Drillthrough section on the right side, you’ll see the filters that have been put in place.
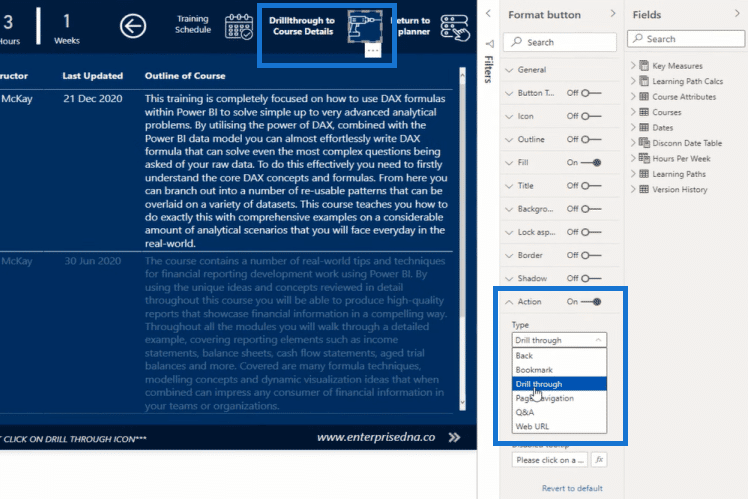
You can still right-click on the report and you’ll find Drillthrough, but by doing it within the image, it’s much easier and more effective. To do that, just click on the image, and then go to the Action section, where you have the option of Drillthrough.
***** Related Links *****
Power BI Drill Through Navigation Techniques
Building A Reporting System With Power BI
Dashboard In Power BI: Best Design Practices
Conclusion
The Drillthrough functionality is such a useful feature in Power BI. It helps enhance the users’ experience when navigating through reports. It also enables you to create high-level Power BI reports.
I hope you can see how easy and fast it is to put together a compelling report like this using the Drillthrough function. It’s not complicated at all, so I highly recommend that you utilize this feature in Power BI. Check out the links below for more related content.
Cheers!
Sam


