This is a very good demonstration of DAX calculations in Power BI. I will show you how you can calculate the total of a range of average results, utilizing the correct DAX formula combination. You may watch the full video of this tutorial at the bottom of this blog.
This requires a reasonable understanding of how iterating functions work within Power BI. These are functions like SUMX, AVERAGEX, MINX, MAXX. Usually the function has an X on the end.
Once you can understand what iterating functions do, you can have a much better understanding of how to manipulate a formula to be able to calculate a unique total.
With this example, we work through AVERAGEX to get the average. Then, I’ll show you how to use SUMX as part of the formula to then re-calculate up a different total than what you would ordinarily receive if you just utilize AVERAGEX.
We also cover the HASONEVALUE function, which is quite widely used in very similar scenarios.
Looking Into The DAX Calculations
Let’s look at this table and evaluate what is actually occurring in these formulas inside the table.
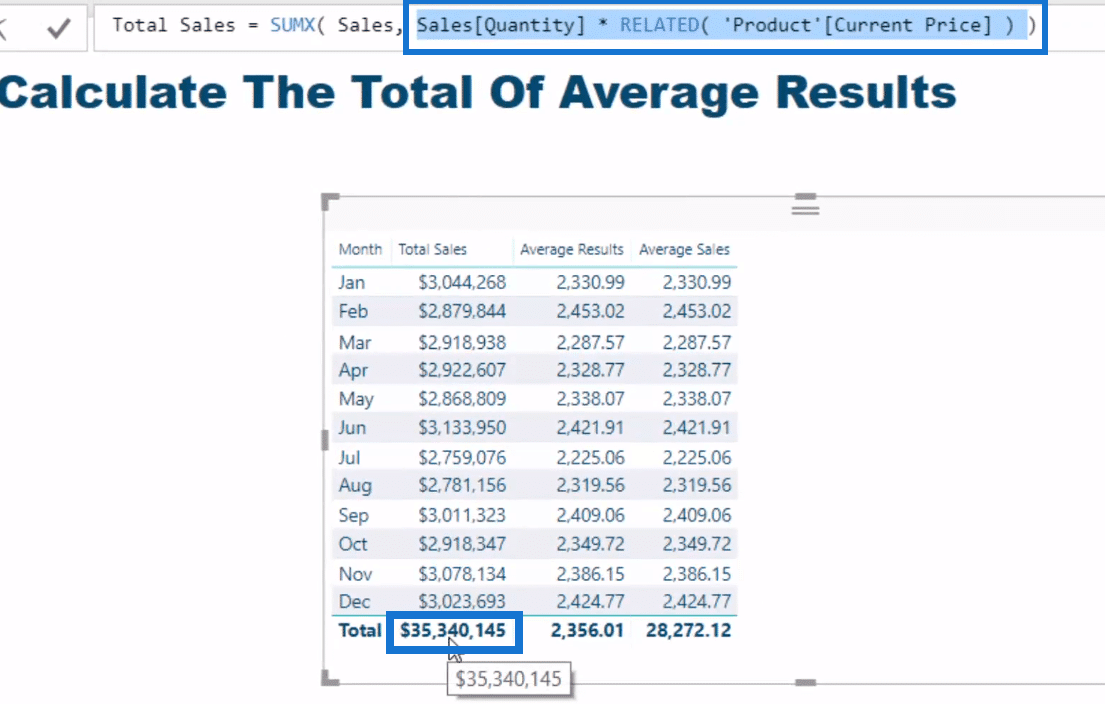
First of all, we take a look at Total Sales. It is a simple sum formula or SUMX formula, which is an iterating function.
It’s just doing a sum, but we are evaluating a logic at every single row because that’s what iterating functions do, specifically SUMX.

The key point here is when it gets to the total, which is 35 million. Because there was no context on this result, it’s actually iterating at every single row in the underlying Sales Table, completing this logic. And that’s how we get the 35 million.
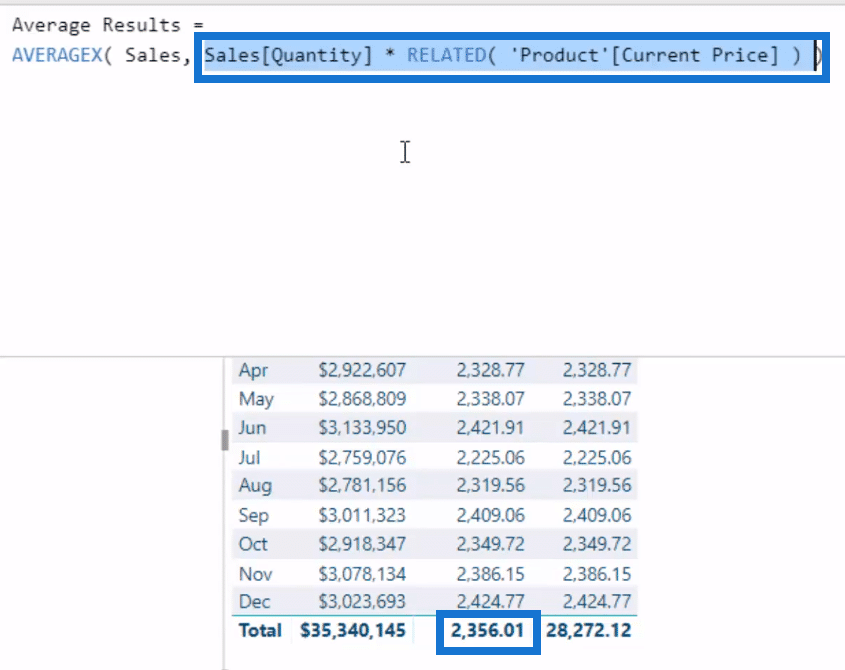
But then, when we jump to AVERAGEX, it’s the exact the same formula. It has the same parameters inside the formula, except that we have the average here.

Now let’s look at the total, 2,356.01. The total is going to be what is calculated at every single row, just like it is in SUMX. But instead of doing a sum, it’s doing an average.
That’s why we have a low number here, which is 2,356.01. It is the average of every single sale that has ever happened in the Sales Table.
There’s an evaluation happening in every single row and it’s saving it into the memory, and then going to the next row and the next.
Right at the end, it’s going to average up every single sale transaction that has occurred.
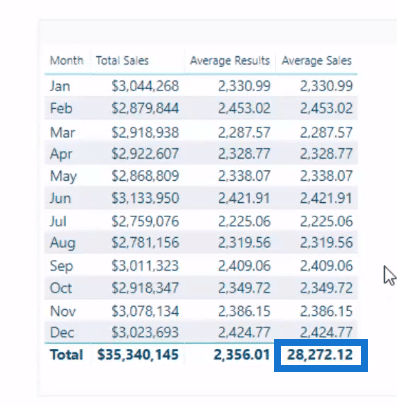
But the key part of this tutorial is to know how we got this total, 28,272.12. We want to find out how to workout a total of all of our averages.
Calculating Total Of Averages
To get the total of average results, we need to create some different behavior in the total area.
How do we do it? First, let’s review the formula that I have created.
If we check out the variable, AVERAGEX, we’ll recognize that this is exactly the same as what is occurring in this particular part of the table.
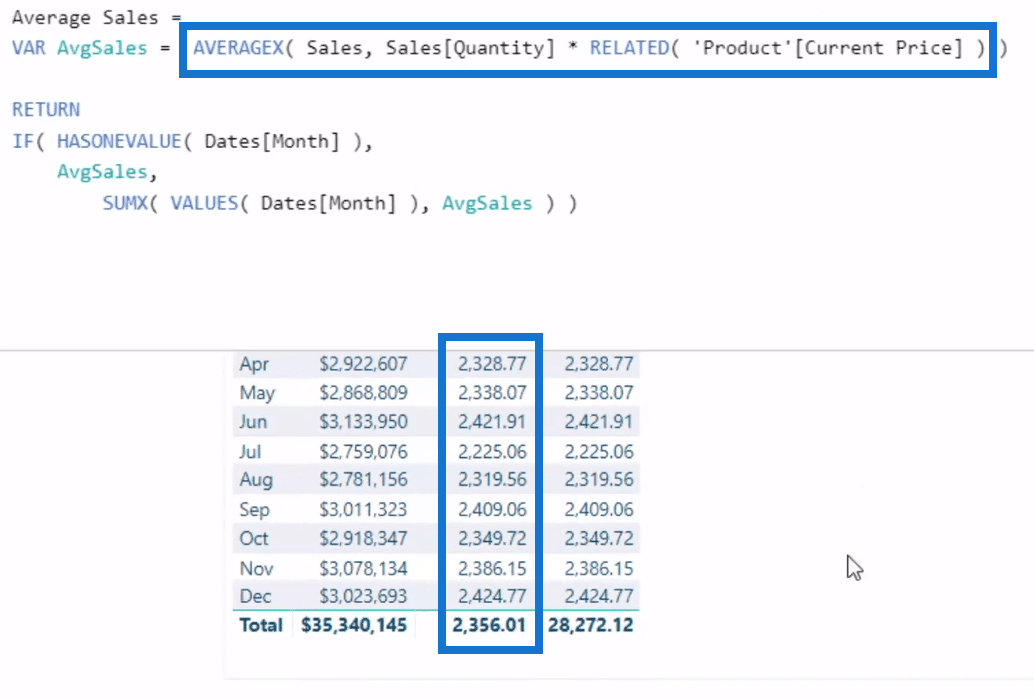
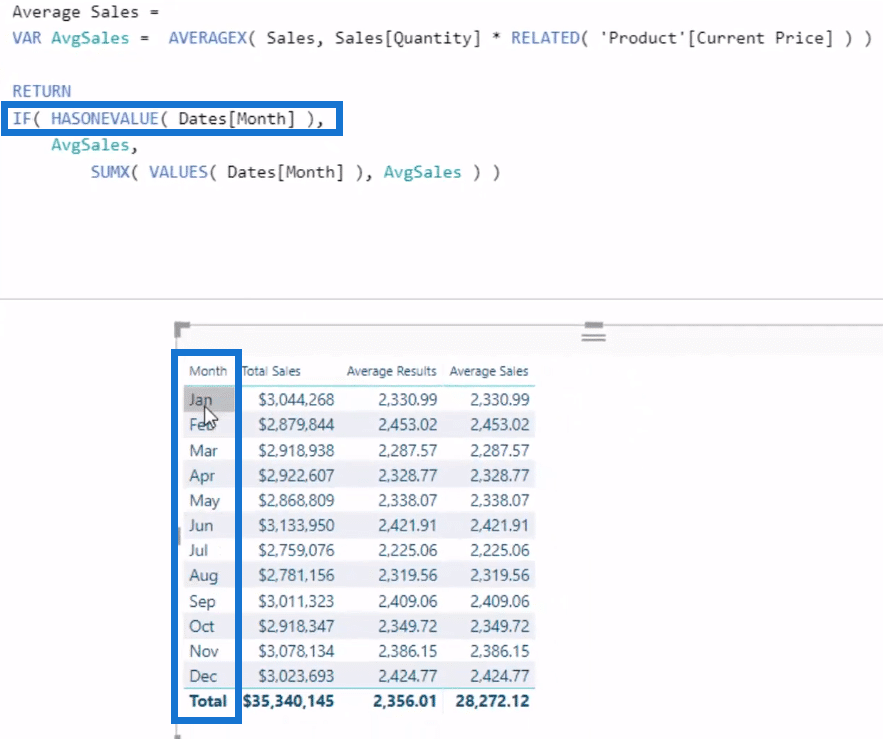
We use this logic, IF HASONEVALUE, where I go Dates Month because we are in a monthly context.
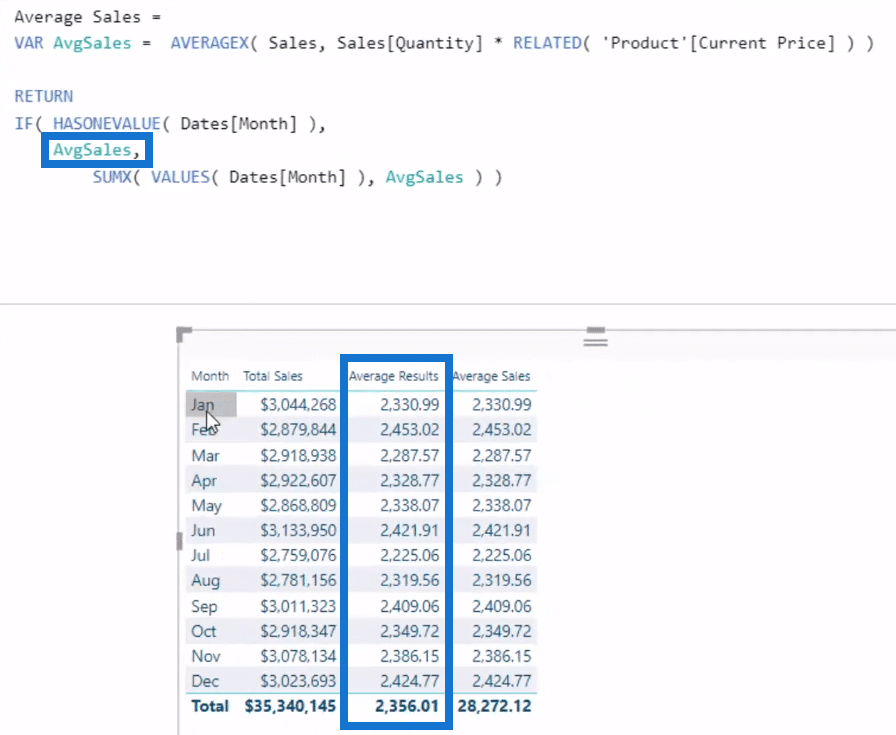
If the monthly context has one value, then we are going to evaluate the same exact formula (AvgSales), which you see here it’s exactly the same.
But if it’s not, which means it’s basically in the total area, then we want to do something different.
We will do a SUMX because we want to create somehow a sum of the Average Sales. And we want to evaluate in the total (28,272.12) every single month and sum up the Average Sales.
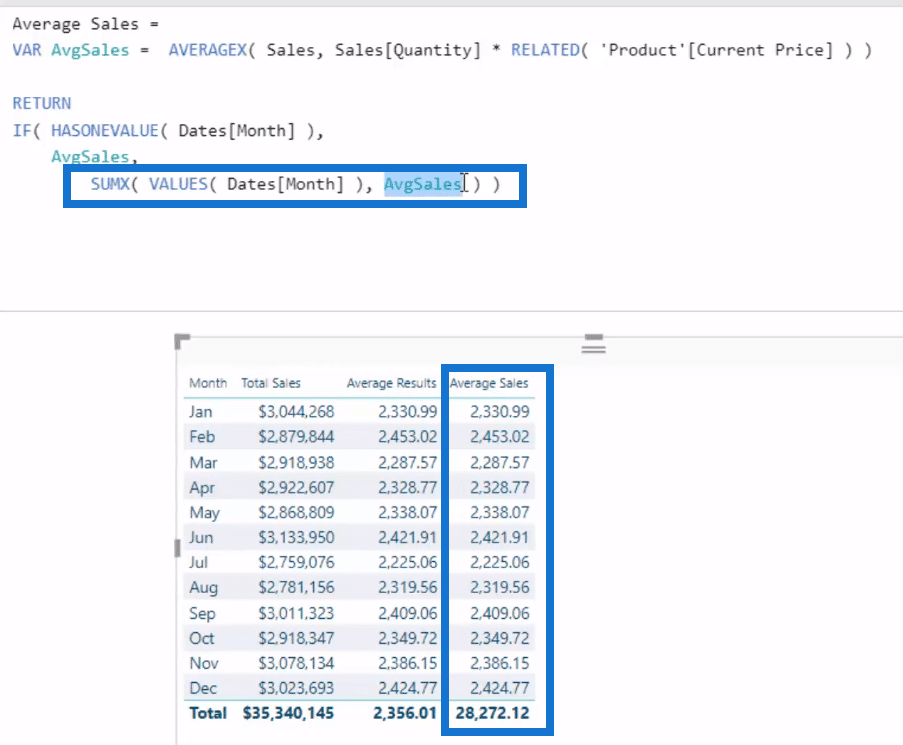
So at the total (28,272.12), instead of evaluating every row of this Sales Table, we are evaluating every month.
We get the Average Sales of each month, and instead of doing an average, we are doing a sum because inside is SUMX.
And that’s actually how we get the sum total of all the averages.
Implications Of The Total Of Average DAX Calculations
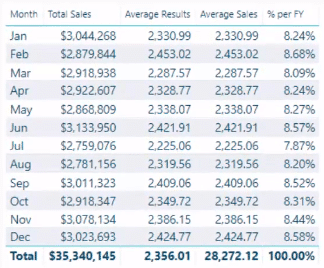
There are many ways you can use this technique of combining formulas to create this average totals. One example is when you want to get the Average Sales per Financial Year, as I did in this example.
You’ll see in the example that the total of averages is in every single row.
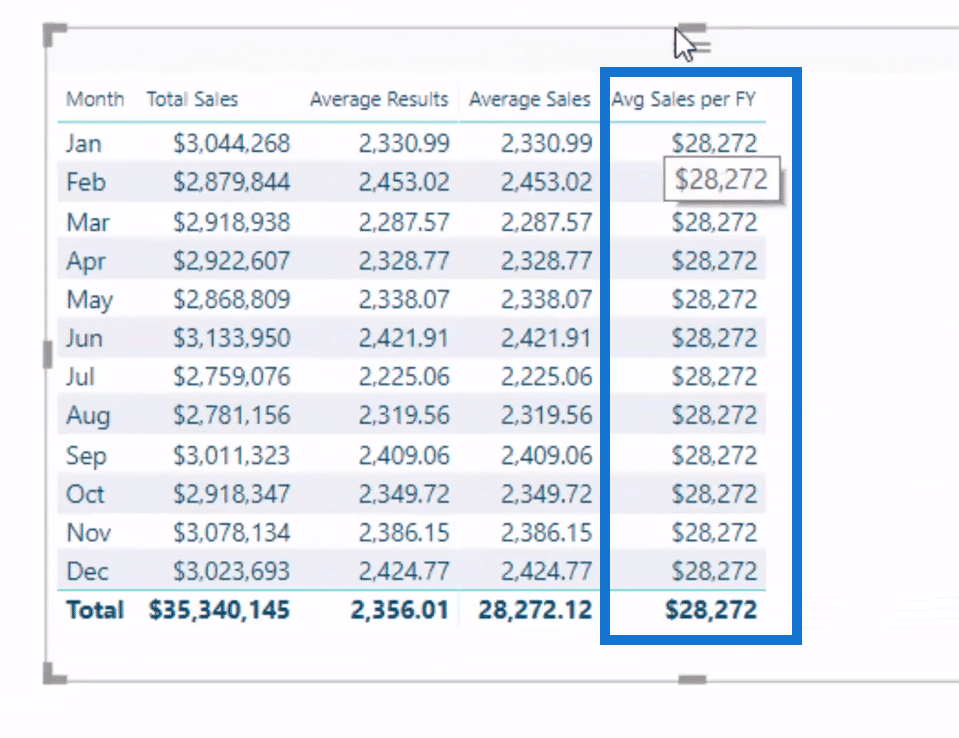
I calculated that using the ALLEXCEPT, removing all the context in the financial year and that’s how the total pop up to all of these.

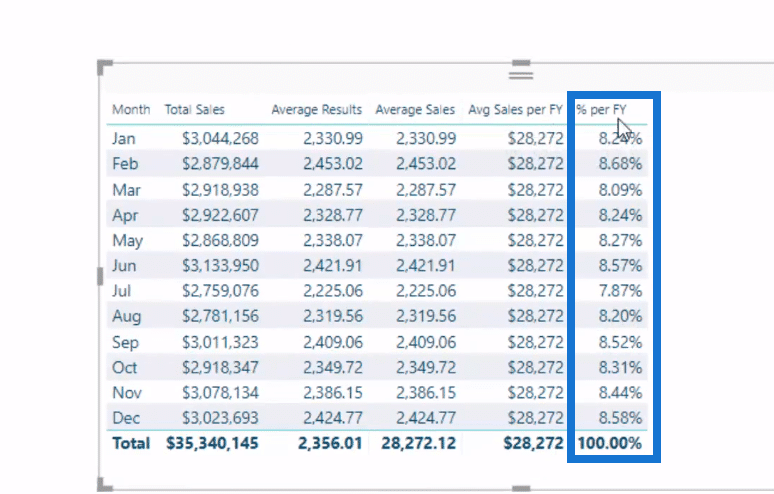
Then, I worked out the Percentage Per Financial Year (% per FY). It’s done by dividing Average Sales by Average Sales per FY.
You’ll know that it’s actually working because this is a hundred percent here, as it should be.
***** Related Links *****
Cumulative Totals Across Averages & Dynamic Date Logic – Advanced DAX
Calculating % of Totals
Cumulative Totals In Power BI Without Any Dates – Advanced DAX
Conclusion
This topic on DAX calculations for total of average has been widely requested on the forum and elsewhere.
When getting the total of averages, we use a combination functions like AVERAGEX, HASONEVALUE, and SUMX with some logic combined to get the ultimate total of all averages.
This is a very reusable idea if you need to get totals that are quite different to what is actually the general calculation in your tables or your visualizations.
Here are other related topics involving SUMX:
Show Last N Sales Of A Customer Only Using Power BI
How To Understand Virtual Tables Inside Iterating Functions In Power BI – DAX Concepts
This is quite a unique DAX formula. If you can understand how to do these DAX calculations, then you’re doing very well with your Power BI knowledge. You are in a good place to work out other advance things especially when iterating logic is required.
Enjoy working through this one.
Sam


