
For this blog post, I want to take some time today and introduce you to a custom visual in Power BI that I’ve started using which provides a lot of flexibility and capabilities that are not possible within native Power BI visuals. You can watch the full video of this tutorial at the bottom of this blog.
I know we’ve been talking a lot about Deneb lately and with good reason, but this one also provides a lot of flexibility. Using the two of them together makes for quite a powerful pair. The custom visual I’m talking about is called the K Team Solutions’ HTML & CSS Viewer.
There was a question in the forum recently on how to control both the color and the rich text formatting attributes of a card visual based on a DAX measure. Color is certainly not a problem; that’s something we can do quite easily through conditional formatting within Power BI.

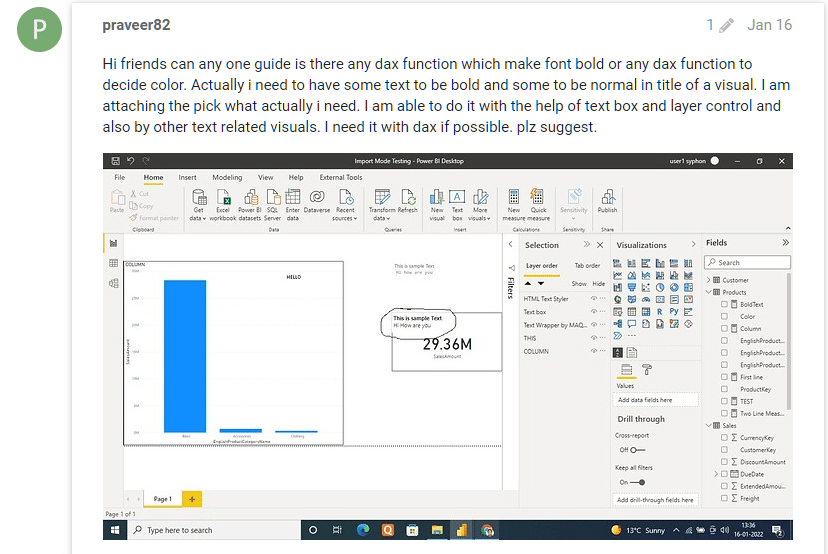
Controlling attributes of texts like bold and italic through DAX measures is something you can’t do with native Power BI, but is quite easy to do with this HTML CSS viewer. You can also use the visual to create some visual effects and make a comprehensive KPI card approach.
Let’s take a look at the forum post. Basically, the member had a simple card visual based on a measure and they wanted to change the attributes of the text.
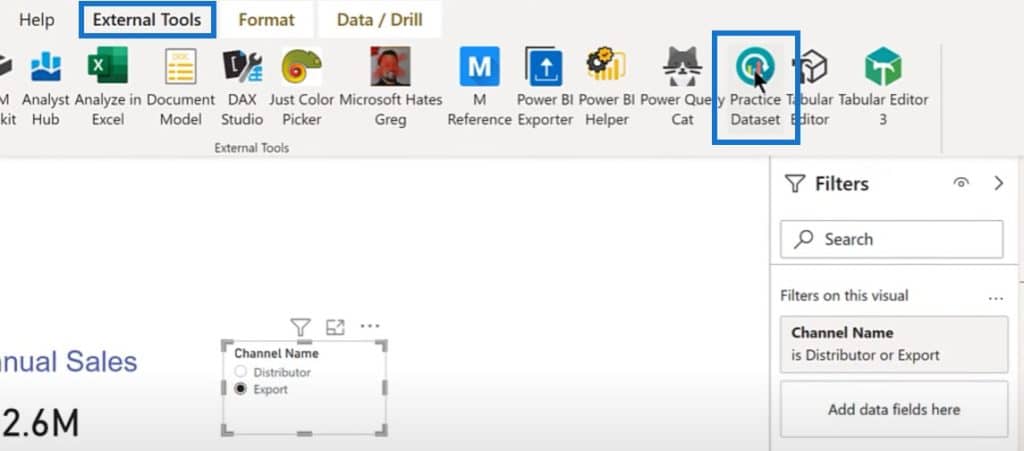
We’ll jump into Power BI to recreate this scenario. We’ll set the measure up based on the Practice Dataset from the external tool that we use for creating mockups.
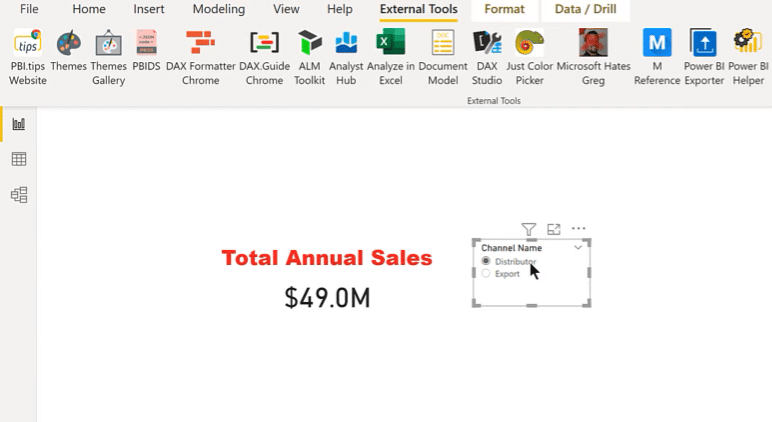
We’ll set it in a way that if the total annual sales was greater than 40 million, it will be bold and red.
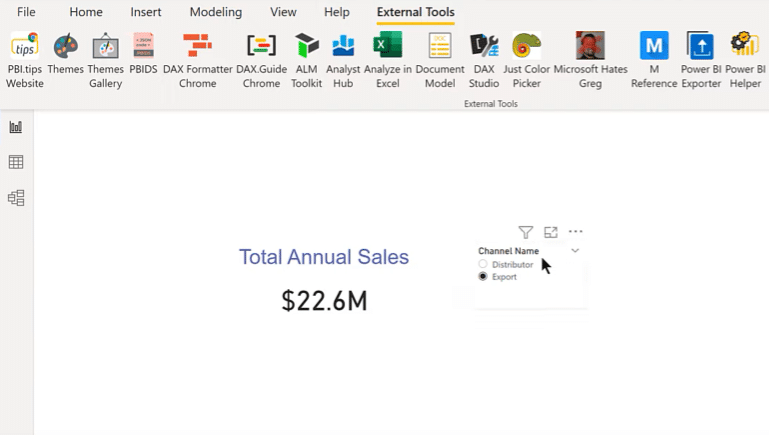
And if it was less than that, it will be blue and not bold.

Downloading The HTML CSS Viewer Custom Visual In Power BI
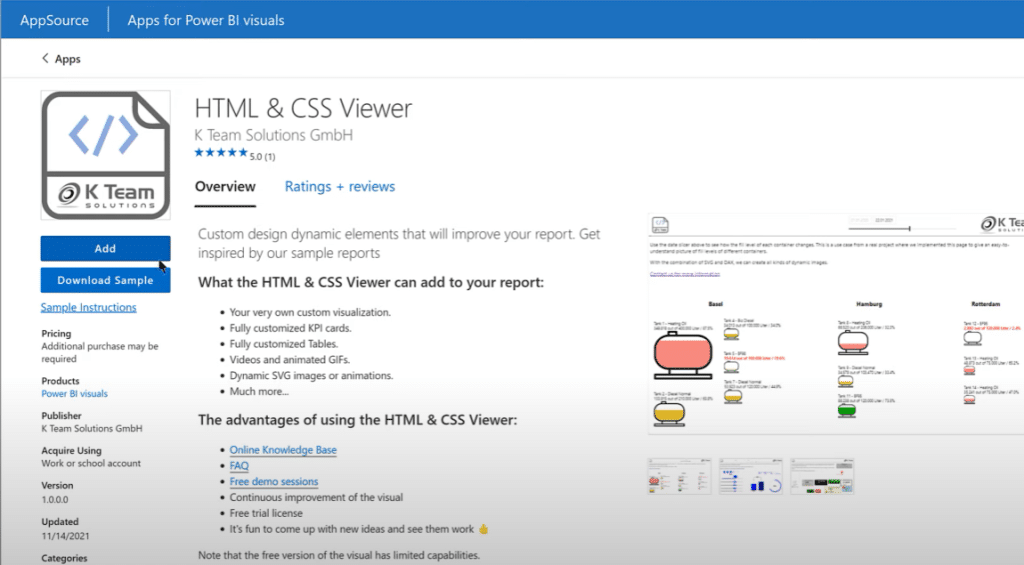
I’ll show you how this can be done. The first thing to do is to actually get the visual. Go to AppSource and type in HTML CSS Viewer.
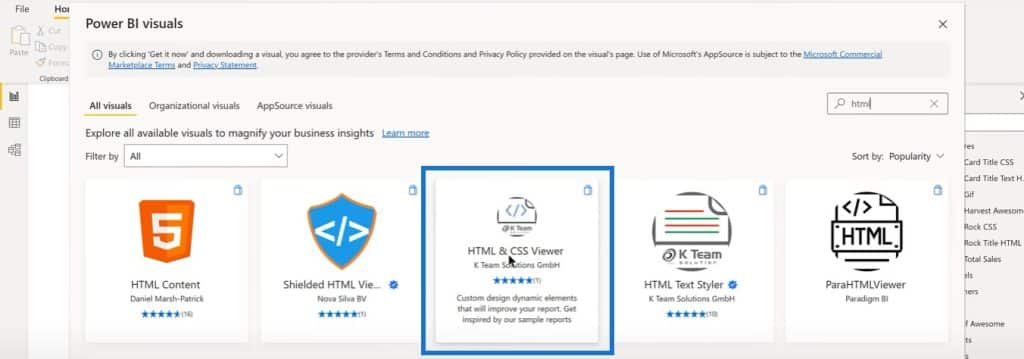
This will be a paid visual, and for now you can get a free trial license from their website until the end of September of 2022. You have a couple of months to test this for free.
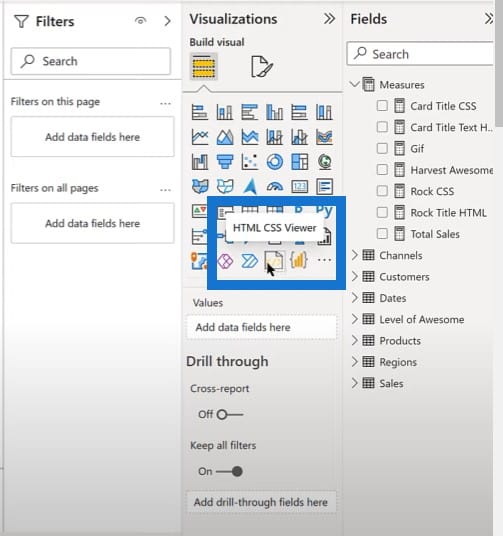
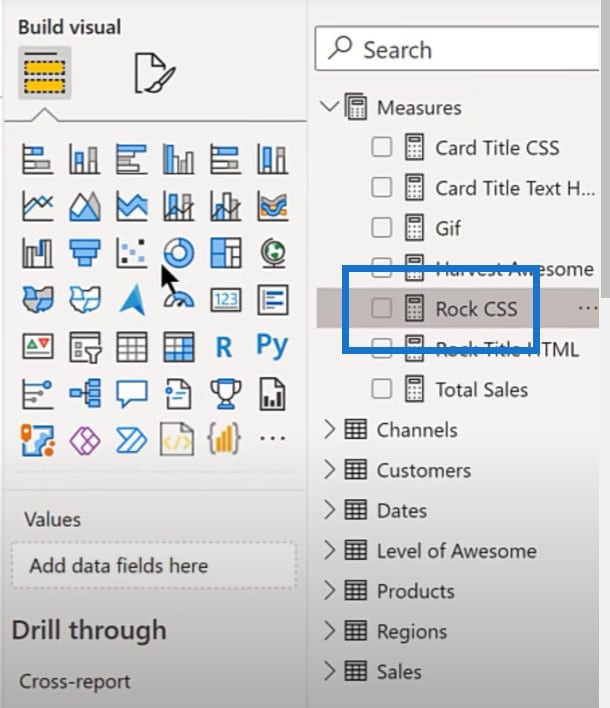
Once we have loaded it in Power BI, we can see it from the visuals pane. We can pin it as a permanent visual if we’ll be using it frequently.
Changing The Font Properties With A Custom Visual In Power BI
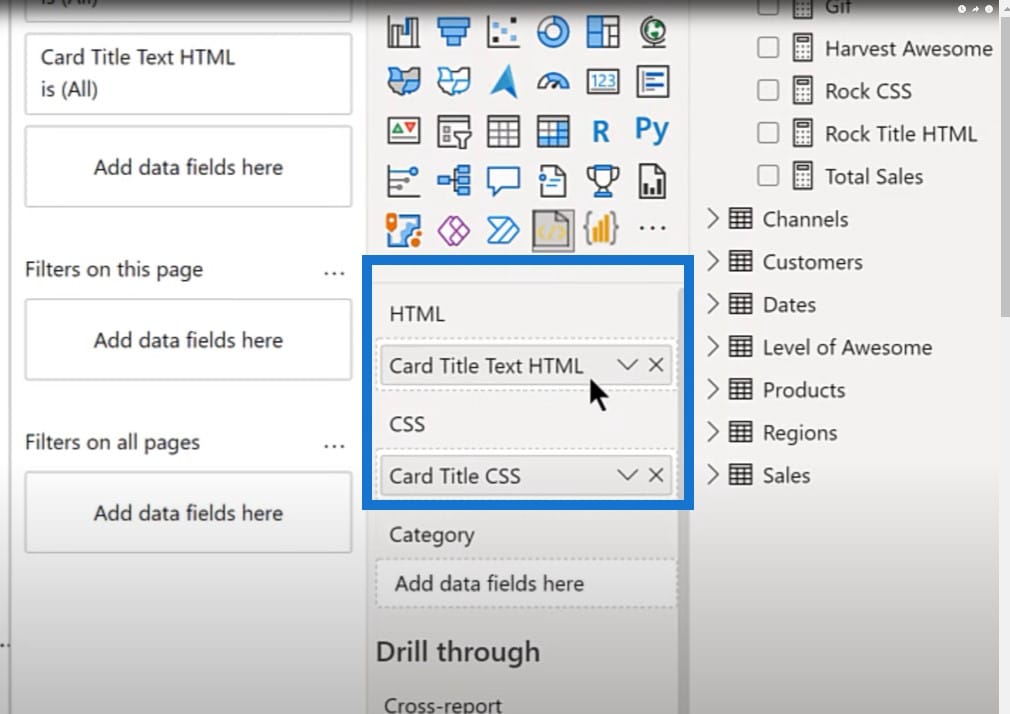
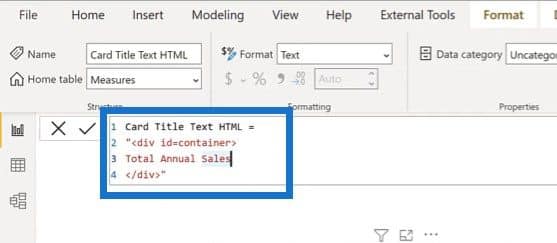
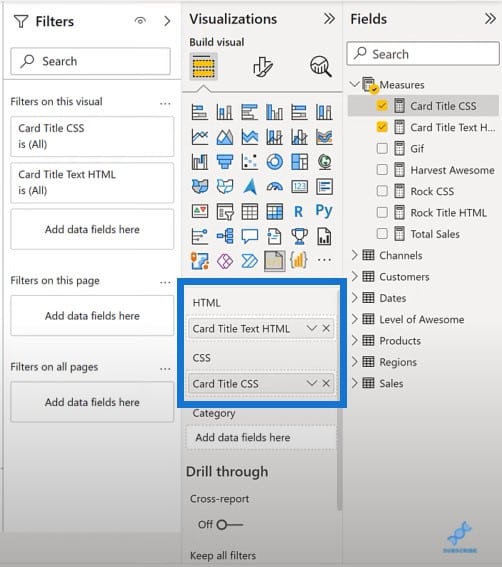
If we look at the text box, there are two main measures we’re using here: an HTML measure and a CSS measure. HTML provides the general structure of the webpage while the CSS provides the formatting.
What we have here is an HTML tag, and then the ID=container is a callback to the CSS. The main substantive body of this is just the title in the text box.
And then if we go to the CSS, this is when things get a bit more complex.
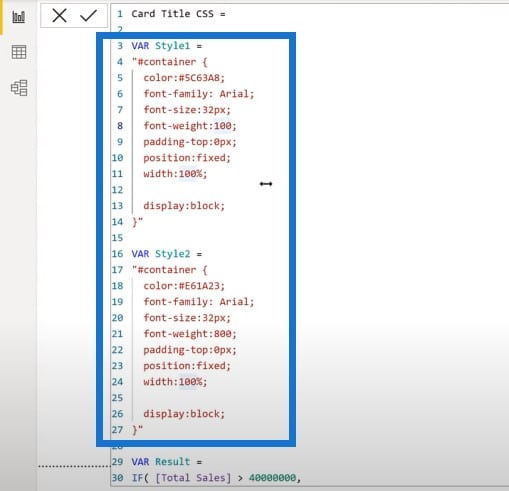
The general structure I use is Style 1 as a variable, and then Style 2 as a variable.
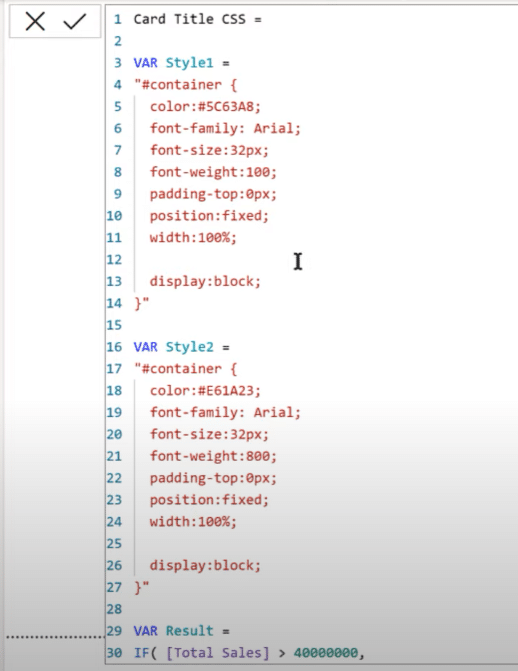
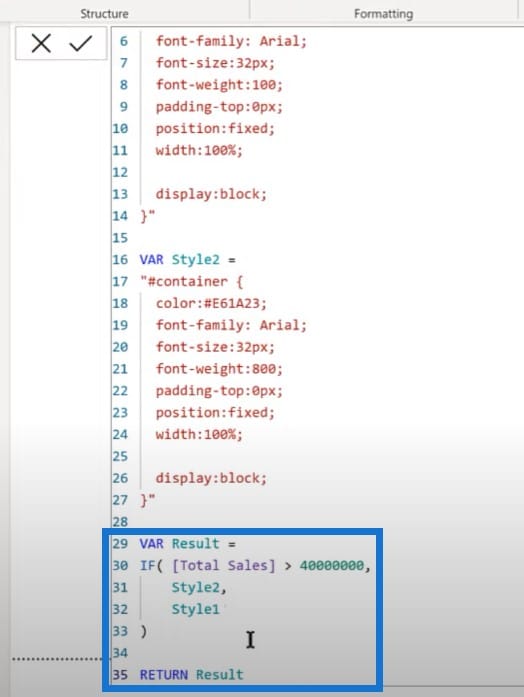
This is followed by a simple if statement that says “if the total sales is greater than 40 million, it uses style two; if not, it uses style 1.” The only heavy lifting that is done is defining these two styles.
Using The Custom App In Different Ways
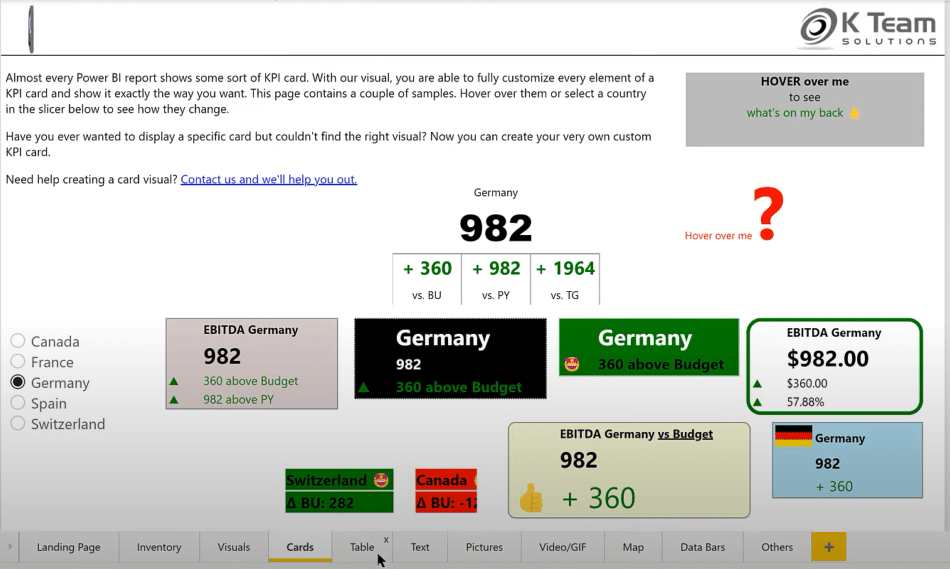
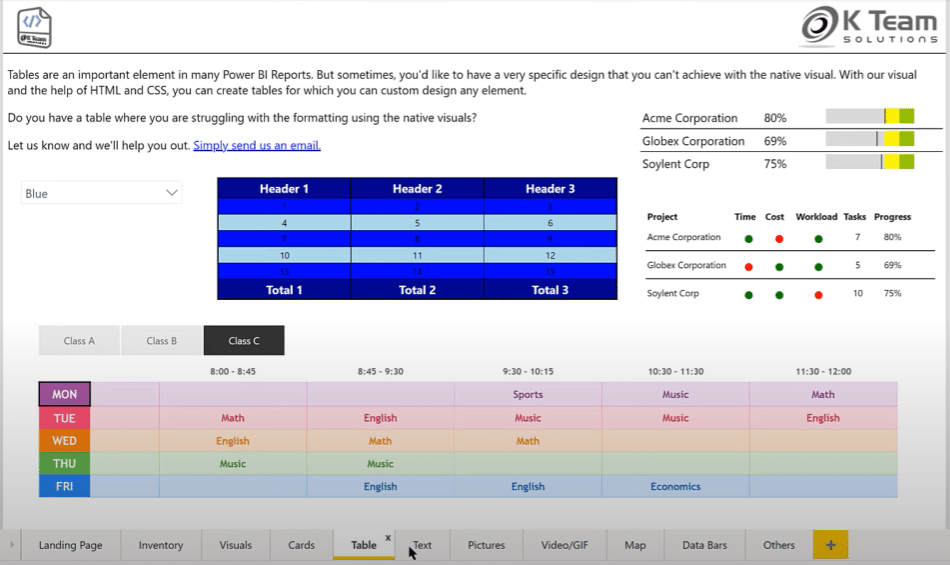
The app also comes with a very detailed report that shows you the many different things that you can do with this visual.
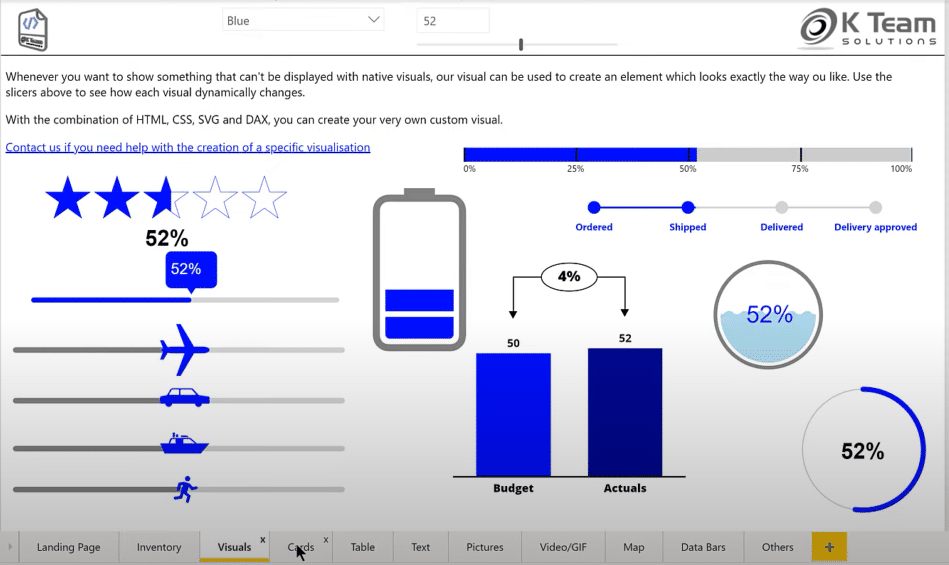
As I have mentioned earlier, here are the KPI cards you can do.
You also have the ability to create detailed tables when using this visual.
You can also create a text-dominated visual.
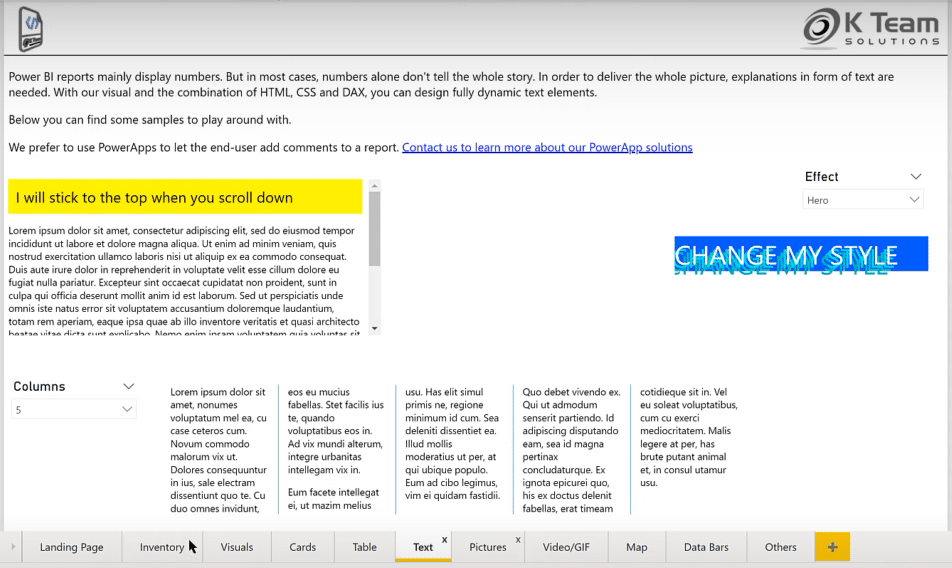
On the landing page option, you also get to use a text scroller with font and background options.

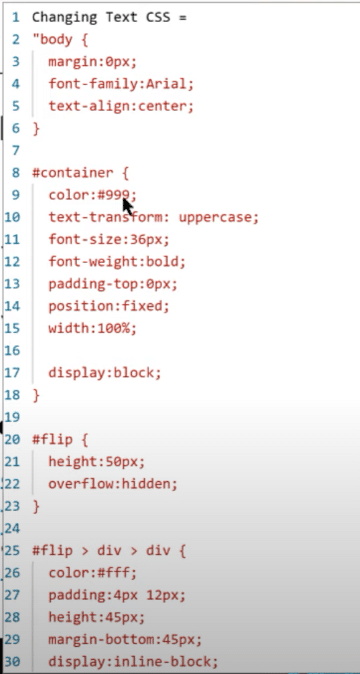
If we go through most of the Changing Text CSS code, it’s very intuitive. We can make changes on the font weight, font size, and font color.
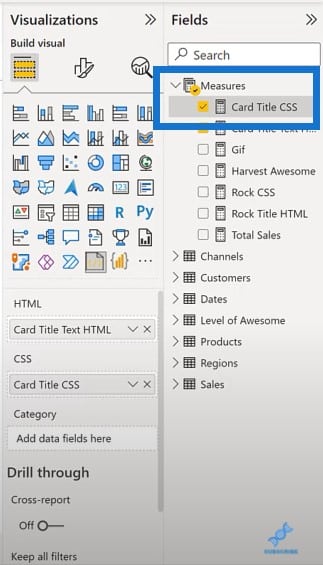
We can copy this into the template and then use it as the basis for the second measure. If we go back into our file, we have the Card Title CSS, which controls the formatting.
We pasted the code we copied so we have the blue color and the lightest font weight for Style 1. Then the same font in Style 2 with a red color and the heaviest font weight to create the bold effect.

We put this through the IF statement and depending on the value of the measure, it will choose the style. We’ll just take those two measures and then drop the HTML and the CSS into these slots.
With this technique, you’ll have the ability to easily format rich text attributes using HTML and CSS.
Adding Animation And GIFs To Your Report
Aside from the ability to use custom fonts, we also have the ability to use animation and GIFs. I came up with a simple measure where I used an HTML for the custom title.
And then I used this CSS file to create three styles with different custom fonts.
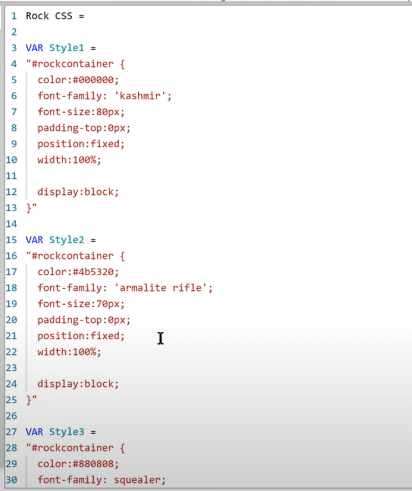
These are just true type fonts or open type fonts that I downloaded for free. The style is the default, which means nothing was selected in the slicer.
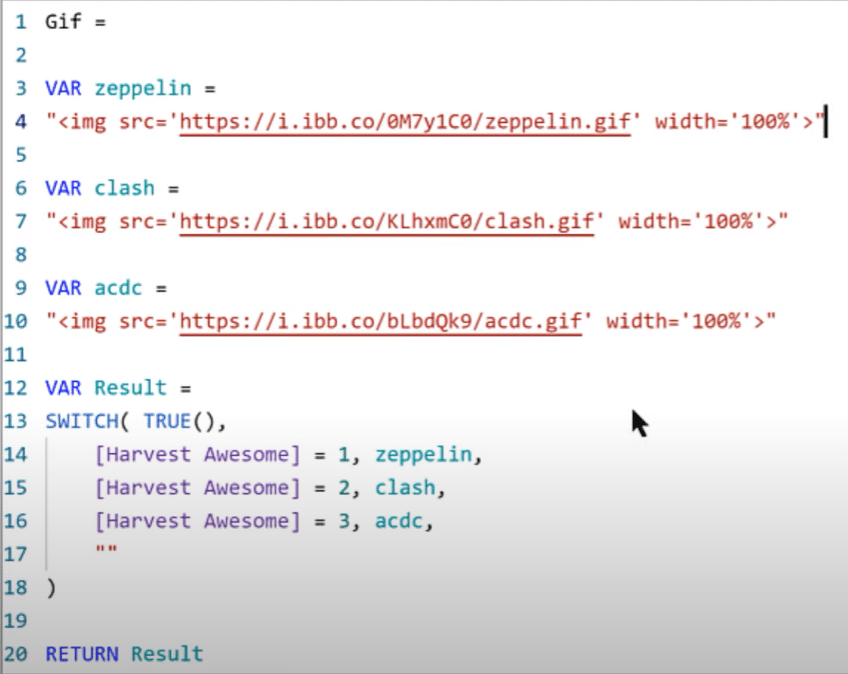
In addition to that, I have a GIF measure. I incorporated three GIF files that I uploaded to the imgbb site, then used the direct URLs and put them into the HTML tag using the format in the sample report for the HTML CSS visual.
Then I used a simple SWITCH TRUE measure to pick the right GIF. If nothing is selected, it just picks a blank.
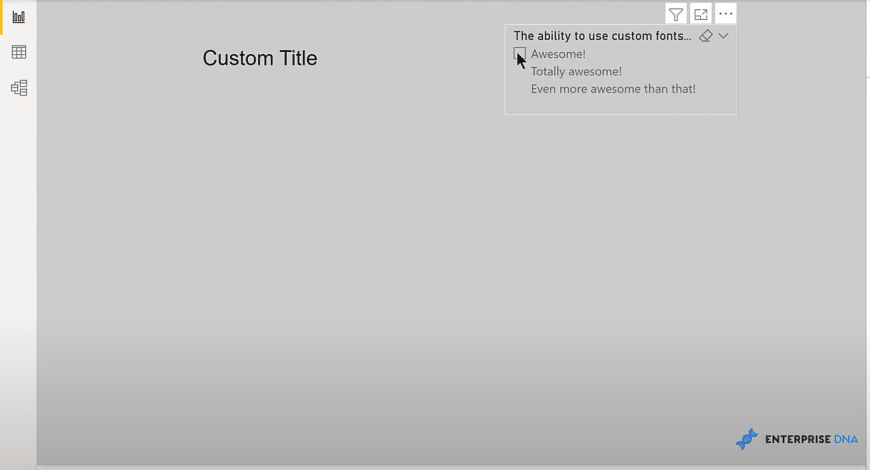
Here’s what it looks like with the blank and with nothing selected in the slicer.
And then if we make a selection in the slicer, this is what we see.
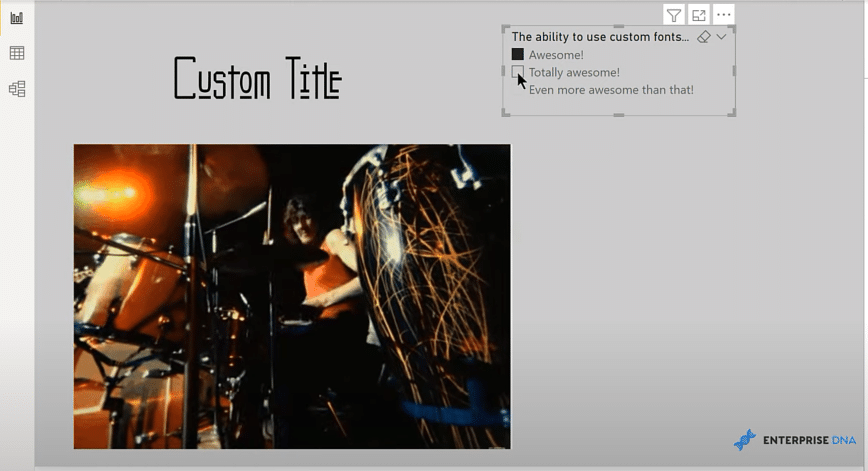
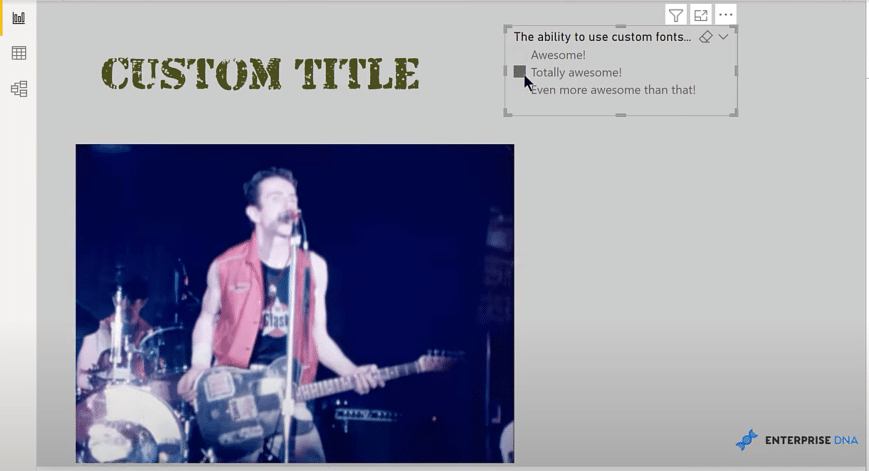
By using this custom visual, we can now select custom fonts. We can also add GIFs, and then make those GIFs conditional on slicer selections and DAX measures. These will change dynamically depending on the choice in your slicer.
There is one important limitation though. When you publish this to the service, the font has to be installed on the local machine in order for the user to see it.
If the font is installed on the local machine, it will be displayed properly through the HTML viewer when you publish it in the Power BI service. If the font is not loaded on the local machine, it will go back to the default font family.
***** Related Links *****
KPI Ticker In A Power BI Report
Make A Custom Visual For Power BI Using Deneb
Power BI Custom Icons | PBI Visualization Technique
Conclusion
The K Team Solutions’ HTML & CSS Viewer is a great custom visual in Power BI, and provides a customizable and interesting way of modifying the visuals in your reports. I definitely encourage you to download this app, and play around with it.
Also, don’t forget to subscribe to the Enterprise DNA TV channel. We have a huge amount of content coming out all the time from myself and a range of content creators, all dedicated to improving the way that you use Power BI and the Power Platform.
Lastly, check out Enterprise DNA’s website for more resources and further learning that you can access very easily.
Brian


