
Here, I’m going to show you how to calculate cumulative totals or running totals with no dates nor index columns. You may watch the full video of this tutorial at the bottom of this blog.
Somebody actually asked about this on the Enterprise DNA forum. The member who posted it encountered some quite complex algorithm running over some information that was required. There was a cumulative or running total requirement but there was no date to it and came across as just a random number generator. But we had to generate a cumulative total from the first result, second result, third result and so on and so forth. That’s the reason why I played around with a few ideas to try and find a solution.
It’s not easy and could get a bit complicated once you go into the formula, but the solution is dynamic and it’s amazing that it’s even possible. It’s something you can replicate across different environments where you need cumulative totals, or anything of the same nature.

Here’s the example that we’re going to work with today.
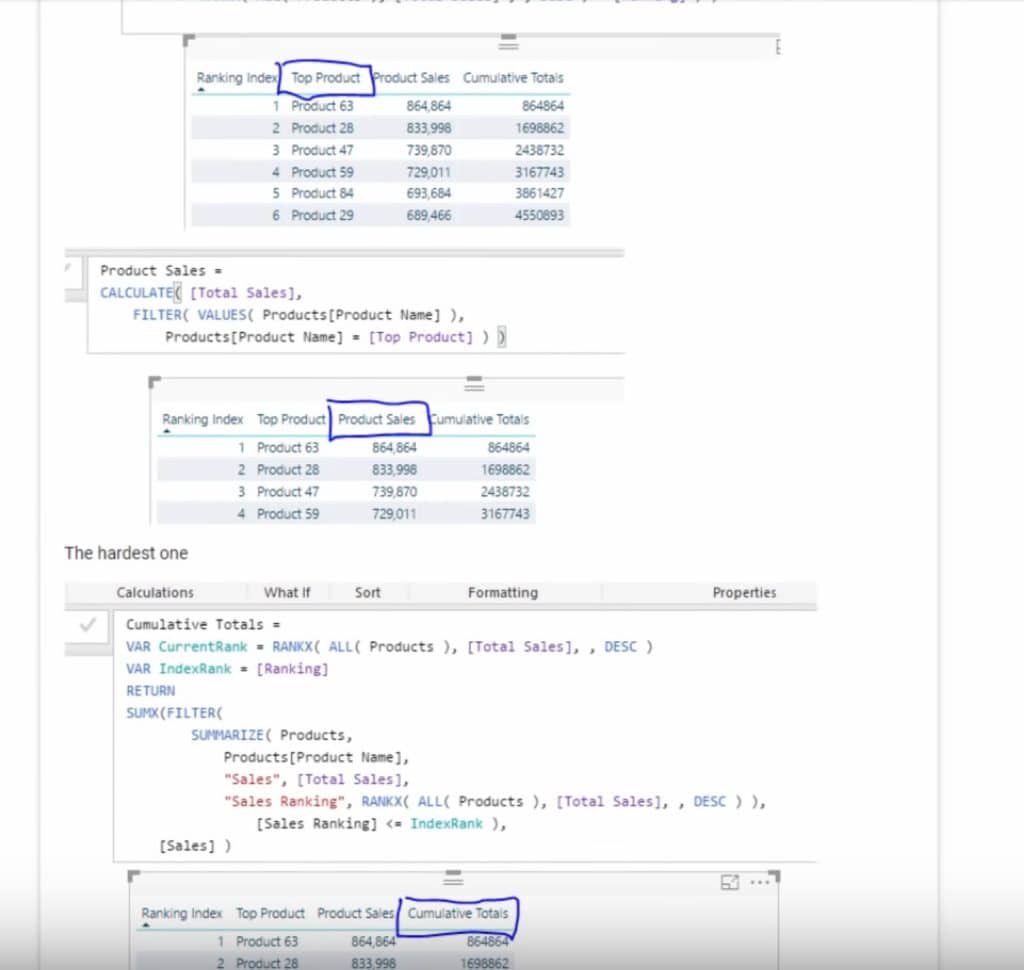
In this case, we have Total Sales where the numbers have been ordered from highest to lowest. We’re going after a cumulative total, so we want to see the total if rank one is added to rank two, then adding rank three onto that, and so on as you go down the table.
Note that in some cases, you could choose any visualization that works for you. You can, for instance, use a waterfall chart to achieve the results you want.
In our specific example, however, this kind of visualization does not really work.
Now, let’s get to the steps on how to get the cumulative total despite the absence of dates and index columns.

Creating An Index
I don’t think it’s possible to create a cumulative total from random values. So what you need to do first is to create an index. For this, I’m going to use the What-If Parameter because this will allow us to easily create dynamic index columns.
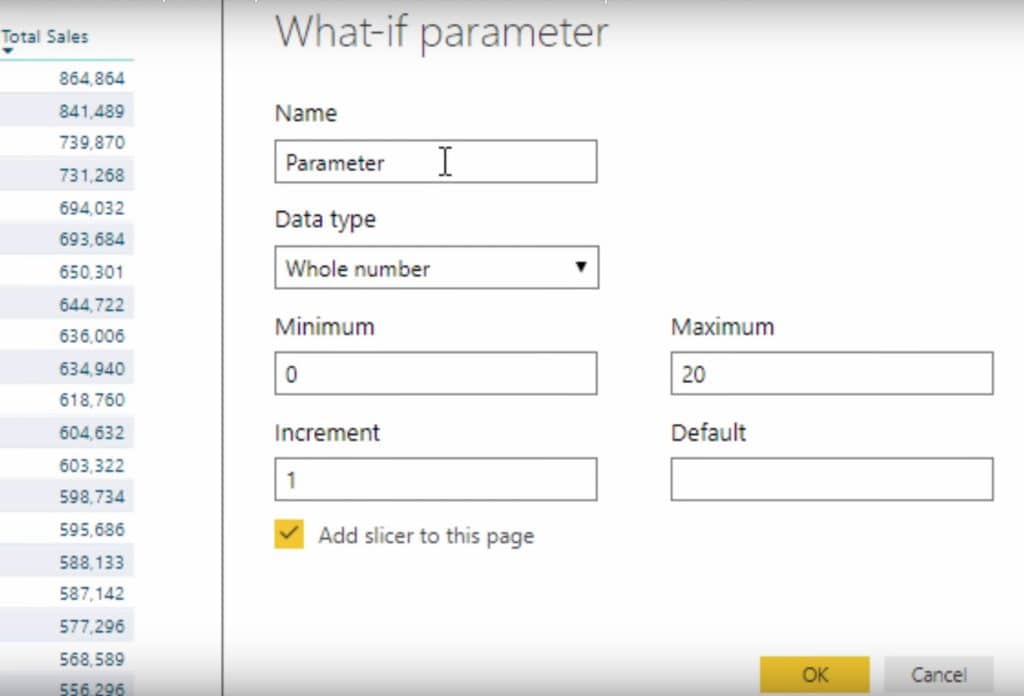
So I’m going to call this the Ranking Index. Let’s go with 1 to 200, with an increment of 1. There’s no need to add slicers to the page.
This step brings that index into our model. It’s not going to join up via relationship or anything similar. That’s just there to support us with some of the calculations that we’re going to do later on.
Creating A Table
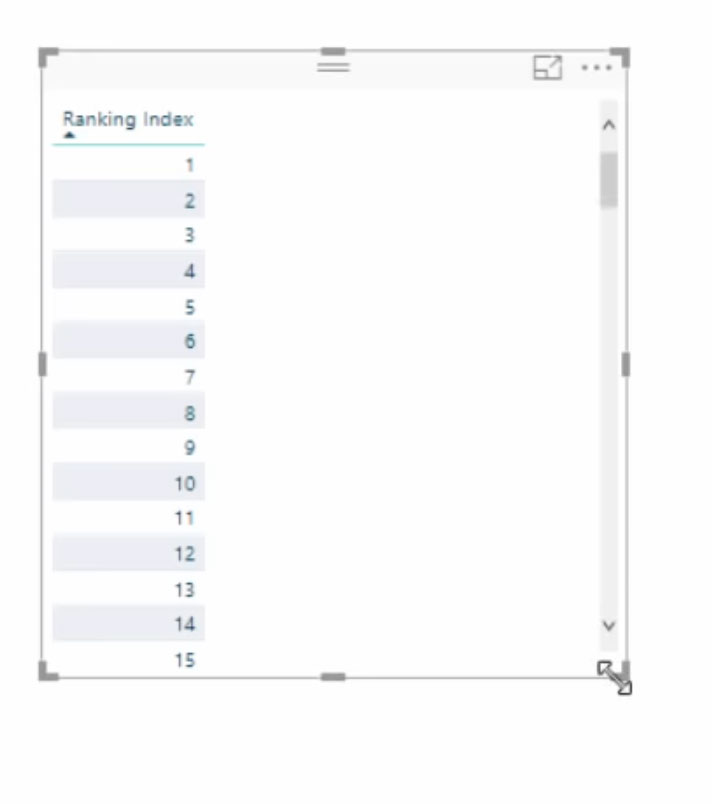
Now, I’m going to drag this into a table so that we can see the numbers from one onwards.
We actually want to create a result here that shows the values but is not actually a column. So we’re going to return a value within a measure. We’ll do that by creating another measure and call it Product By Ranking.
This is where the formula gets a little bit more complex, but still very doable.
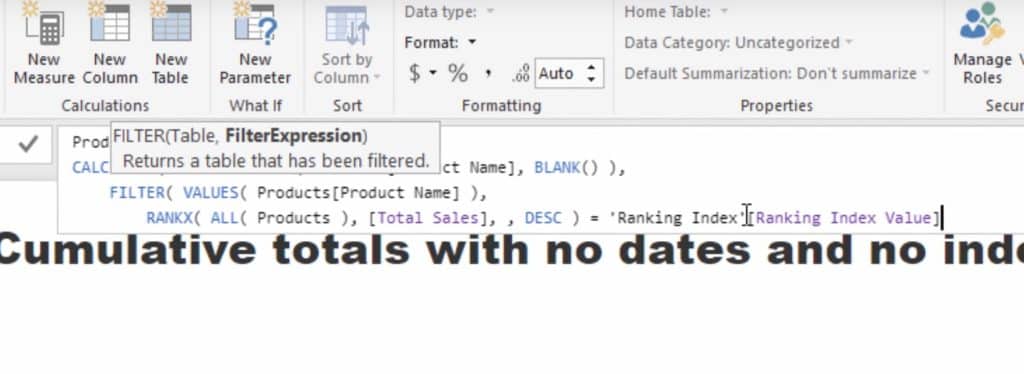
So we’ll utilize the CALCULATE function and then return with a text value. Then, we’ll go with SELECTEDVALUE, Product Name, and then use more than one value. Next, I’m going to use the VALUES function and FILTER by Product Name.
What we’re trying to go after here is the Ranking Index Value. So I’ll do a RANKX on all products, then go with Total Sales in descending order (because that’s how the initial table was filtered).
Because I’ve actually got a measure created, the Ranking Index Value is then automatically generated from the What-If Parameters.
Let’s bring this into the table. You’ll see that we actually return these results for every single rank now. So we’ve got both the Ranking Index, and now, Product By Ranking.

Replicating The Data
Now that we have a table showing us which products we have and how they’re ranked, we want to find out what the Total Sales would be for each particular product. To do that, we’re going to have to replicate the total sales from the old table into the new table.
This time, however, we’re not going to be able to utilize the automatic filter from our data model. We’re going to filter by an actual result in a measure.
To do that, we need to create a new measure which we’ll call Product Sales. So we’re going to calculate the Total Sales, then we’re going to create a different context with new filters. This means our formula will show us filtering the values by Product Name. Then, we’ll go on and create a filter for just a specific Product Name via this Product By Ranking that we just created.
Now, with this filter, if we look at product sixty-three, then we’re going to see the sales for product sixty-three. In other words, we’ve replicated the data while considering specific measures in this section.
Creating A Cumulative Totals
This time, we are going to create Cumulative Totals based on this Ranking Index. This is really going to show you how much you can utilize the different features and functions of Power BI.
So we’re going to create a new measure and call it Cumulative Product Sales. Just make sure you use the right variables here. For this example, I’m only going to use one just to keep it simple. I’ll call it Index Rank and reference the Ranking Index Value for it.
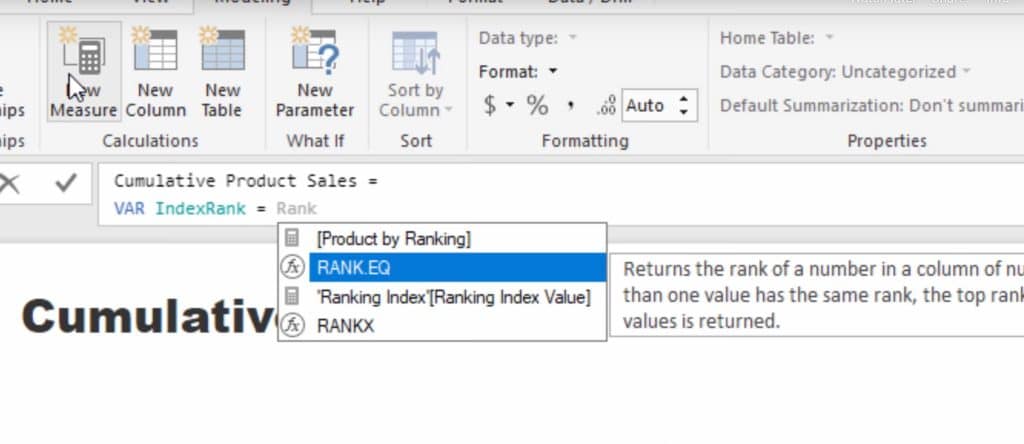
Looking at the formula below, you’ll see that it’s pretty complex. I utilized the SUMX function, did a filter, and then used the SUMMARIZE function on the products.
This will create this dynamic table that will allow us to actually look behind as we go through lines 1, 2, 3, 4, 5 and so on. So if, for example, we want the ranking result below rank 5. We’ll see that in the table with the sum.
You’ll also see that what we’re doing here in this particular table is we’re showing the sales of each particular customer. I also want to reference the sales ranking of that customer, so I’ve got to actually put in another RANKX, then go to All Products, then to Total Sales, and then Description.
Now the last thing we need to do here is filter this particular table based on whether the sales ranking is less than or equal to the Index Rank. Once we bring this into our table, you’ll see that this is actually now creating that Cumulative Totals for us.
***** Related Links *****
Create Dynamic Cumulative Totals Using DAX In Power BI
Running Totals in Power BI: How To Calculate Using DAX Formula
Compare Cumulative Information Over Different Months In Power BI
Conclusion
We’ve gone through some key learnings today and it’s really amazing how we were able to create all these new measures.
Basically, we were able to recreate the initial table virtually, allowing us to filter it depending on the data we need. So let’s say you need the sales ranking. You’ll see that below the index ranking here.
Another thing we did here is that we allowed this table to evaluate every single row or product. That’s exactly why this filter works. So we can just look at rows 1 through 5 and get the sales just for that particular table. And then we can expand it down to say 15 rows and then we’re counting up the sales of all of those 15 rows. We’re doing that dynamically as we move down this list, and that’s how we can continuously get a cumulative total.
Note that this solution can also be applied not only to cases where there are no dates nor indexes, but to other similar situations. Hopefully, you can find some unique example where this is required and find a way to utilize it.

***** Learning Power BI? *****
All Enterprise DNA TV Resources
FREE COURSE – Ultimate Beginners Guide To Power BI
FREE COURSE – Ultimate Beginners Guide To DAX
FREE – 60 Page DAX Reference Guide Download
FREE – Power BI Resources
Enterprise DNA Membership
Enterprise DNA Online


