
This tutorial will discuss the best practices in using calculated columns in Power BI. We’ll also be going through the DAX formulas used to create them.
In previous discussions, we’ve gone through how to write different measures in Power BI, but another technique we can use is to create calculated columns.
Other than measures, using calculated columns is a great way to get calculations done within tables.
Those who are used to using Excel are very familiar with this concept.

Excel Vs Power BI
In Microsoft Excel, we usually write formulas at the end of each column to get the result we want, which is most common when dealing with bigger data sets.
This concept can also be done in Power BI. However, there’s a better way to do this by using measures to run calculations.
It may be hard to adapt to this alternative method of calculation when starting out. But, we need to understand how measures work because these are what we’ll be using for most of our Power BI calculations.
Incorrect: Using Calculated Columns For Fact Tables
New Power BI users tend to use calculated columns within fact tables. To demonstrate why this practice is incorrect, let’s look at an example.
First, let’s create a new column.
Simply click the New column button under the Home tab.

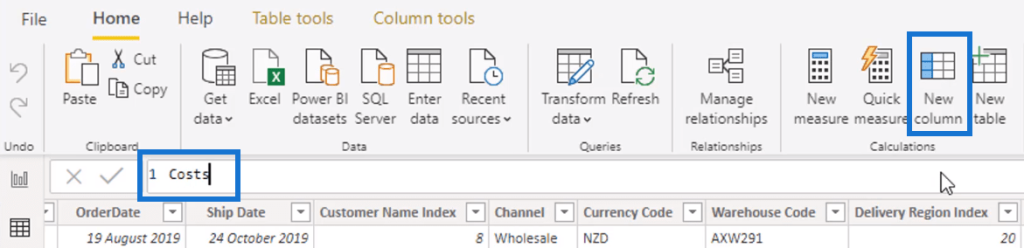
We’ll call this new column Costs.
We can see that we don’t have an existing Costs column in the table.
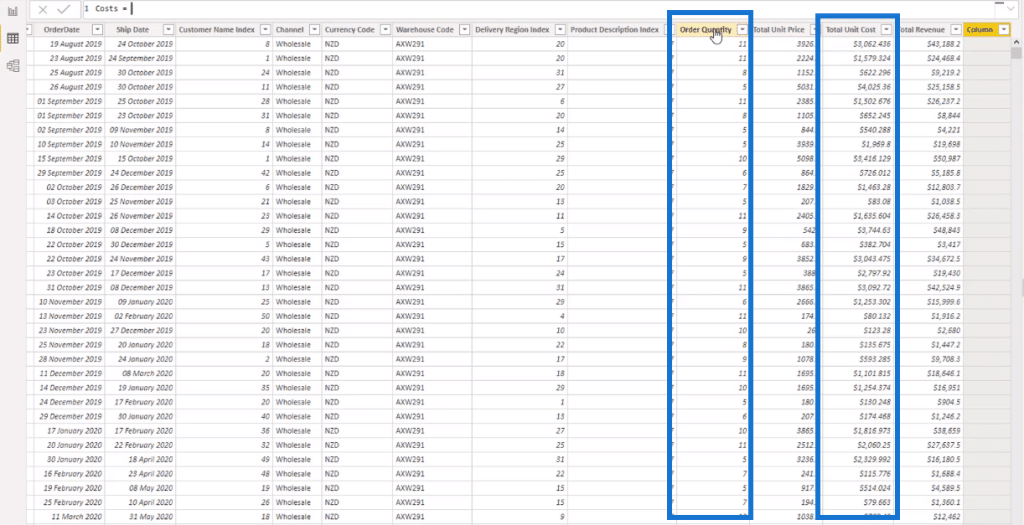
There’s only Order Quantity and Total Unit Cost. So, to get our Costs, we can reference these two columns.
We don’t need to put a SUM or other DAX functions in our formula since calculated columns work at a row-level.
To create a measure, all we need to do is reference the columns, Order Quantity and Total Unit Cost directly.

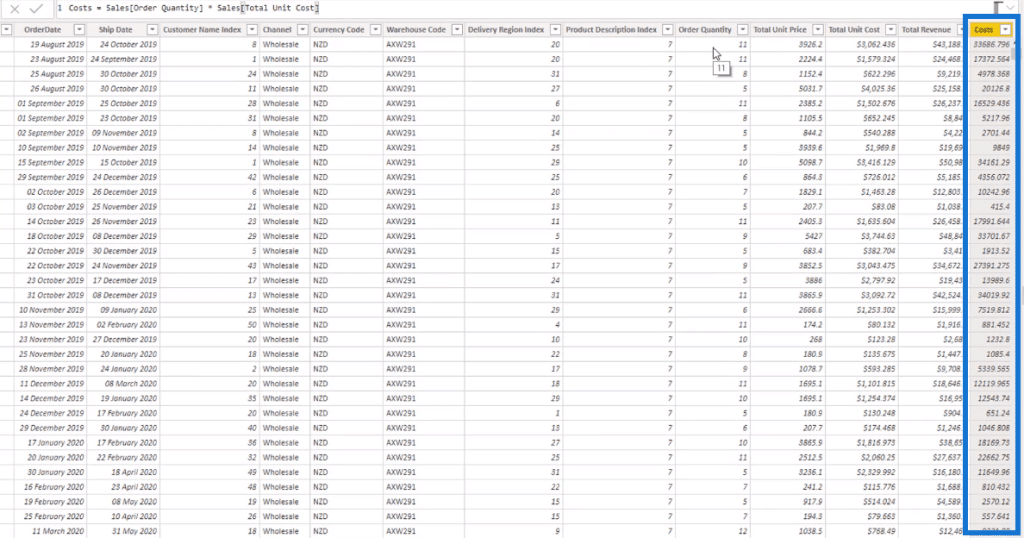
With this, the table will now show the result of Order Quantity multiplied by Total Unit Cost at each row under a new column called Costs.
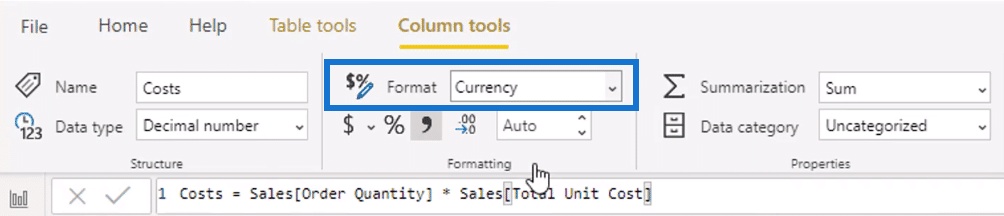
We then need to change this column’s Format to a Currency.
We can continue to repeat these steps for other measures we’ll be building into our model.
If we want a calculated column for Profits, all we need is to create a new measure. To get the value for Profits, we subtract the Costs column from the Total Revenue column.
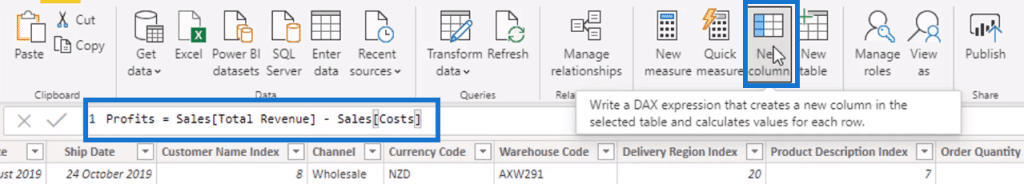
Again, the results for this measure will display under the new Profits column.
So, this is what new Power BI users tend to do to achieve these results. However, this is incorrect because the Sales table in this example is a Fact table.
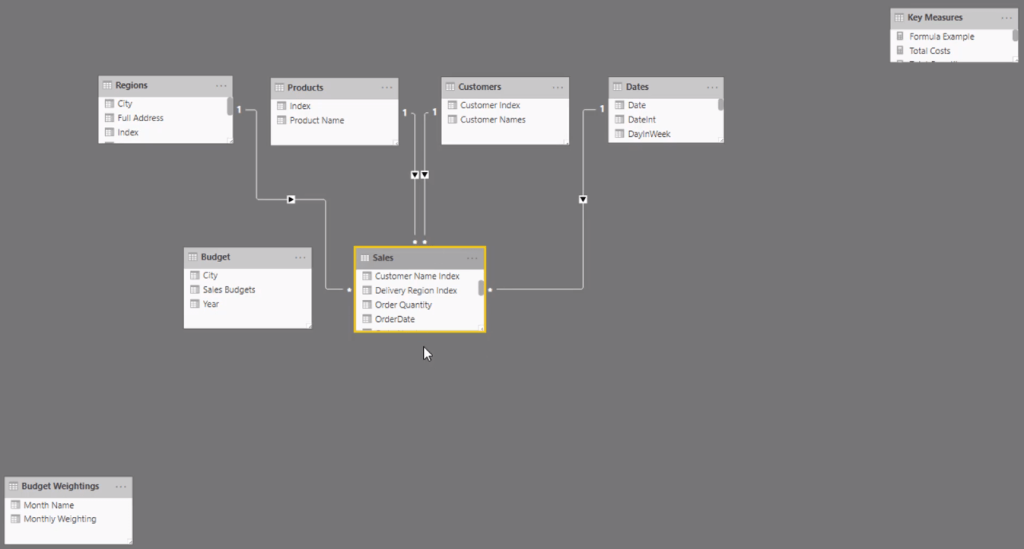
Calculated Columns shouldn’t be done inside Fact tables.
Correct: Using Calculated Columns In Lookup Tables
Lookup tables (such as, Regions, Products, Customers, and Dates) are preferable when we want to use calculated columns because they can be used with filters.
We’ll use the Products table to demonstrate this concept.
Let’s create a new column within this table called Sales.

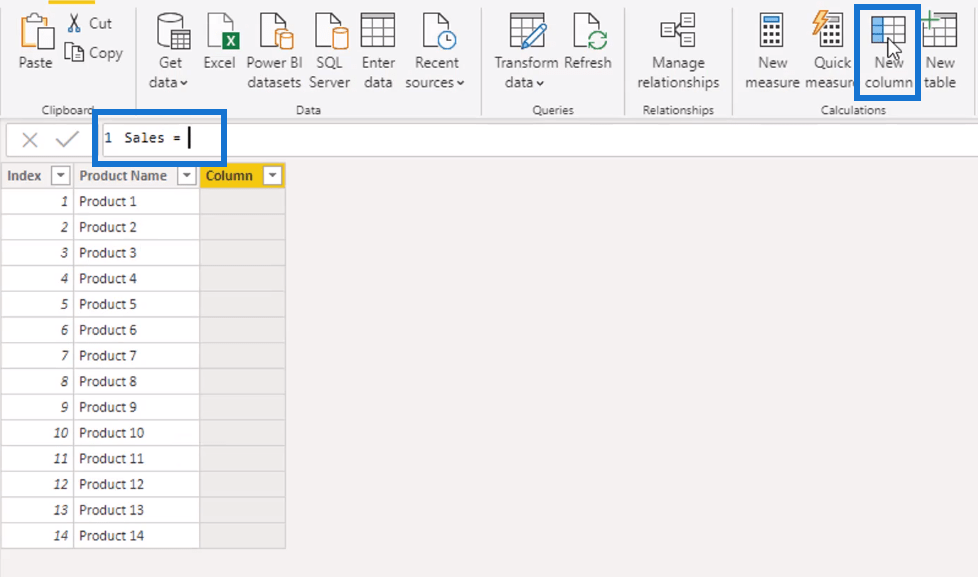
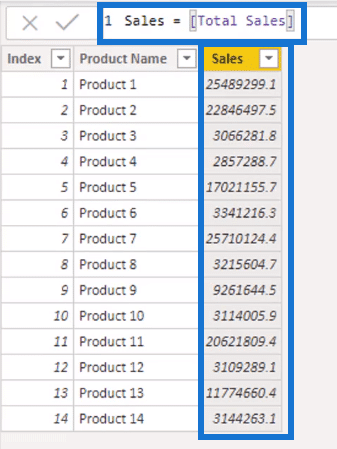
For this example, we already have a Total Sales measure. So, to create this new column, we only need to place this measure inside it.
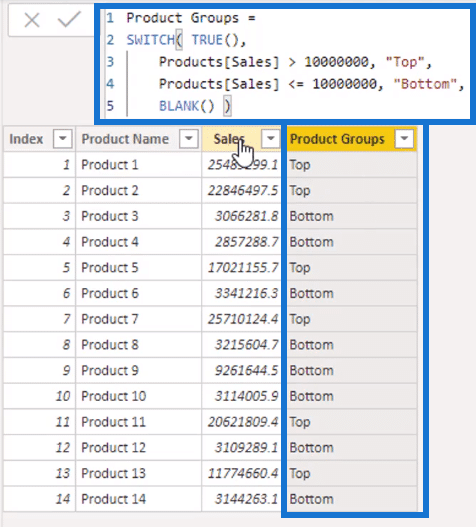
We can further group by products using calculated columns. Let’s call this new column Product Groups and then type in a SWITCH TRUE statement in this formula.
SWITCH TRUE is similar to using a nested IF statement.
Then, we type in the argument. If the Sales column is greater than 10 million, it will equal to “Top”. Otherwise, it will be equal to “Bottom”. Lastly, place a BLANK at the end.
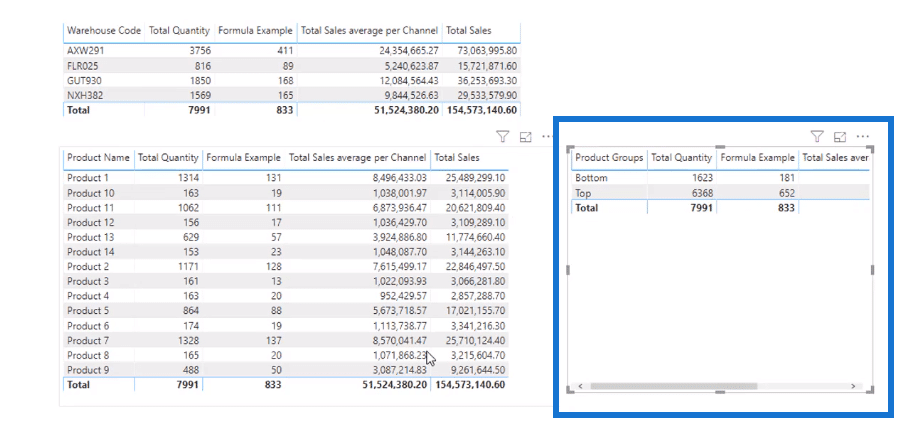
Once we’re done with building the measures and calculations, we can proceed to adding filters and dimensions to the data in our reports.
If we want to look at the Top and Bottom results, we can show the Product Groups column as a visualization in the report.
Calculated Columns Vs Measures
Calculated columns are better to use when dealing with small calculations.
When we have big calculations within our bigger tables, such as our Fact table, we need to use measures.
Measures allow us to create virtual calculations instead of applying them directly to a table; virtual calculations provide greater insights.
Some Fact tables can have more than a million rows. So, if we choose to use a calculated column, it’ll take up a large space within our models
Calculated columns can create many data points in our Fact tables that we don’t need.
If we use a measure instead, results can be virtually run. And all we have to do to make them appear in our report is to drag them in.
But on another note, values in calculated columns automatically refresh and recalculate together with the report. But because they are linked to the rows within Fact tables, reports with multiple calculated columns usually experience issues and delays.
Measures, however, only perform calculations when they’re used in reports. They don’t take over any space in the model if they’re not being used.
Thus, Power BI users will mostly utilize measures.
***** Related Links *****
Filtering Data By Custom Fiscal Years And Quarters Using Calculated Columns In Power BI
See Changing Results Using Calculated Columns In Power BI
Comparing Calculated Columns And Measures In Power BI
Conclusion
Applying this best practice tip will greatly improve the functionality in our reports.
We need to have a good understanding on how and where measures and calculated columns should be implemented in our Power BI models in order to fully maximize their potential.
Experienced Power BI users know that measures are the go-to when in creating Power BI reports. However, we also need to remember that calculated columns are better for building data models and creating insights within reports.
All the best,

Sam


