For this tutorial, I’ll show you how the apps in Power BI Online Service can help you in managing reports and insights from various sources. You may watch the full video of this tutorial at the bottom of this blog.
I’ll share with you how to manage these Power BI Apps so you can fully utilize and integrate them into your reports and dashboards to create a maximum impact.
I’ll demonstrate how to maximize your experience in terms of distributing information throughout your organization.
Power BI Apps
Microsoft has undergone many improvements within the Power BI Online Service. Finally, it has landed on the most effective and most suitable tool to consolidate information effectively. Now, the information can reach the key stakeholders very quickly using these apps.
The apps available in Power BI have a simple workflow that enables you to work around the online services easily. It helps you navigate to the key consolidated information within your organization.
Using Apps To Maximize Your Power BI Online Service
For the time being, you can only create one app per workspace. I’m confident that Microsoft will be able to allow the creation of many different apps soon. It’s important to consider that because some people work in different areas within a business. Thus, it’s very useful if you can create different apps for different people depending on the stakeholder of a certain team.
Now, let’s take a look at how to create an app for a workspace.
If you don’t have an app created in a workspace, you can see the Publish App button.

However, if you have an existing app in a workspace, you can see the Include In App options.

This is where you can turn on a certain element in the dashboard and reports areas, for example, to be included in the app. It’s very easy to add or take out certain reports that might be inside a particular workspace and place them into the app.
You can place them in the centralized app, which consolidates all the key information or key reports in one workspace. When you bring them into a central application, you can easily distribute it to any management group or senior leaders or stakeholders who might be interested.
In the past, it gets really messy when someone comes in who’s not familiar with these reports. They get overwhelmed by the reports that are being shown to them. That’s the reason why it’s always better to place these reports in an effective and organized way. You can easily turn these things on or off inside your app depending on the need.
To do this, just click Update App to open your app into an intuitive page where you can set it up.

On this page, you can rename your app and edit the description. You can also place a support site and even add a logo.
In addition to that, you can choose the color themes for your app.

In the Navigation tab, you can manipulate the navigation of your app.
For instance, you can move around the various dashboards inside your app based on how you want it to show. You can see these dashboards the second after you access your app so it is important to arrange them accordingly.

The best thing this app can offer is the way you can consolidate the key insights for a specific user. This is definitely a great innovation from those times when you have to consolidate information using PowerPoint or Excel. You can quickly get things done by utilizing this new feature inside Power BI Online Service.
As I have shown, you can change a lot of things and update your app. You can also use this web link to directly access the app. I hope some of you are already using this feature.

Sample Dashboards Inside Power BI Online Service App
Take a look at my sample app here.

I don’t only have the said dashboards, but I can easily navigate to the key parts of my reports.
For instance, if I want to check my account receivable information, I’ll just have to click the Accounts Receivable Reconciliation report.

Within the same page, I can see the specific insight that I need. I can click on whatever insight or results that I need to look for in this report. This is just one of the many accessible reports that I have inside my app.
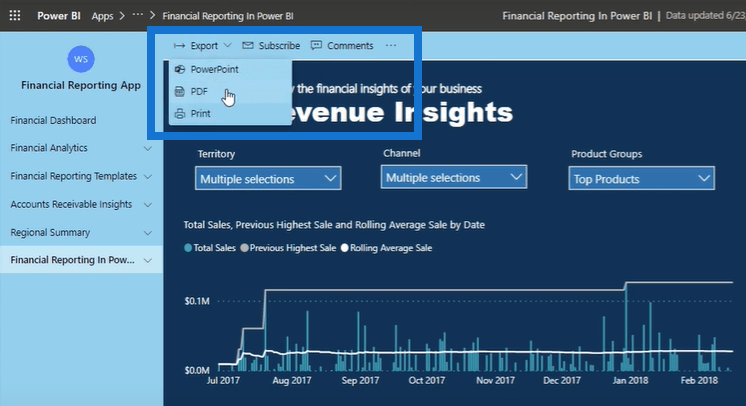
Another example that I want to show is the Revenue Insights dashboard. I can easily review the data inside this report and look for the revenue data that I need.

You can also export this dashboard. Just click Export, and then you can export the report in PowerPoint, or PDF or print.

Aside from that, you can create email subscriptions and add comments. These are little updates that are centered around the app functionality. These things really take Power BI Online Service to the next level.
***** Related Links *****
Power BI Reporting Techniques: Setting Up Application Like Reports
Power BI Mobile Reporting Tips And Techniques
How To Create Compelling Reports & Dashboards In Power BI
Conclusion
Microsoft did a really good job in ensuring that there’s a way of managing the Power BI Online Service effectively. In terms of impact, this is one of the best updates so far.
It’s really exciting to know the direction they’re going with this. You can even see that this update integrates really well into the Microsoft Suite. There are more ways that this feature can be extended such as in Outlook or Microsoft Teams.
I hope you utilize this feature inside Power BI Online Service. You can incorporate this into your analytics program and establish a data culture within your teams.
Cheers!
Sam


