
In this blog post, I will be diving into a relatively specific insight by conducting a Power BI trend analysis. By walking through exactly how I got there, you will learn so much about what you can do with Power BI and DAX. I really dive into this concept of measure branching, which I love implementing. It’s about layering measures one on top of the other until you get the desired result. You may watch the full video of this tutorial at the bottom of this blog.
This is a truly powerful technique because you can work your way up to any calculation and still have the workings of the data model to enable filtering of your data.

Power BI Trend Analysis on Product Margins
We are going to do some trend analysis on something very specific like product profit margins. We will find out if profit margins expand or contract through any space of time. This is relevant if you want to look at the performance in the last two to three months of a particular set of products. You want to know if these are selling well and you are expanding the margins as expected. You also want to know if demand has dropped off, or competition is high, and the margins have contracted.
Getting Profit Margins
Here is a technique that you can use to actually discover profit margins and visualize them in Power BI. First of all, we need to get the profit margins calculation. In the current data model, we will start with the Total Sales transaction, but we also want to get Total Profits. To achieve this, we get our Total Sales and deduct Total Costs using the SUMX function.

The next step is to add a new measure and call it Profit Margins where we will divide Total Profits by Total Sales.

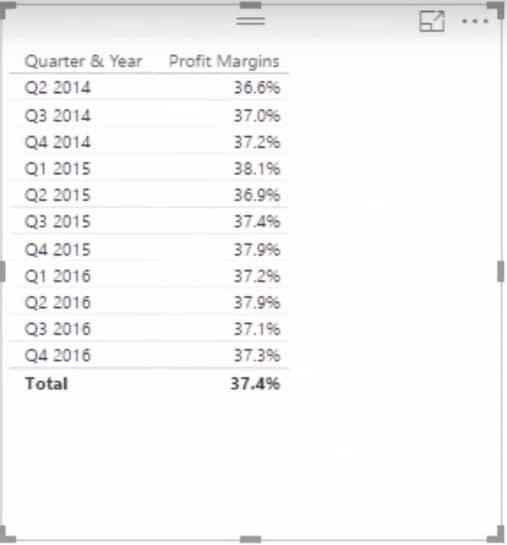
Because we are looking at this from a quarterly basis, let’s grab our Quarter & Year as well as the Profit Margins into the canvas.
Getting Overall Profit Growth
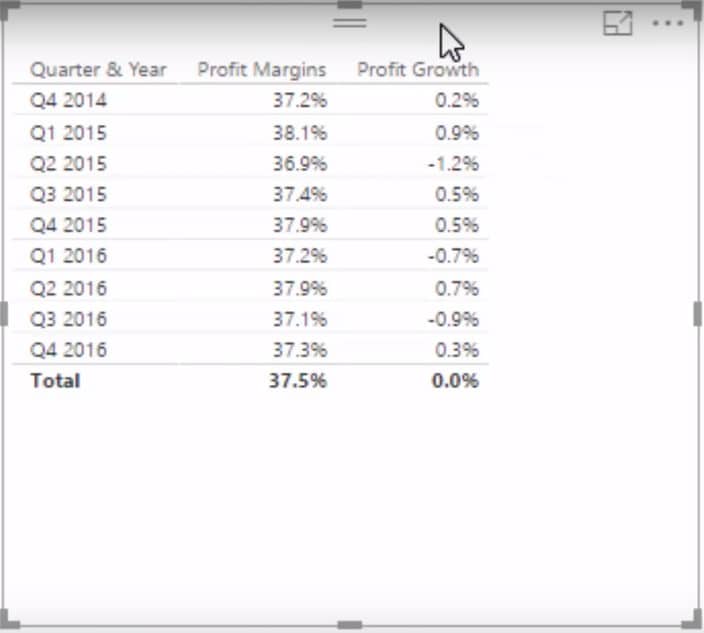
We have the Profit Margins in our table, but we also want to see the Profit Margin Growth per product. First of all, we have to work out what the logic is and pass it into the correct context to get the answer that we want. We are going to create a new measure and call it Profit Growth. We’ll use our Profit Margins and then deduct the Profit Margins from the quarter before using the DATEADD function.

Once we drag the Profit Growth inside the table, it will now reflect the growth, whether it is expanding or contracting. That’s pretty cool, right?
Getting Profit Growth By Product
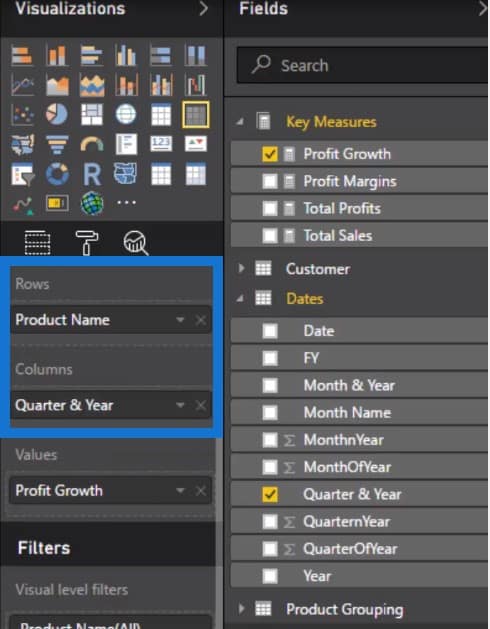
But now we want to see the numbers from a product-specific perspective. We already have the logic inside the table; all we have to do now is change the context. So we are going to create a matrix, get rid of the Profit Margins, and find the relevant dimension which is Product Name. We’ll put it in Rows, while putting Quarter & Year into Columns.

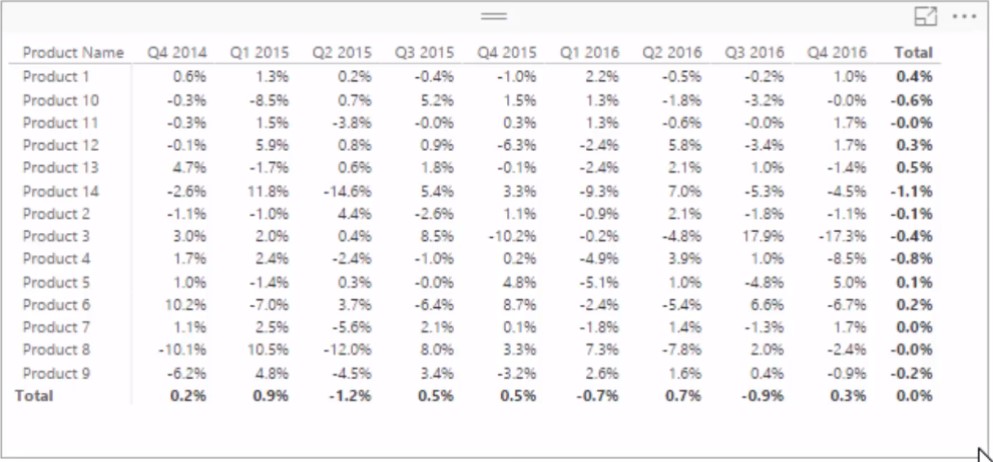
Now that we have the Profit Margin Growth, we can clearly see the expansion and contraction on each of the quarters, and easily spot trends.
Identifying Trends Using Conditional Formatting
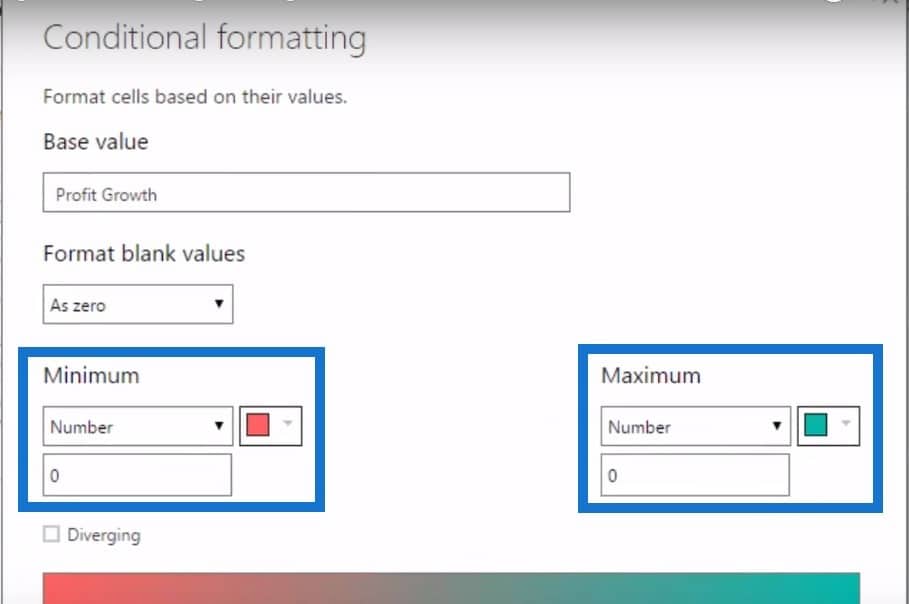
To make things more visually interesting, we click on Conditional Formatting, enter a number on the Minimum and Maximum fields, and assign a colour to conditionally format the cells in this table.
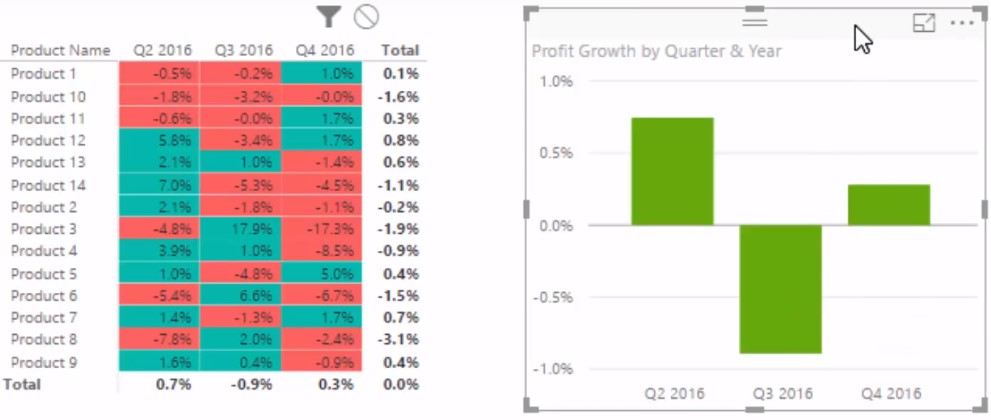
Looking at the table below, we can now see if these trends are for expansion or contraction. This, in itself, is a pretty good insight. If you have overlaid this on some real-world information, and if there was a reduction in demand or an increase in competition, you will see a lot of reds in a particular row. This would be a cause for concern, something to discuss with your staff, and take action on.

Determining Why Profits Expand Or Contract
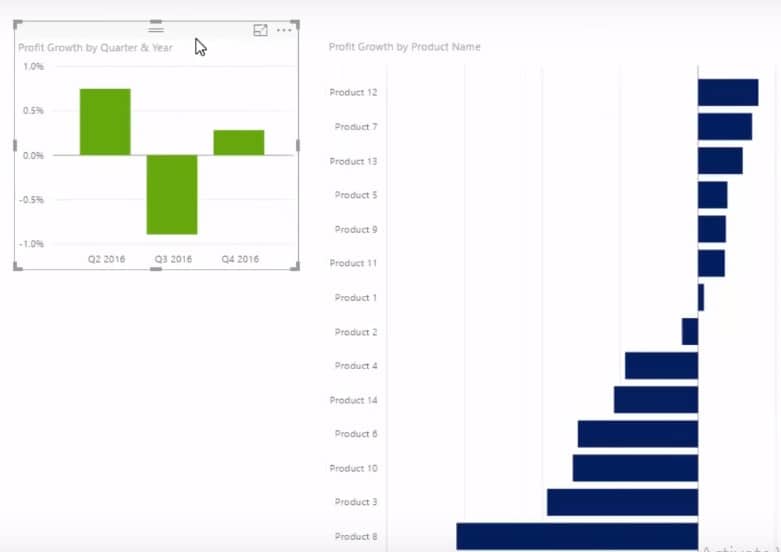
But why did some of the numbers expand or contract within any of the time frames that we discussed? Let’s drill into why it actually happened. The first thing to do is copy and paste the existing table, get rid of the product name, and turn the second table into a visualisation. Now we are able to see from a quarterly basis what actually happened to the portfolio in its entirety.
We can also find out what actually happened to each different product so we can quickly see what is contributing to the growth margin or detracting from it.
Getting Individual Transactions
The last thing we can do is to see the individual transactions. We can start with the summary layer and discover if there is a trend. Then we can look at the underlying data and see what specific customers or what specific sales in specific regions have caused this trend.
So what we are going to do is create a new table with some information from a range of tables in our model.
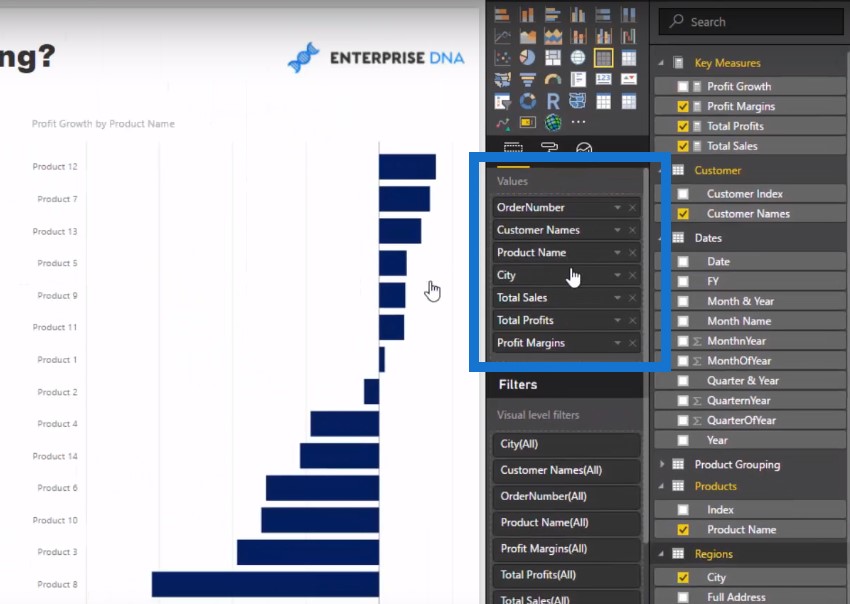
Now that we have all of our information aligned, we can clearly see the big picture. For example, our profit margins contracted by almost 1% in Q3, so let us go ahead and select that.

We can look at the table and see that for a range of reasons, Product 14 experienced the biggest lost. When we click on Product 14, we can look at every single transaction at whatever date, see which region they were sold to, and so on and so forth.

***** Related Links *****
Calculating Percent Profit Margins Using DAX In Power BI
Analyze Margin Changes Overtime – Analytics with Power BI and DAX
Measure Branching – The Most Important Concept When Using DAX In Power BI
Conclusion
In this tutorial, I start with sales, then move to calculating profits. I also work in some time intelligence calculations and then branch out even more. By combining these techniques in the data model, we are able to explore things like margin contraction or expansion.
Doing a Power BI trend analysis is a great insight for business and is a key indicator of sales performance across a range of industries. It may not be the only insight you look at from a results perspective but it certainly will add some color as to why you’ve got the performance outcomes you have obtained. It’s a bit like performance attribution. Maybe your profits are lower, not because you sold less, but due to your margins contracting thanks to competition.
This is just one example of the many compelling ways to discover new insights which can generate a lot of value and discussions within organisations. To learn more techniques check out my Solving Analytical Scenarios course. This is where I cover many of these types of applications at length.
Good luck implementing this one.
[youtube https://www.youtube.com/watch?v=fnEHEhUqlw8?rel=0&w=784&h=441]


