In this tutorial, we’re going to focus on some customer attrition analysis in Power BI. You may watch the full video of this tutorial at the bottom of this blog.
Power BI is an amazing tool for high-quality analytics. In my view, it doesn’t have a close competitor at this point in time.
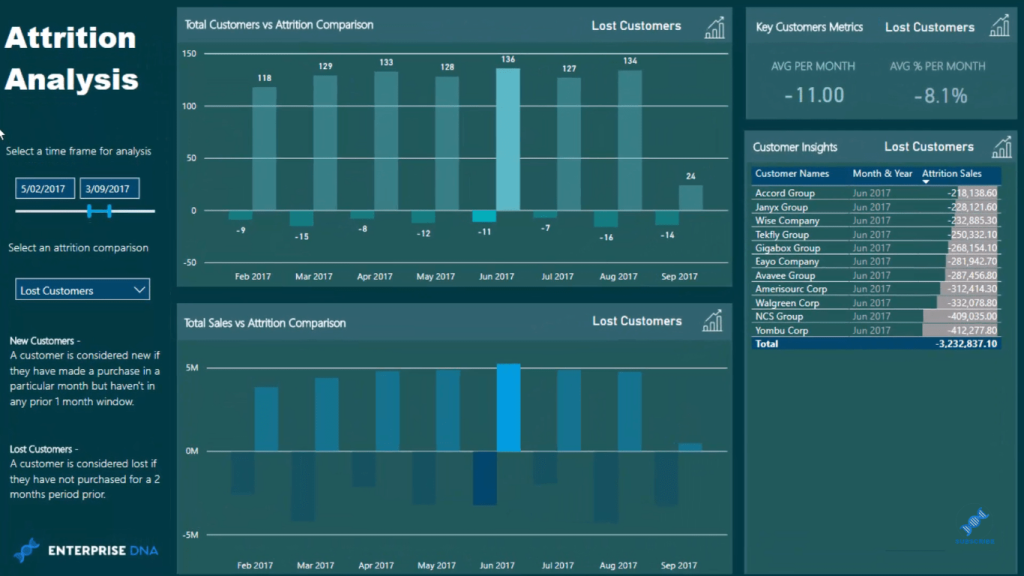
The dashboard we’re using here is part of the Learning Summit I had on attrition analysis, but this tutorial focuses on finding our lost customers.

In this demo, we will find out who our lost customers are and we’ll see the total sales lost from them.
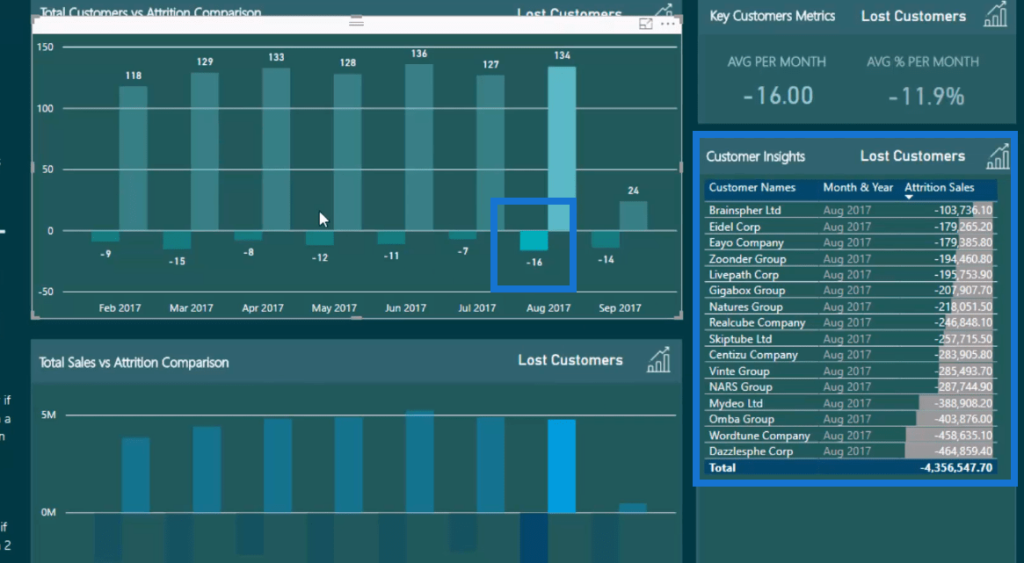
We’ll dynamically drill down into those customers and extract some great insights. We can click a certain number, for instance -16, and we’ll see who these 16 lost customers are and the revenue that we lost from them.

We apply complex DAX formulas to achieve this powerful attrition analysis inside Power BI.
In this example, a lost customer is considered to be a customer that has purchased something in the last 10 months but not the last 2.
How To Create Attrition Analysis Report
We need to find a list of our customers who purchased in the last 2 months or 60 days, and a list of customers who purchased in the 10 months before that.
Then, we’ll compare these tables of customers and see which customers don’t exist in the table from the last 2 months but did in the past 10 months prior to that.
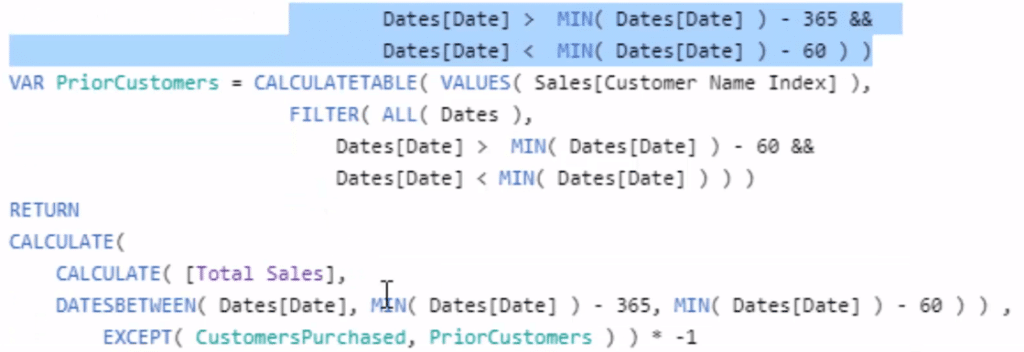
And that’s what this particular formula is doing. The CALCULATETABLE function enables us to do that in any particular month.

So we’re creating virtual tables and CALCULATETABLE is a perfect function to use because it’s very similar to CALCULATE where you can change the context of a calculation. But in this case, we’re changing the context of a table (Customer Name Index).
It shows us a list of customers who purchased between 365 days ago to 60 days ago. That’s going to give us a 10-month window and also a list of those people that purchased something in those months.
We do exactly the same for the second variable PriorCustomers, but we based it on the last 60 days from the first day of the month. So we’re looking at 2 months back not at the current month.
The COUNTROWS show how many of these customers purchased in the period before (CustomersPurchased VAR), but didn’t purchase in this particular period (PriorCustomers VAR).
The EXCEPT function is going to return another virtual table of just the customers whom we consider to be lost customers. And we’re going to multiply it by -1, and that’s how we get the particular number here in the chart.

Who are these -9, -15, -8, etc. customers? We need another formula to get this list of customers.
Showing Lost Revenue From Lost Customers
To show the list of customers whom we considered as lost, we use the same virtual tables in the Lost Customers formula. The difference is that we are trying to calculate an amount — how much do we actually consider lost?


The CALCULATE function here brings a value into this table and we’ll blank out every other value. We’re not showing all the customers who we’re not considering lost. All we’ll see are the sales amount of customers who we’re considering lost.

So instead of going COUNTROWS EXCEPT, we use the variables as some context inside of a CALCULATE function. Then, we work out the Total Sales between the time period we identified using the DATESBETWEEN function.

***** Related Links*****
Discover How Many Sales Can Be Attributed To New Customers – Advanced Power BI Insights
New vs Existing Customers – Advanced Analytics w/DAX
Counting Customers Over Time – DAX Example in Power BI
Conclusion
This is quite an advanced topic, but it’s a very interesting aspect of attrition analysis. I hope you can see how powerful this analysis can be and how it can improve your decision making within your organizations.
Not only can you see high-level numbers, you can also see the granular information. This is going to allow you to make decisions around resourcing, marketing, and advertising, etc. to your very specific customers.
There are a number of advanced functions and techniques to go over in this particular tutorial. Explore the CALCULATETABLE function, which is a regularly used function and an essential one for more of the high-level analytics.
I highly recommend exploring this one more and trying to understand all the different aspects of this piece of analysis. A lot of the ideas and concepts are reusable for other high-level and advanced analysis that you can do inside Power BI.
I hope you enjoy exploring this topic more!
Sam
***** Learning Power BI? *****
FREE COURSE – Ultimate Beginners Guide To Power BI
FREE COURSE – Ultimate Beginners Guide To DAX
FREE – 60 Page DAX Reference Guide Download
FREE – Power BI Resources
Enterprise DNA Membership
Enterprise DNA Online
Enterprise DNA Events


