Here I’m going to show you how to use the function AVERAGEX with DAX in Power BI. You may watch the full video of this tutorial at the bottom of this blog.
By learning and understanding how to use this function, you very quickly open up a range of analysis that can be incredibly insightful and valuable.
Maybe you want to work out the average sales you make per day, per month, per customer, and so on. There are so many applications for this that it’s crazy.
And don’t forget, you can then branch out into time comparisons and time intelligence analysis.
In this example, we’re going to work with something that can be easily applied in almost any model. We’re going to calculate the average sales per day for particular customers using AVERAGEX with DAX.
Reviewing The Data Model
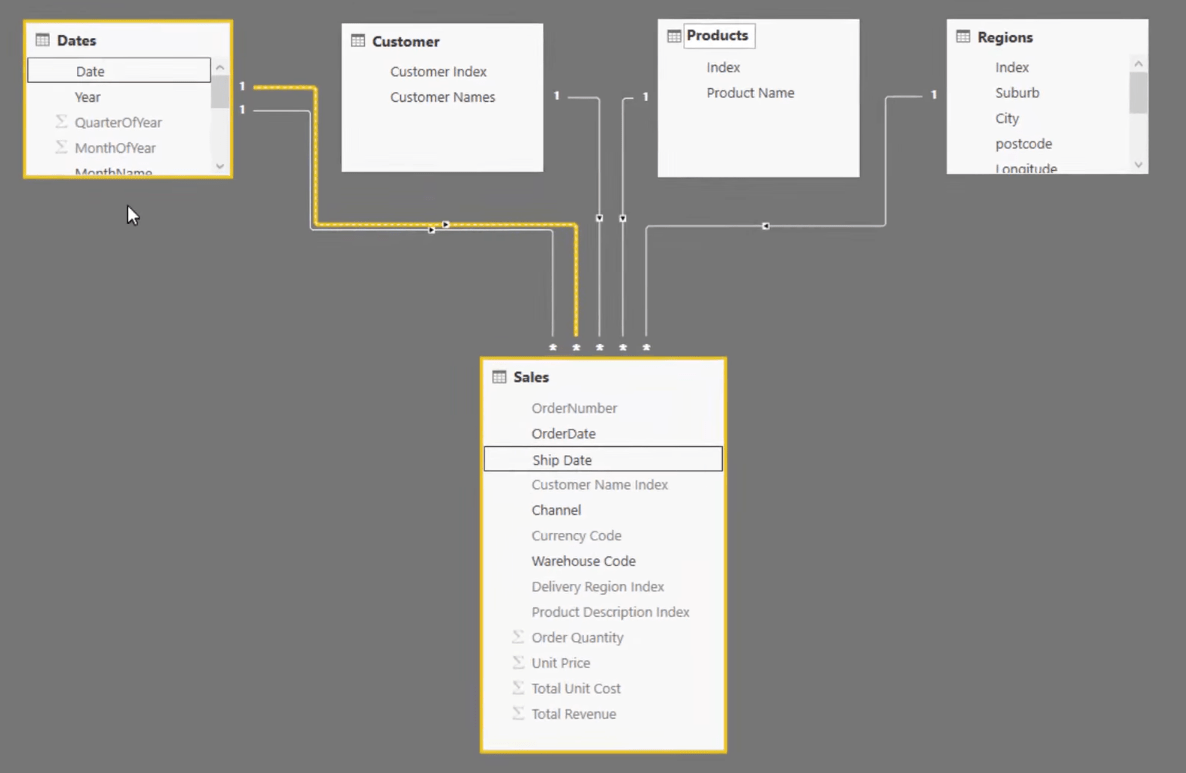
Before we actually calculate our average sales per day, let us first take a look at our data model in Power BI so that we can have an idea what we are working with.
So, we have an organization that is making sales and the data is in the sales table.
This organization makes sales on any particular day and the data for this can be found in the dates table.
They are selling to any particular customer, different products and they can sell in a range of different regions. The data for these three can be found separately in the customer table, products table and the regions table.
Using the information from our data model and the measures already available, let us analyze our total sales by customer.
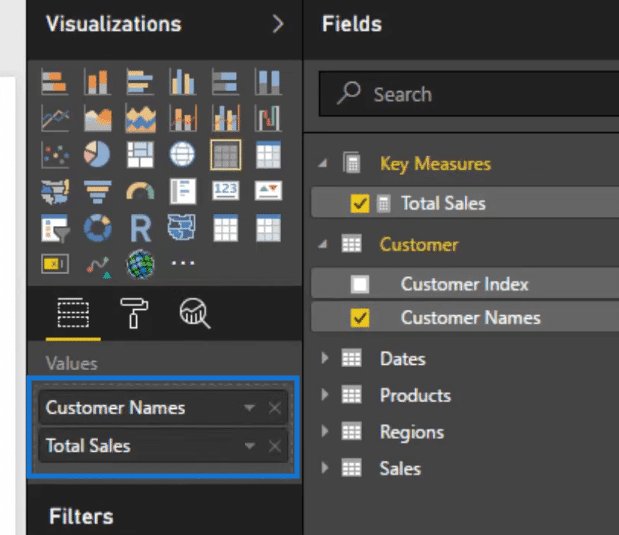
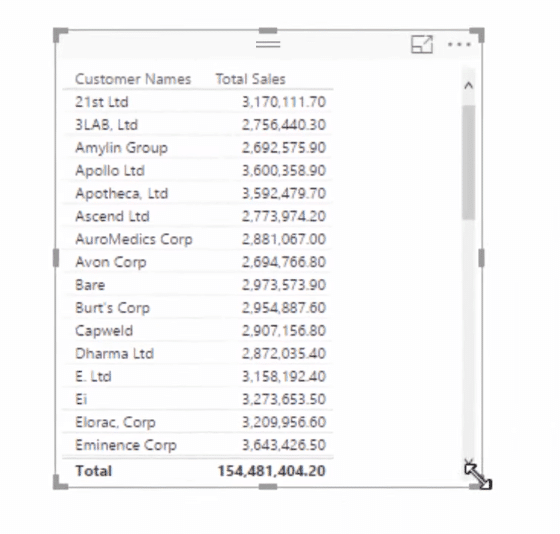
Our table will look like this one below. So we have total sales and they are arranged by customer names.
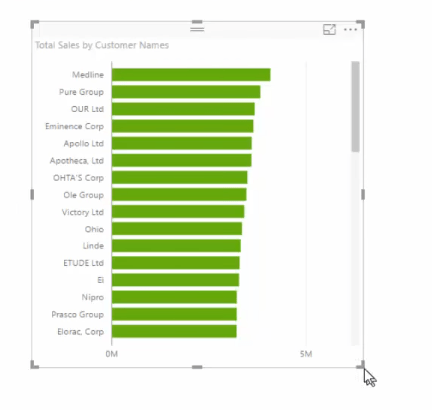
Then let us turn it into a visualization. Here we can see the best as well as the worst selling customers of the organization.
Average Sales Per Day Using AVERAGEX
Now, we can take a look at how much we sell per day to each customer.
What we need to do is for every customer, is to iterate through every single day then average the sales amount for those particular customers over that entire duration.
The way to do this is to use AVERAGEX and the VALUES function with DAX.
So let us create a new measure and call it Average Sales per Day.
Then we’re going to add AVERAGEX because we need this iterating function. AVERAGEX is going to iterate through every single day.
And then we’re going to put in VALUES, and the Date column in there. This is actually how we iterate through every single day.
What VALUES does is it creates a virtual table of just the Dates column, and then it says in the current context which is a particular customer, iterate through every single day.
Then we’re going to add Total Sales. Once we’ve calculated all of the total sales, we’re going to average them using AVERAGEX.
Our formula will then look like this one below.

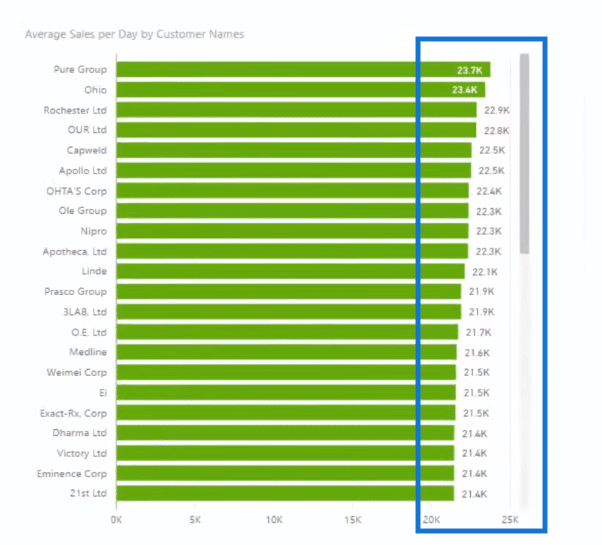
Now, if we bring in the Average Sales Per Day into the visualization, we can see, on average, how much we sell per day to each particular customer.
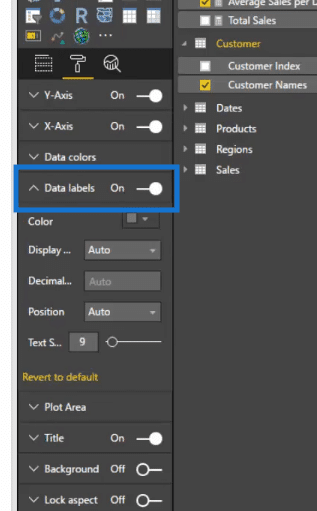
We can even turn on the data labels to have an idea about the average sales figures.
Looking At Different Time Frames
Another cool thing that we can do here is that we can also change the time frame.
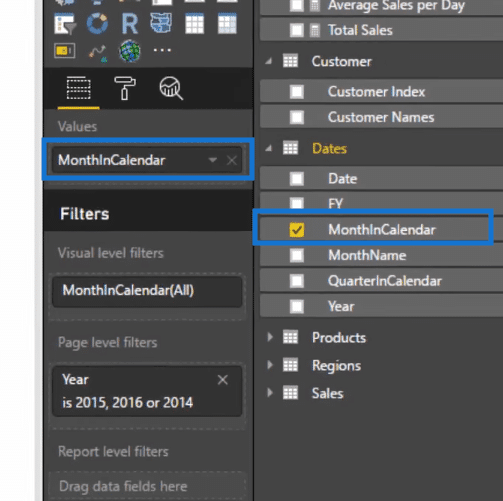
To do this, we can drag in our MonthInCalendar so we can have the month and year.
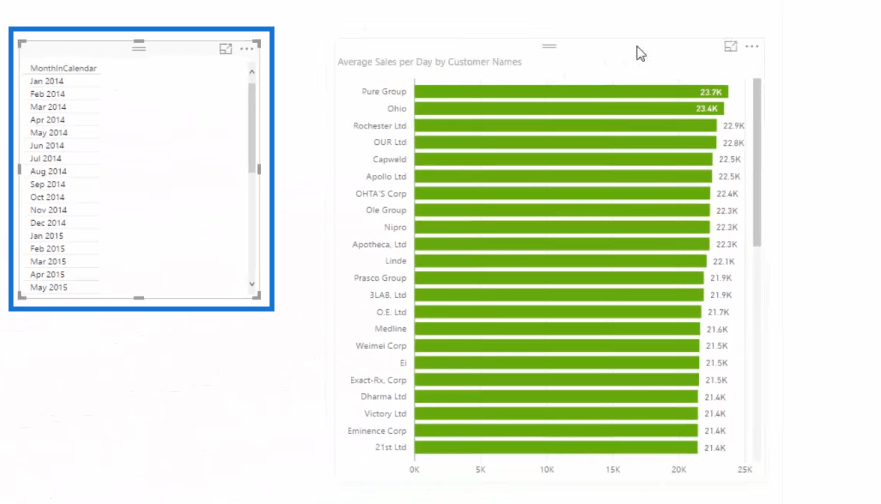
Then we can turn it into a slicer.
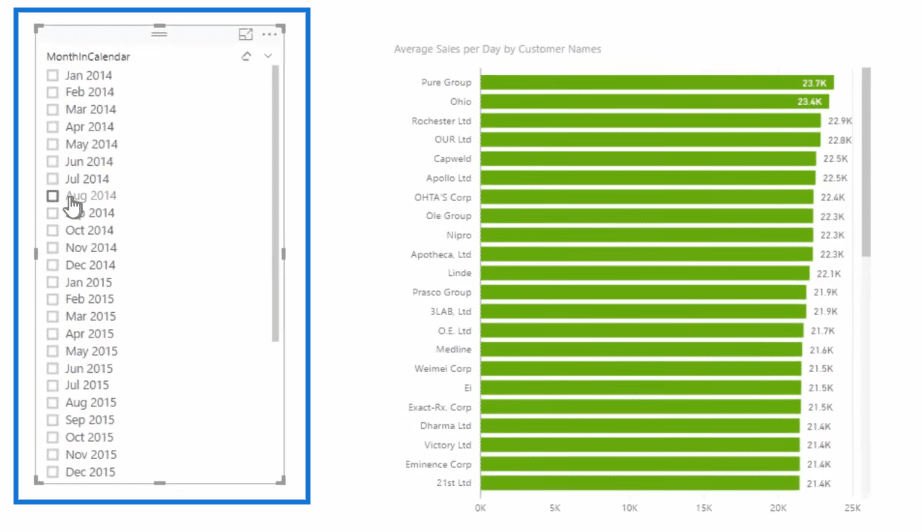
Now, we can see the average sales per day from each of our customers in a particular month and year.
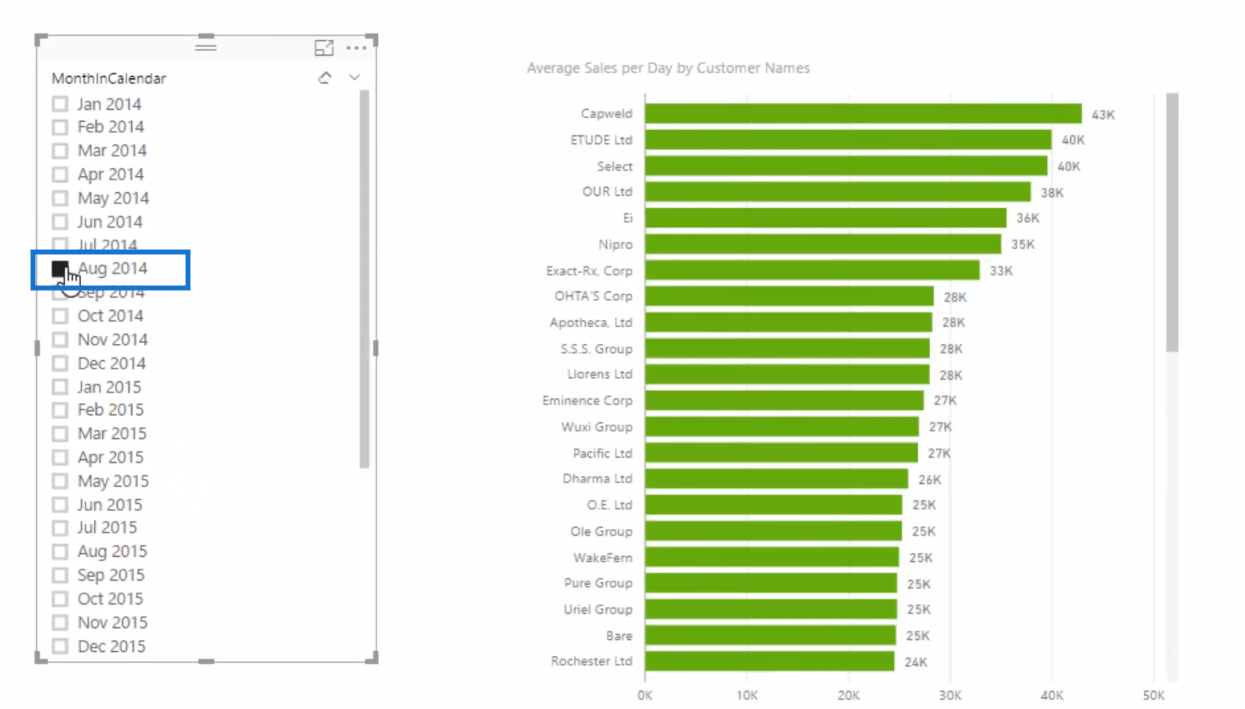
What’s really cool is that this is a dynamic way to look at this calculation.
As you can see in the image below, when we select August 2014, the visual shows the data for this time frame.
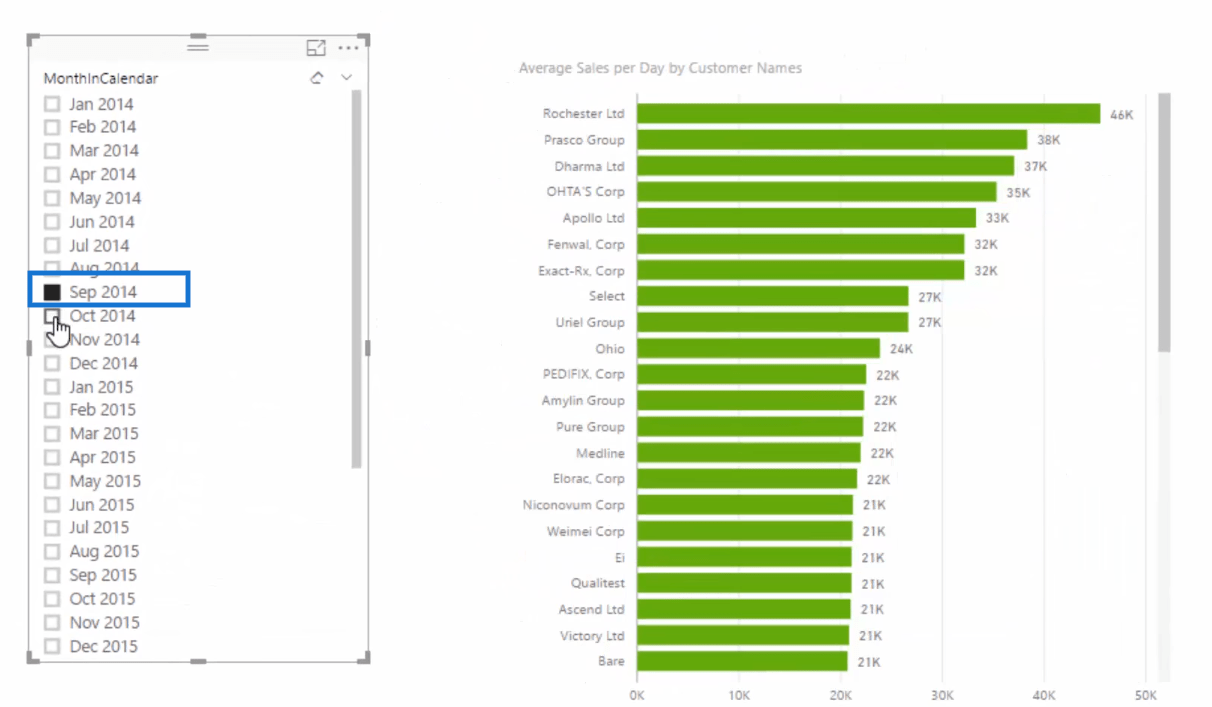
Now, when we select September 2014, our visual shows the average sales per day by customer for this time frame.
Reviewing The Process
To really understand how AVERAGEX and the VALUES functions work here, let us quickly review what is happening in our example.
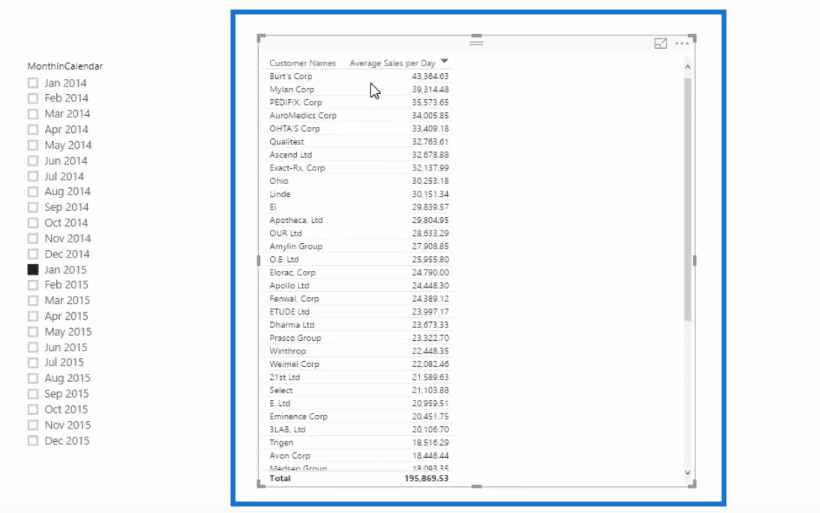
First, let us turn our visualization into a table so that it’ll make more sense.
And again, let us take a quick look at our formula.

Now, we have here our different customers. For the Burt’s Corporation for example, we are iterating every single day. This is within January 2015 because we have this selected in our slicer. Then we calculate the total sales for every single day.
Once all of the sales per day are calculated, the AVERAGEX comes in and averages them.
And this is what happens for every customer that we have in this particular example.
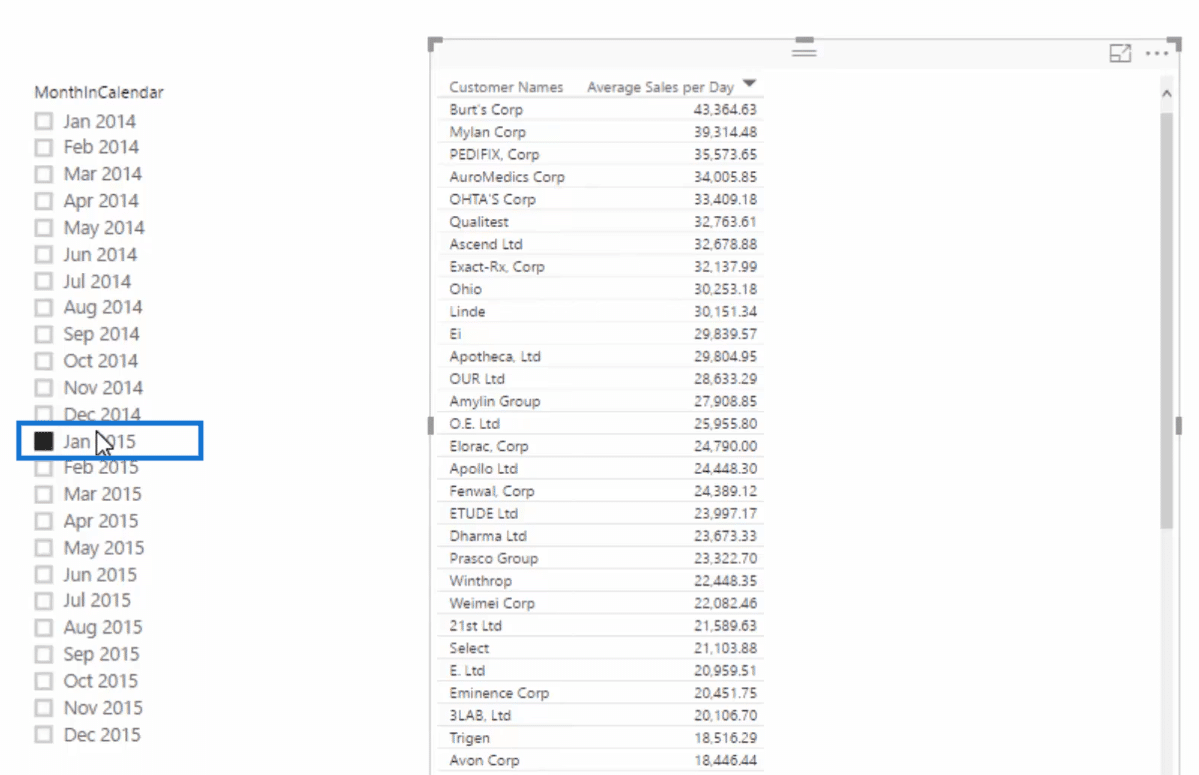
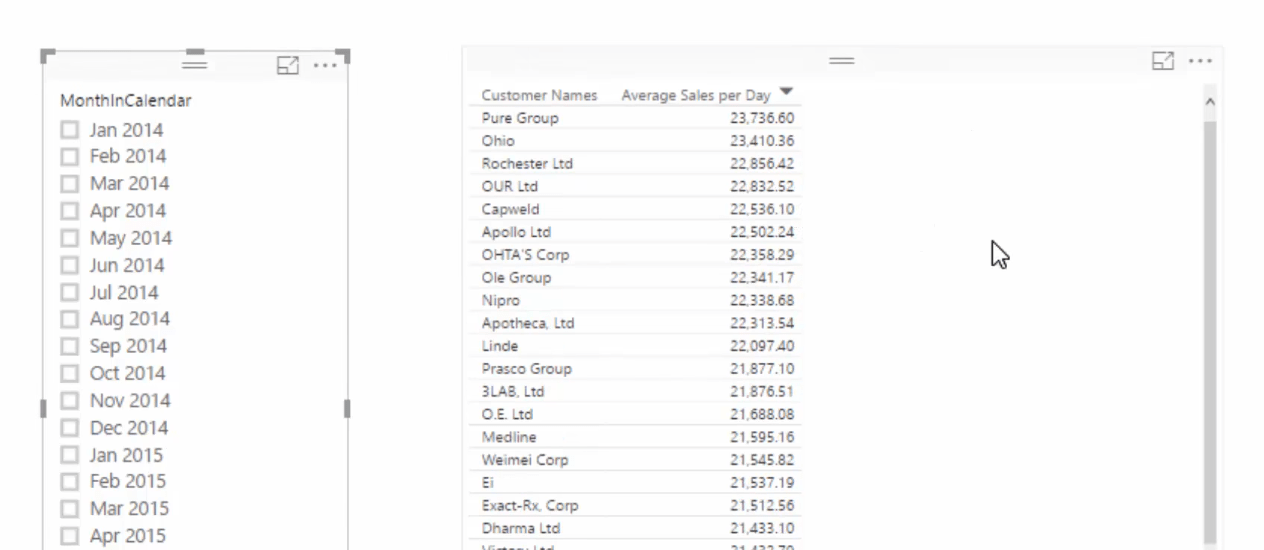
Once we change the time frame, let’s say February 2015, it will do the same calculation but this time within this new time frame.
If we did not select any time frame, it will then iterate through every single day in the date table.
Using The Same AVERAGEX Formula Against A Different Dimension
Another thing that we can do here which, again, you will find seriously cool is using the exact same formula against a different dimension.
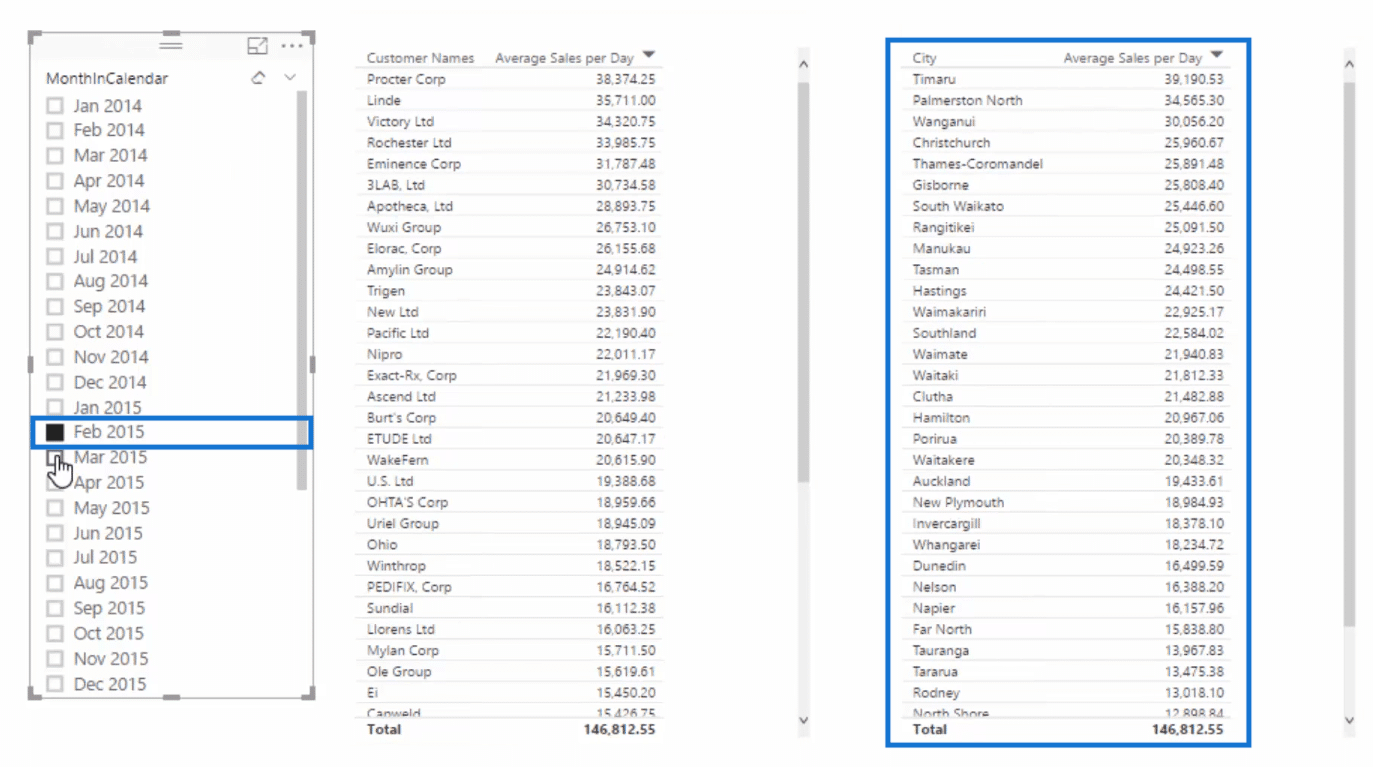
First, let us duplicate our Average Sales per Day table.
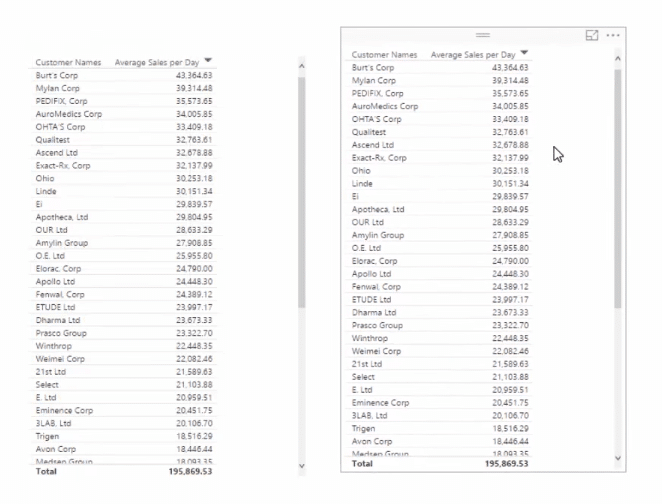
Then, let us have a look at the average sales per day for each city.
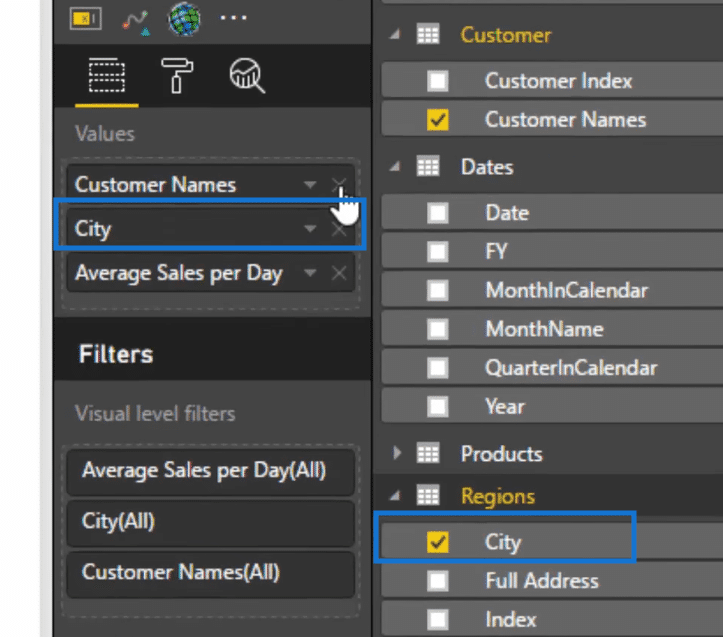
And just like that, our table is now sorted per city.
Then again it’s dynamic. Currently we are showing the February 2015 data.
If we click on March 2015, our new table will also show the Average Sales per Day, presented by city, for this time frame that we have selected.
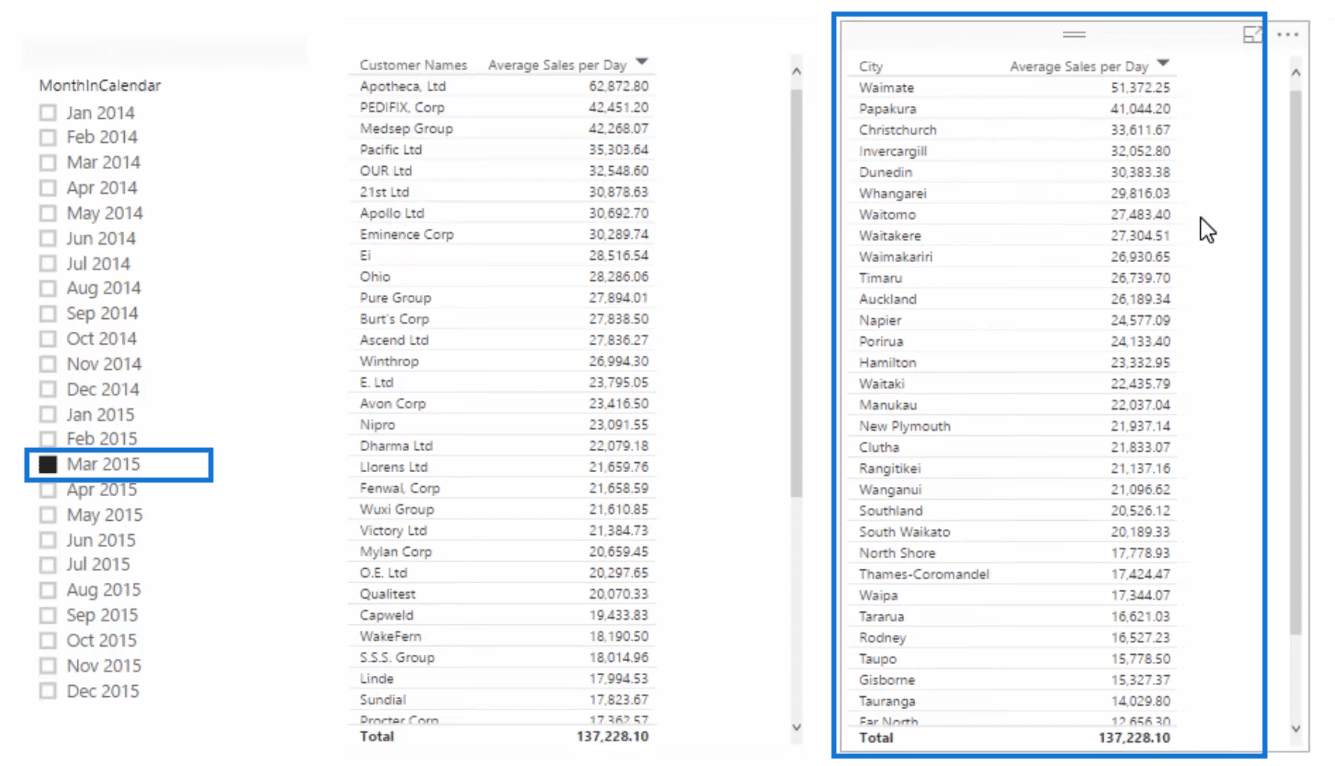
We could do it again against any dimension that we have. We’ll use exactly the same formula and it will work perfectly for all of those dimensions.
***** Related Links *****
Averages Per Customer Transactions – DAX in Power BI
Average Results Per Month – DAX & Power BI Analysis Technique
How You Can Re-Use Moving Averages In Power BI
Conclusion
In this post, we have seen how to calculate the average sales per day for particular customers using AVERAGEX with DAX, and combined with the VALUES function.
For more DAX function tutorials, check out the links below.
All the best!
Sam


