
In this tutorial, you’ll learn how to calculate average sales in Power BI. You’ll learn and understand the logic of some tools and iterating functions inside your visualizations. Formula patterns will be shown for you to utilize and practice to improve your data development skills. You can watch the full video of this tutorial at the bottom of this blog.
Understanding The Context
In Power BI, you can compute for the average in a versatile way.

The first thing to do is to evaluate the current context of the calculation. You need to know what your formula is calculating and make sure that the format is correct in order to get the right results.
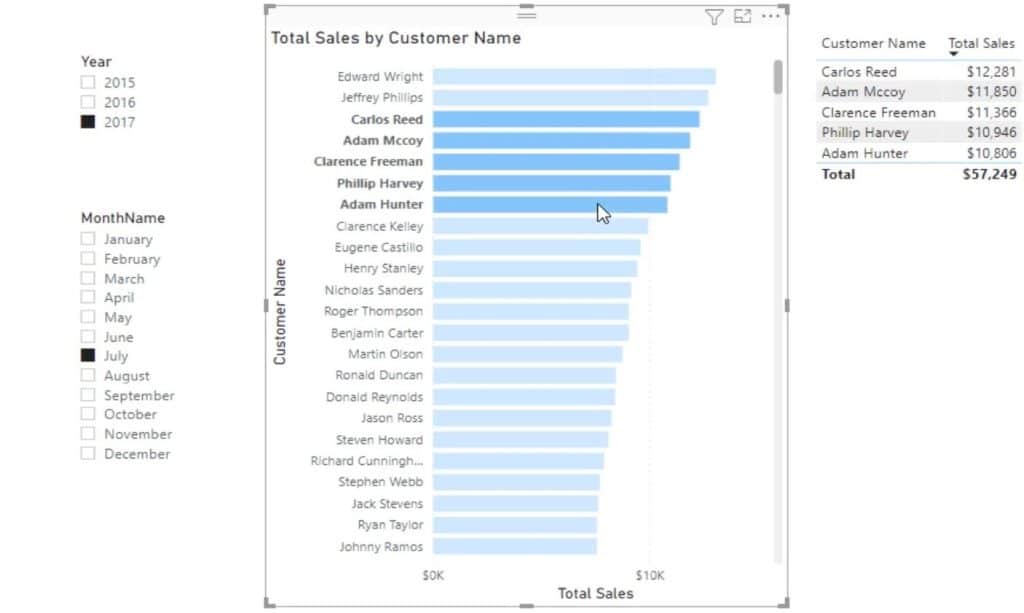
In this example dashboard, the current context is July 2017. Contexts can be more specific if you choose to add a month or a customer name.
Setting Up Measures
To start creating averaging formulas, create a measure for the Average Sales per Month, Average Sales per Day, and Average Sales per Year.
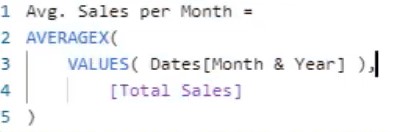
Calculate Average Sales Per Month
This measure is for the Average Sales per Month. It displays the results for the current context selected.
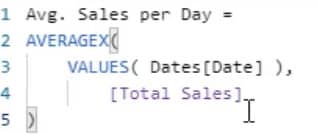
Calculate Average Sales Per Day
This measure is for the Average Sales per Day. You can use either a virtual or physical table inside the VALUES function to create a list of different dates.
Calculate Average Sales Per Year
This measure is for the Average Sales per Year. It will show you the average Sales of the year you selected.
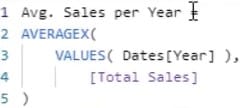
You can copy and paste the measure and change the values inside VALUES depending on the measure that you’ll create.

Next, drag those measures into the table.
Understanding Sales Table Visuals
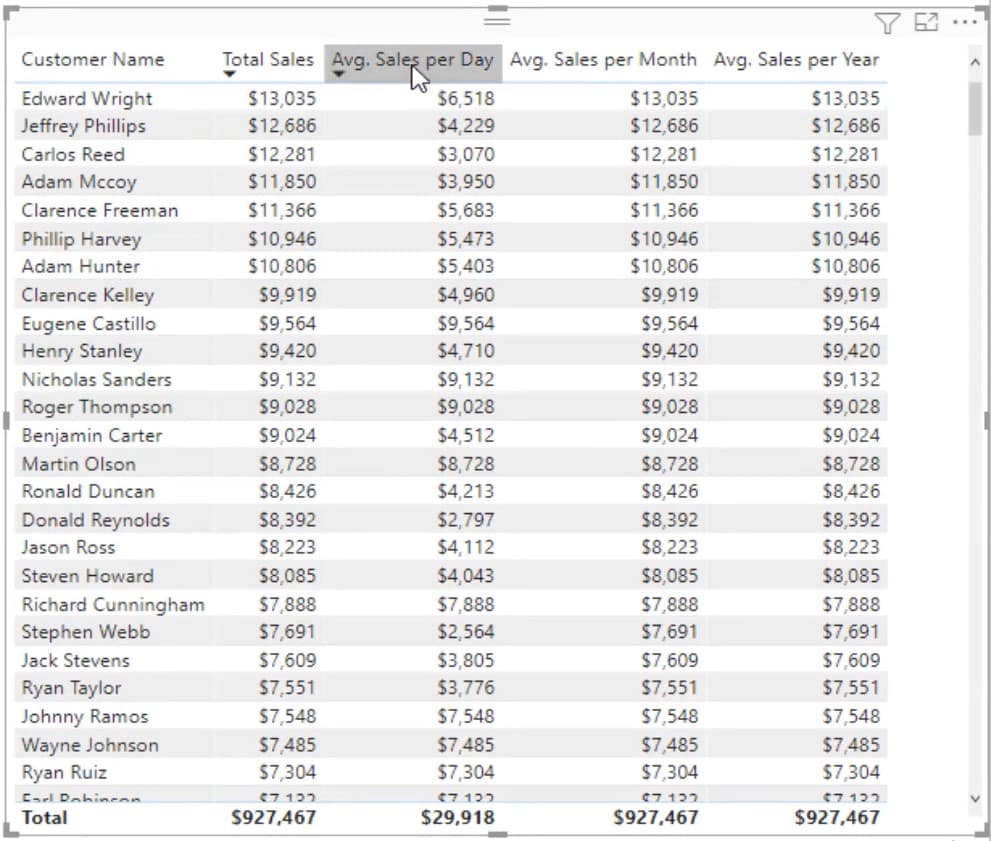
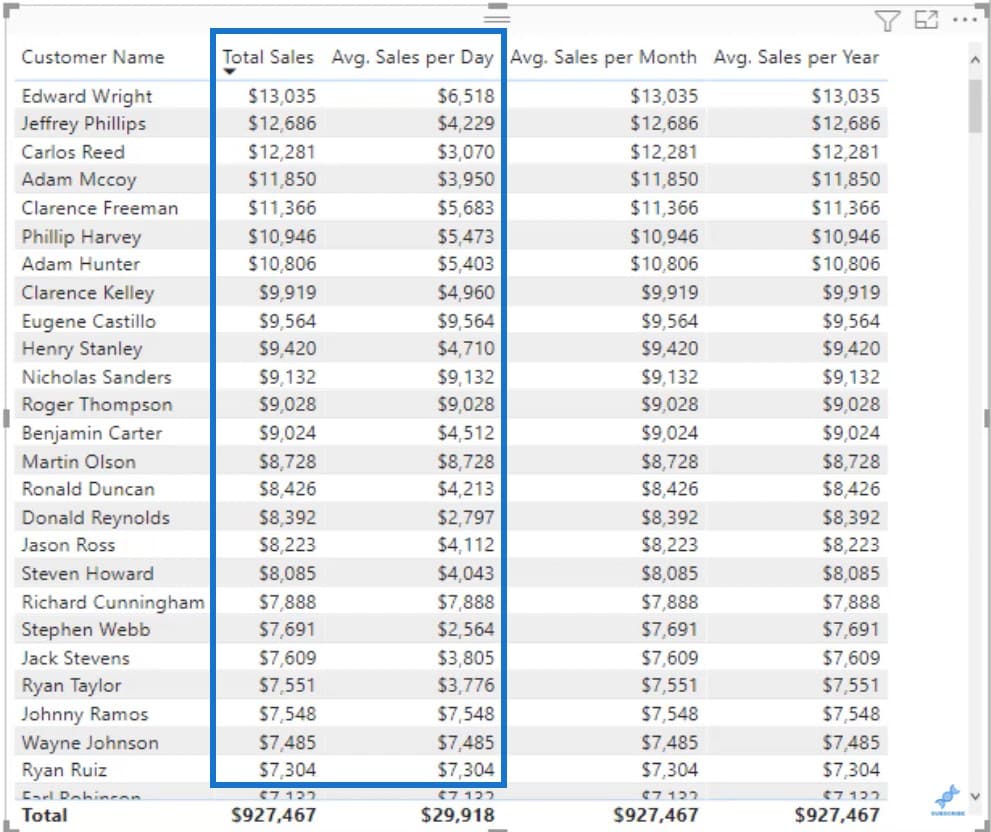
If you look at the Sales table, you’ll see a large amount on the Avg. Sales per Day column. You’ll also notice that the Total Sales value is twice the amount of the Avg. Sales per Day.
This means that Edward Wright only made 2 transactions. The values date in the formula inside Avg. Sales per Day measure is only giving 2 dates.
It sums the value for the Total Sales and then averages the 2 values for the Average Sales per day.
In the table, you can also see that the value in Avg. Sales per Month is equal to the Total Sales. This is because the current context of the table is for July 2017 only.
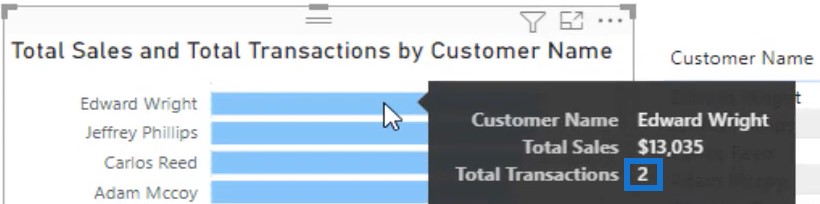
Now, create a measure to evaluate the transactions. Call it Total Transactions and use COUNTROWS for the Sales table.

Place the measure in the Tooltips of the bar visuals. You can then see the number of transactions made.
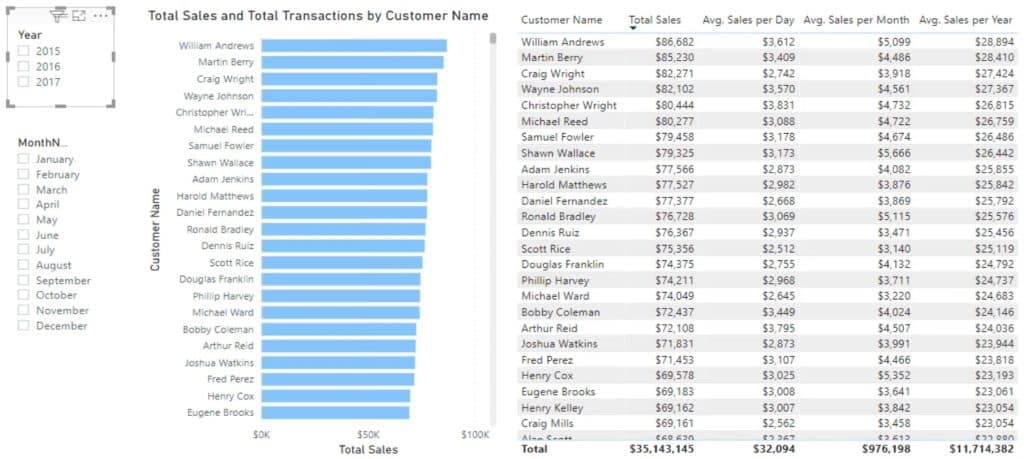
If you deselect 2017 in the selection slicer, the results on the the table and chart will show the values of the entire set of years.
Calculate Average Sales Of Other Data
To calculate Average Sales per day, regardless of when a transaction was made, you need to make sure that the Avg. Sales per Day table can retrieve an entire list of data for a particular year.
Click the Avg. Sales per Day measure and alter the formula. Use DIVIDE to work out the total sales, and then use COUNTROWS for the Dates.
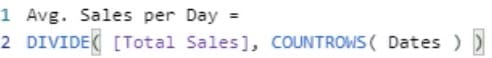
This divides the Total Sales by the number of days in the current context.
The formula pattern for general averaging is very flexible.
This table uses the same pattern for the Product Name.
You can reuse the formula pattern if you want to look at the Average of your products or any other data. You only need to drag the measure to the table and it will automatically get the results.
***** Related Links *****
Using AVERAGEX In Power BI – A DAX Tutorial & Examples
Calculate A Year-To-Date (YTD) Monthly Moving Average In Power BI
4 Techniques To Re-Use Moving Averages In Power BI

Conclusion
This tutorial is all about calculating Average Sales in Power BI. This is very useful if you don’t know the basic averaging formula patterns and the logic behind iterating functions.
You can utilize these general averaging patterns in different segments of your data to obtain various valuable insights and information for your report.
Sam


