
This tutorial will showcase the VertiPaq Analyzer Metrics in DAX Studio and how it helps in optimizing your DAX codes. Every metric will be discussed so that you’ll understand how each can help improve the performance of your codes.
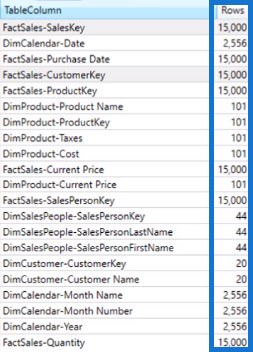
This is the VertiPaq Analyzer Metrics.


Tables Tab Of The VertiPaq Analyzer
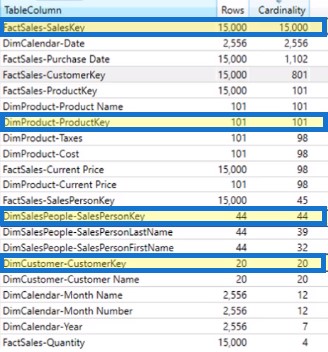
The first metric is the Tables tab or the Overall Table View. In this tab, you can see the Cardinality column. It refers to the number of unique values in a table. It’s the most important column in your data model and DAX query.
If you look at the DimCustomer table, there are 20 unique values. It means that there are 20 separate customers with non-repeating values.
This is a sample DAX query.
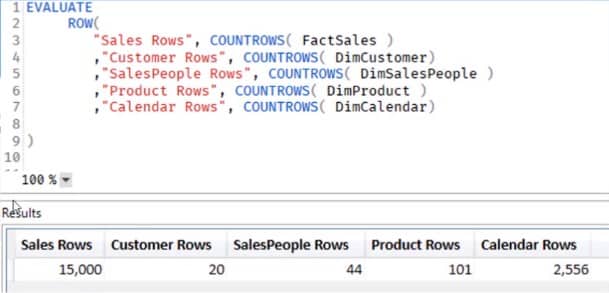
It uses the COUNTROWS function to count the rows of various tables. The number of rows correspond to the cardinality produced in the table.
Columns For Data Size
The next column after Cardinality is called Table. It shows how much memory the table is taking up. The bigger the data size, the more attention it needs. The Col Size column is the total of the Data, Dictionary, and Hierarchy Size columns.
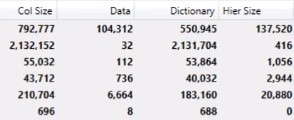
The Data, Dictionary, and Hierarchy Size columns show the total size of the compressed data, dictionary encoded columns, and automatically-generated hierarchy columns, respectively.
Next is the Encoding column which shows the type of encoding used. Value and Hash Encoding are occurring in all the tables, that’s why the result shows “Many”.

Referential Integrity Violations will also be shown in the RI Violations column. Violations occur when a value exists in the Fact table but doesn’t exist in the Dimension table.
The User Hierarchy Size column shows the size of user-defined hierarchies. The size of the relationship based on the many side of a one-to-many setting will also be shown in the Relationship Size column.
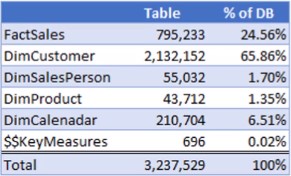
Next, you have the %DB columns. This column shows how much a table is taking up as percentage of the total size of all tables.
In the example, you can see that the DimCustomer table takes up almost 66% of the total table size. The percentage of your Database to your Fact table should be bigger than the Dimensions tables.
These are the percentages:
Since this example doesn’t have a lot of data, the Segments and Partitions columns can’t be used; it will only be applicable with larger tables.
The last column in the tab is called Columns. It simply shows the number columns there are in a table. The Data Type and % Table columns are not applicable to the Overall Table View.
Inside The FactSales Table
This is the Overall FactSales data table.
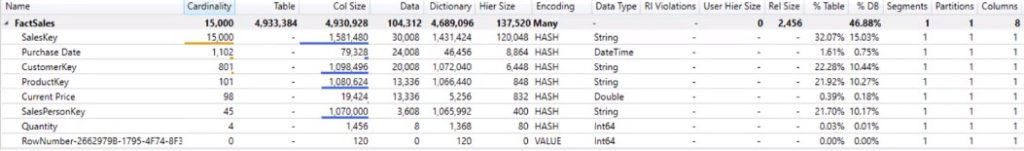
Each column in the table has its own information. The Overall Table Level, for example, has various columns such as Cardinality, Column Size, etc.
In the example, you’ll notice that the cardinality of the SalesKey is equal to the cardinality of the table. It’s because SalesKey has no repeating values and is a unique value.
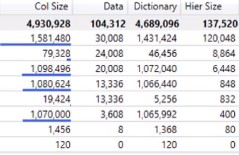
The Column Size column is equally important as the Table level. It shows the sum of the Data, Dictionary, and Hierarchy Size columns.
You can also see that the encoding method used is Hash Encoding, which creates a distinct list of values.
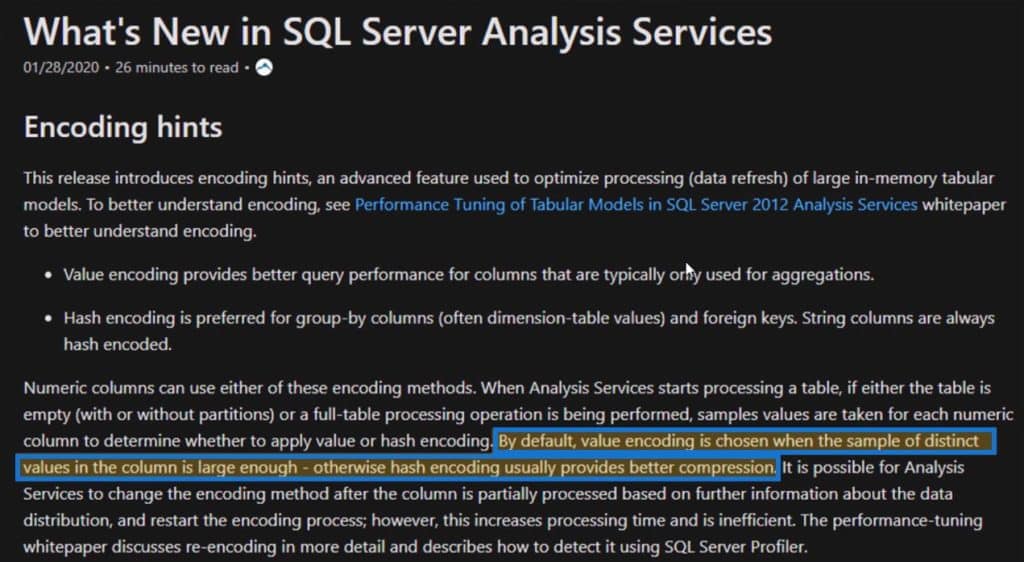
If you look at the Quantity row, you’ll see that it uses the Hash Encoding method even if the data type is an integer.
The reason for this is that the SQL Server Analysis Services set up a method in determining the best compression method.
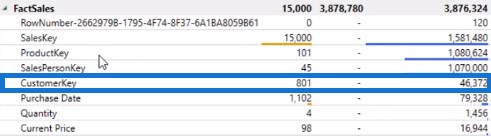
The % Table column shows the column as a percent of the total table size. In the example, SalesKey has the biggest size of the table, which makes sense because it has the highest cardinality and column size.

Likewise, the % Database column shows the percentage of either a table or column in a table as a percentage of the whole database.
You’ll see that the FactSales table is 46.8% of the total size of the data model. The SalesKey column inside the FactSales table takes up 15% of the total database size.
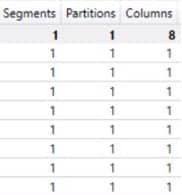
Since this example only has a small amount of data, you will only have one segment and partition. The same goes with the Columns column. The number of columns will always be one in the column view.
Columns Tab Of The VertiPaq Analyzer
The Columns tab has an easier format to view data. It provides more detailed information than the Tables tab.
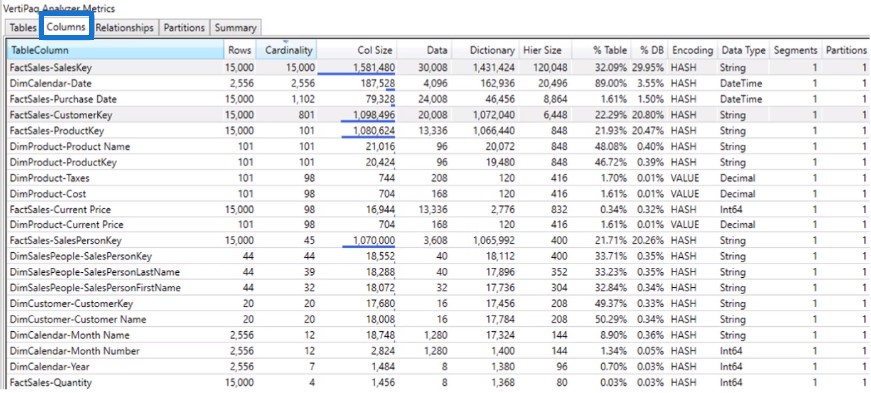
You’ll notice that it has similar columns as the Tables tab.
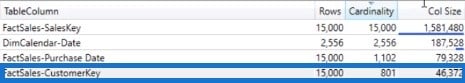
The Columns tab allows you to sort any of the columns. In this example, it is sorted by Cardinality which is denoted by a little triangle. The Rows column shows how many rows are in a table.
You can see that FactSales-SalesKey has 15,000 rows and cardinality. All primary keys have rows that are equal to their corresponding cardinality.
If the number of rows isn’t equal to the number of cardinalities, the table will have repeating values.
If you look at the FactSales-CustomerKey, you’ll notice that it has a cardinality of 801 and a column size of almost 1.1 million.
This means that it needs to be optimized and compressed. To optimize it, go to the Power BI file and open the DimCustomer table.
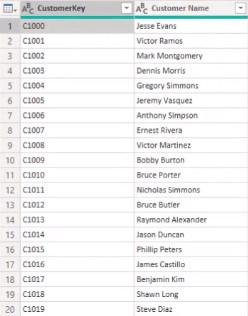
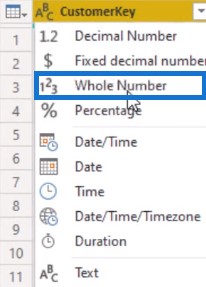
The CustomerKey column is a string type of data. You can see that the values start with C and then followed by a number. Click Replace Values to change the values inside the column.
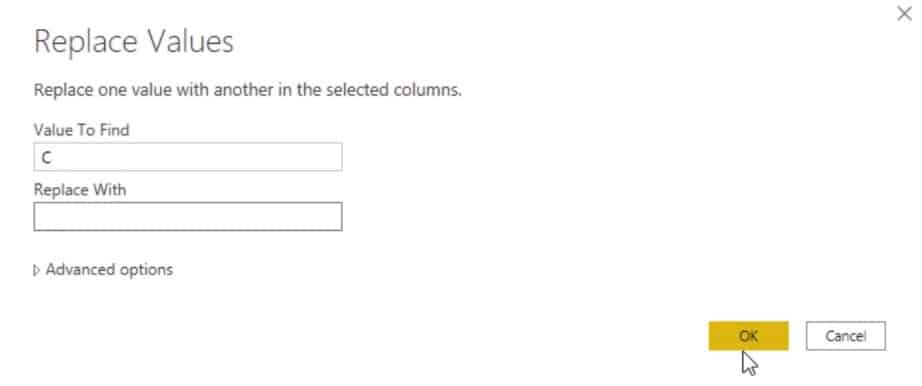
Find the value C and change it to blank. Next, change the data type to Whole Number.
Do the same thing for the CustomerKey column in the Fact table. Click Apply and go back to the DAX Studio. Next, click View Metrics to reload the DAX and then sort it by cardinality.
The column size is now reduced to 46,372 from 1.1 million. If you look at the Table view, you’ll see that the column size has also dropped to 46,372.
If you do the same thing to the SalesPersonKey which has a column size of almost 1.1 million, you can reduce it down to 5,540.
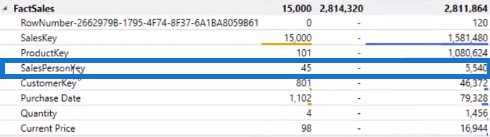
Changing string or text type values to integer type can optimize your DAX to make it perform better.
***** Related Links *****
Optimize DAX Functions With This New Course
Simple Power BI Transformations For More Optimized Data
Optimize Power BI Formulas Using Advanced DAX
Conclusion
DAX optimization starts in DAX Studio with the help of the VertiPaq Analyzer. In the analyzer metrics, you’ll see how tables and columns work, and determine which entity needs to be more optimized and improved.
If you want to find out which part of the code slows down your code’s performance, use the VertiPaq Analyzer. It will surely make your DAX better.
Nickligh


