In this tutorial, we’ll go through a quick overview of all the options available in the user interface of DAX Studio. These include the panes and each button in the ribbon. We’ll discuss how using these features will help improve your performance in DAX Studio.

It’s important to familiarize yourself with the purpose and function of each feature in DAX Studio. So, we’ll go through this from top to bottom.
Using The DAX Studio Ribbon
DAX Studio has three tabs on its Ribbon: Home, Advanced, and Help.

1. The Home Tab:
The options under the Home Tab are grouped according to purpose.

For Building And Executing Queries
These are the buttons inside the Query group:

The first button on the left is Run. This option allows you to execute the DAX code you’ve written. And if you click the dropdown arrow, 2 more buttons will appear: Run Query and Clear Cache and Run.
The next button is Cancel. Clicking this option will prompt the query execution to stop. This is especially useful if a query is taking a long time to Run.
The Clear Cache option is similar to Clear Cache and Run, only that the former will simply clear caches in the program. So if you want to run the query after clearing the cache, it’s better to choose the latter option to reduce the number of clicks.
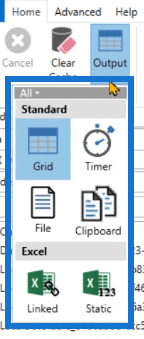
The Output option allows you to extract the results for viewing and editing in a different software. For instance, if you want to view the results in Excel, you can use the Output option to extract the results as an Excel file.
The View group only has one button in it: the Query Builder.
The Query Builder allows you to execute a DAX query without needing to write any code.
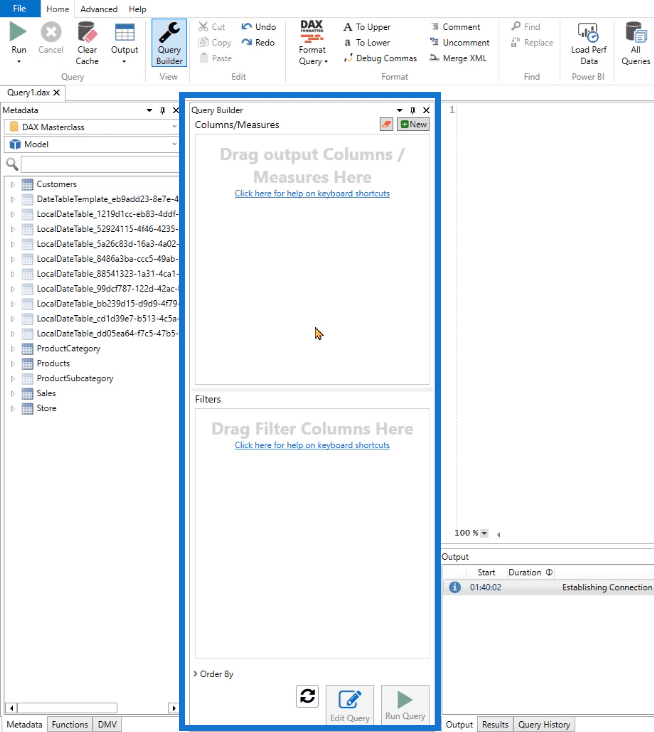
After clicking the Query Builder, you only need to drag and drop columns and/or measures from your metadata pane.
The Edit group contains buttons similar to that of other programs, such as Excel.

These commands are applicable to the codes you’ve written.
For Formatting DAX Code
The next group is Format:

Format Query is a great tool to use when writing DAX code. Clicking this will format your DAX codes according to DAX Studio standard.
This option uses a service known as daxformatter.com. It sends a request to this website and in turn, the site formats the code and then sends it back to DAX Studio. Note that you need an internet connection to make this functionality work.
Next, the Comment and Uncomment buttons allow you to place comments in your DAX code.
The To Upper and To Lower buttons allow you to change the letter case of your written DAX code.
The Debug Commas option is a feature that allows you to shift commas from the end of the line to the start of the line. This is especially helpful when you’re writing multiple lines of code. It lessens the confusion.
The next group Find with the buttons Find and Replace have similar functions to that of other software.

For Measuring And Monitoring Performance
Moving forward, there’s the Power BI group.

The Load Perf Data button allows you to import data that has been exported from the Power BI Performance Analyzer.
To do this, you first need to extract a file from Power BI. Go to the View tab in Power BI and click Performance Analyzer.

The Performance Analyzer pane will then appear. Click the Start recording button while going through the visuals and DAX code in Power BI you want to analyze, and then click Export.
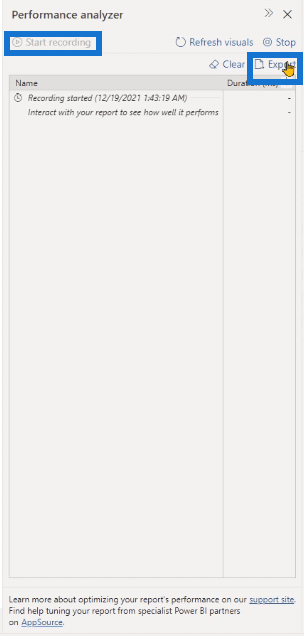
Go back to DAX Studio and then load the file you extracted from Power BI using the Load Perf Data option.
Next is the Traces group:

The first button in this group is All Queries. When you click it, a new tab called All Queries will appear at the bottom.
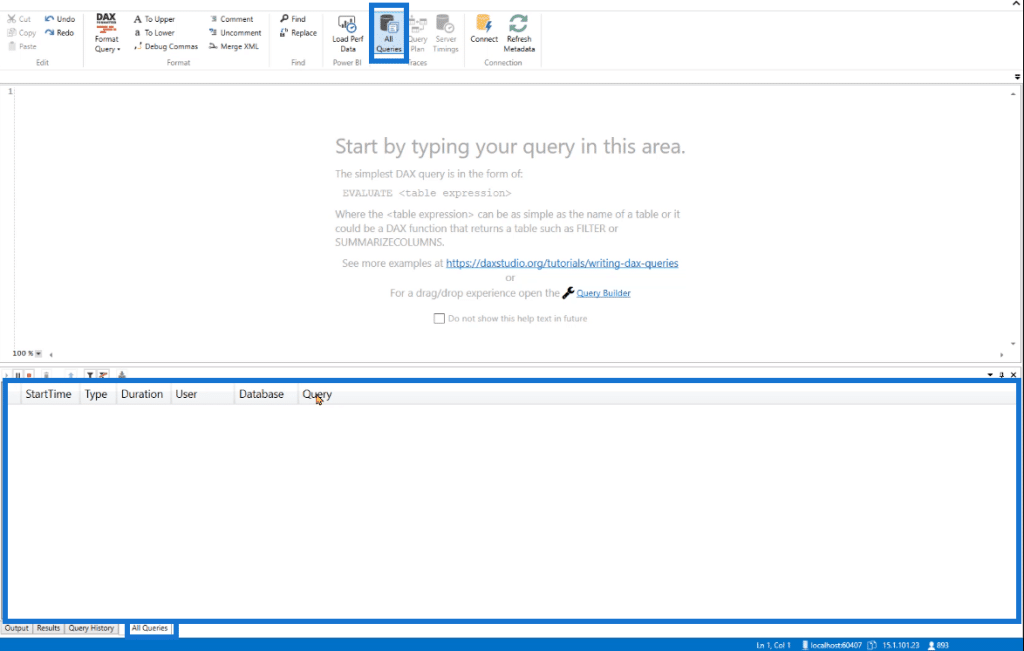
This tab contains StartTime, Type, Duration, User, Database, and Query. It provides digital statistics of the queries sent to the Analysis Services in either Power BI, Power BI Service, Excel, or SSAS.
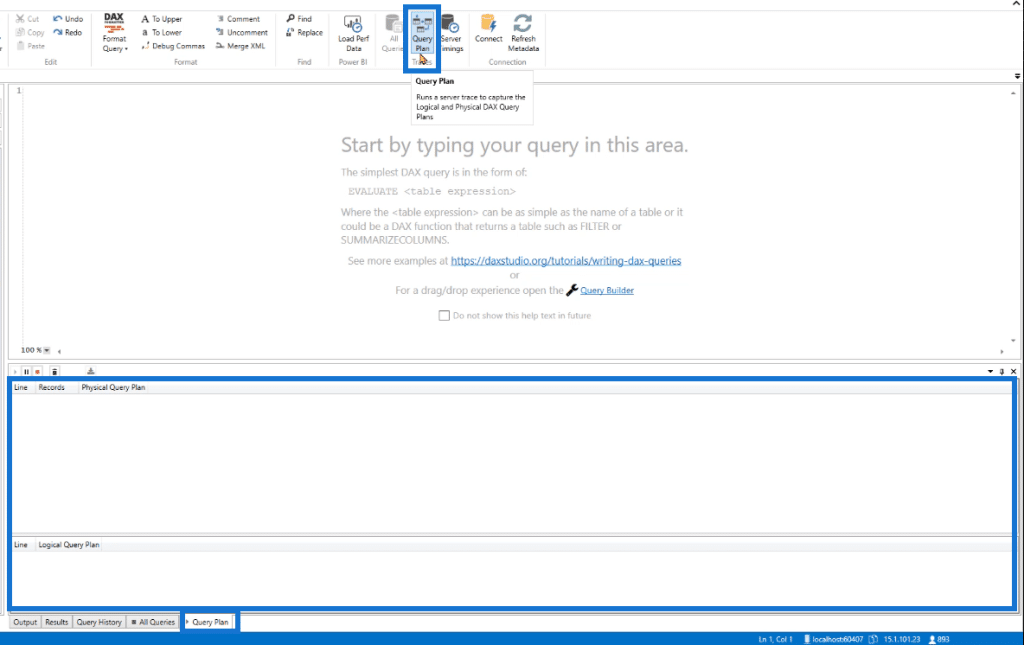
The Query Plan option provides information about the logical and physical query plan. These can help you understand how the DAX engine solves a DAX code. When you click this option, another new tab will appear at the bottom.
Then there’s the Server Timings option. It provides information on how data was extracted from the Storage Engine. Similarly, another new tab will open if you click it.
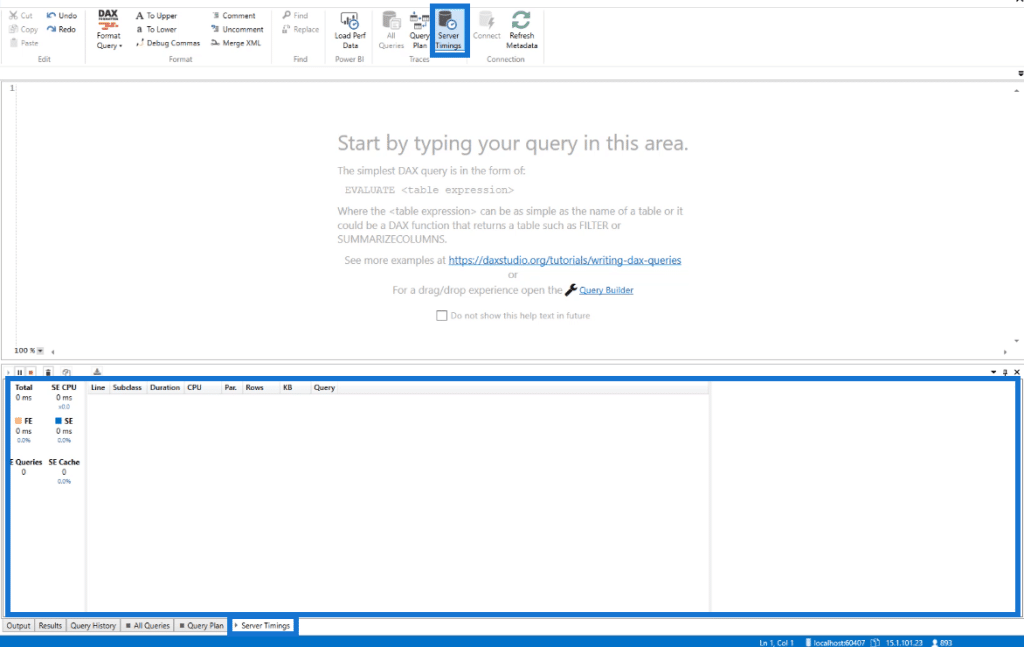
For Traces, you can’t have all three options turned on simultaneously.
If you try to click two options simultaneously, an error message will appear saying that you have to wait for the trace to update.
For Use With External Software
The last group under the Home tab is Connection:

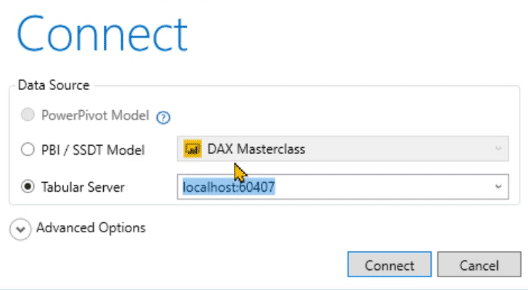
The Connect button allows you to connect or change the current connection to either Power BI model, Analysis Services, or Excel from withinDAX studio.
For example, you’re working with a Power BI model and you want to switch instantaneously between the SQL Server data tools or SSAS. Then, just use the Connect option and make the changes you need.
The Refresh Metadata option, when clicked, will update your tables and data found in the Metadata pane in DAX Studio.
For example, you made changes in your data in Power BI. This change won’t be automatically tracked by DAX Studio. So, you need to click Refresh Metadata and it will then update accordingly.
2. The Advanced Tab:
The second tab in the Ribbon is the Advanced tab.

The options in this tab are grouped in 4 according to function.
First is the Metrics group:

Let’s first discuss the View Metrics option.
When clicked, this will open the VertiPaq Analyzer Metrics pane that provides several information on the Tables, Columns, and other data used in your current DAX Studio file.
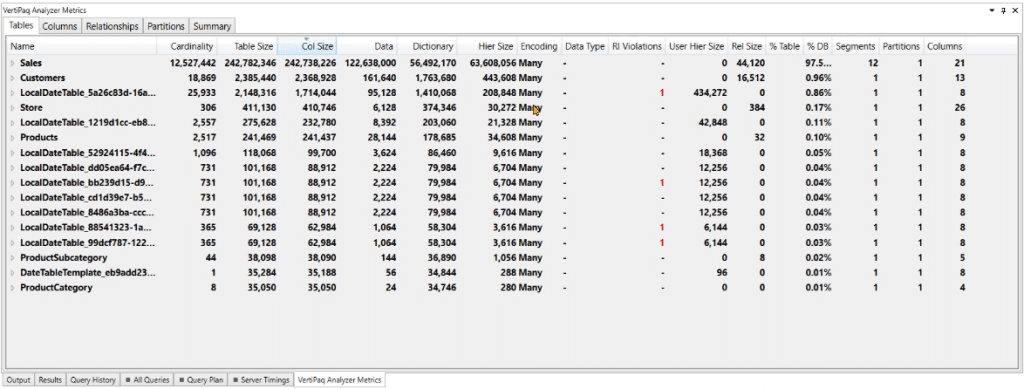
The Export Metrics option will then export the information in the VertiPaq Analyzer Metrics pane while the Import Metrics option brings in metrics from sources outside DAX Studio.
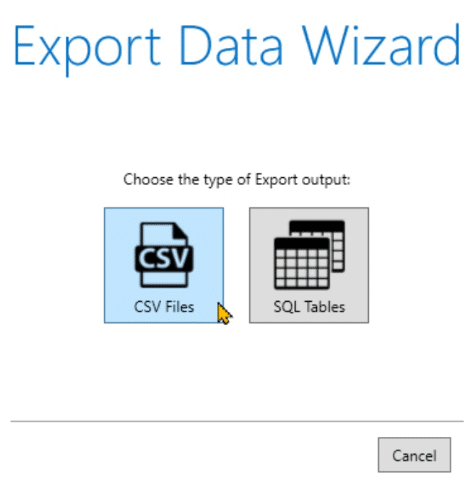
The Export group contains the Export Data option that allows you to export the data in your DAX Studio as either a .csv file or SQL table.

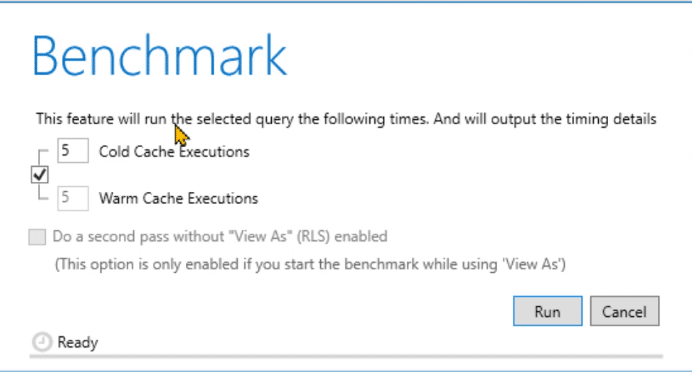
Next, the Performance group contains the Run Benchmark option.

You can use this when you want to run the same code multiple times with help of cold cache and warm cache.
The last group under the Advanced tab is External Tools.

When clicked, the SQL Profiler opens the SQL Server Profiler window.
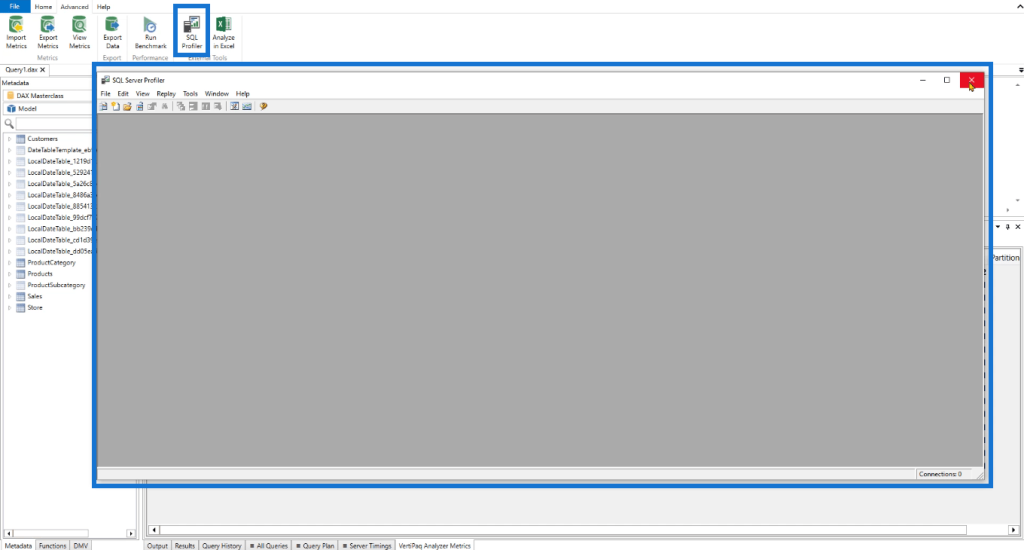
It allows you to track the code that’s being executed along with the events generated behind the scenes. However, DAX Studio already does this same operation so there’s no actual need to use this option.
This is something that you would use in case you can’t open DAX studio on your computer. This option is available in the SQL Server Management Studio.
The Analyze in Excel option allows you to connect DAX Studio to Excel. This is especially useful if you want to quickly create a pivot table or report.
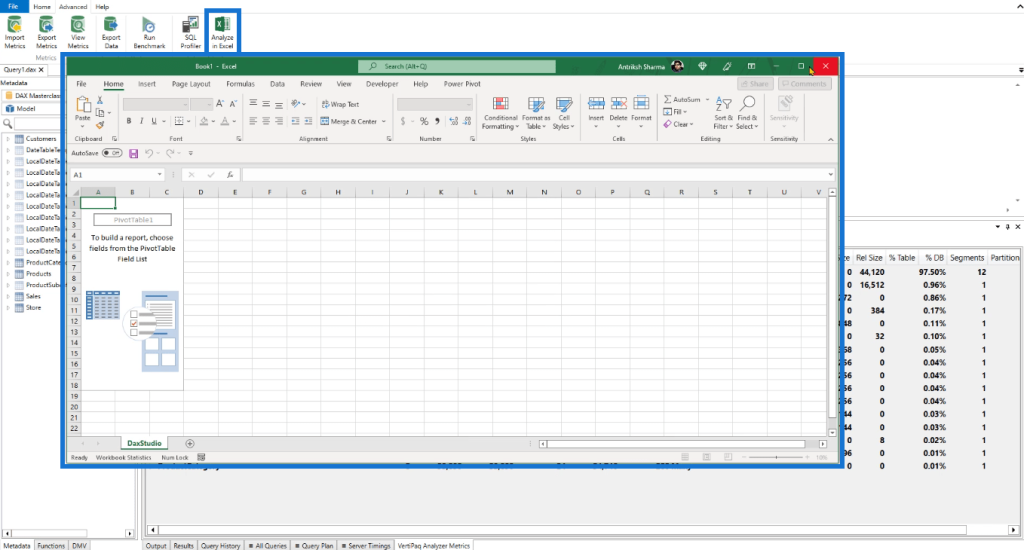
When you click this, the Excel program will launch and, by default, will redirect you to create pivot tables.
3. The Help Tab:
The last tab in DAX Studio’s Ribbon is the Help tab.

This tab will assist you in further understanding the functions and features of DAX Studio.
Under the Links group, there’s DAX Studio Help, Power Pivot Forum, and Analysis Services Forum.
These are links that you can access if you have questions. These links will redirect you to online sources, so make sure you’re connected to the internet.
Other than that, there’s also the Issues group.
If ever you’re facing a bug while using DAX Studio, you can report it using the Report a Bug option. You can also request for features using the Request a Feature option. And if there’s a specific feature that you don’t understand, you can click the Ask a Question option.
If you want to know more information about your version of DAX Studio, you can click the About DAXStudio option.
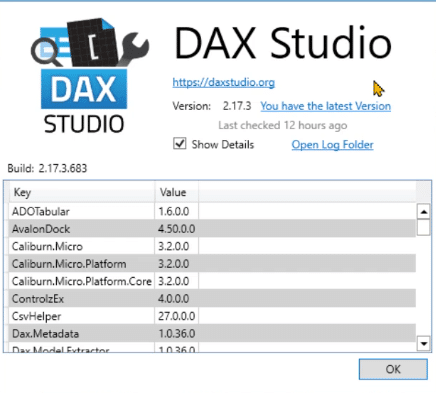
You can also use this to share more detailed information regarding problems you’ve encountered while using DAX Studio.
Adding Features To The Quick Access Toolbar
If there are features or functions that you utilize multiple times a day while using DAX Studio, you can add them to the Quick Access Toolbar.
To add items to the Quick Access Toolbar, you only need to right-click on them and then select Add to Quick Access Toolbar.

The Quick Access Toolbar can be found on the upper-left corner of DAX Studio.
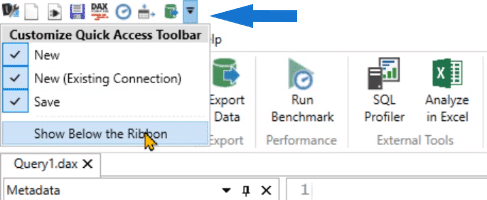
You can also choose to transfer it below the Ribbon.
This is especially helpful if you often use options that are in dropdown menus. By adding them to the Quick Access Toolbar, you reduce the number of clicks you need to make.
Also, if you have everything you need in the toolbar, you can close the Ribbon. This will make your DAX Studio workspace less cluttered.
Using The Metadata Pane In DAX Studio
The Metadata Pane provides you with information about your data model.
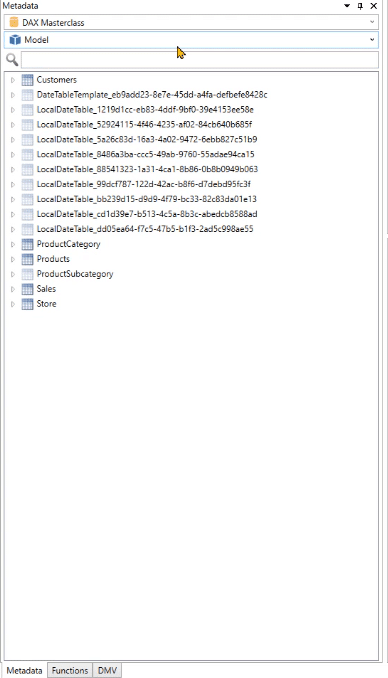
The first dropdown menu provides you with the name of the data model. If you’re connected to SQL Server Analysis Services, you’ll see multiple databases listed in this dropdown menu.
The search option allows you filter out the contents of your data model such as, tables and columns.
Using Special Features In DAX Studio
One distinct feature in DAX Studio is the ability to zoom in and out of each pane.
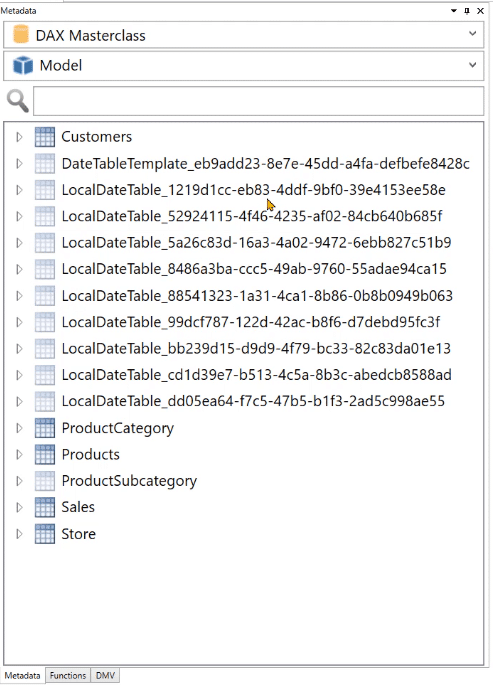
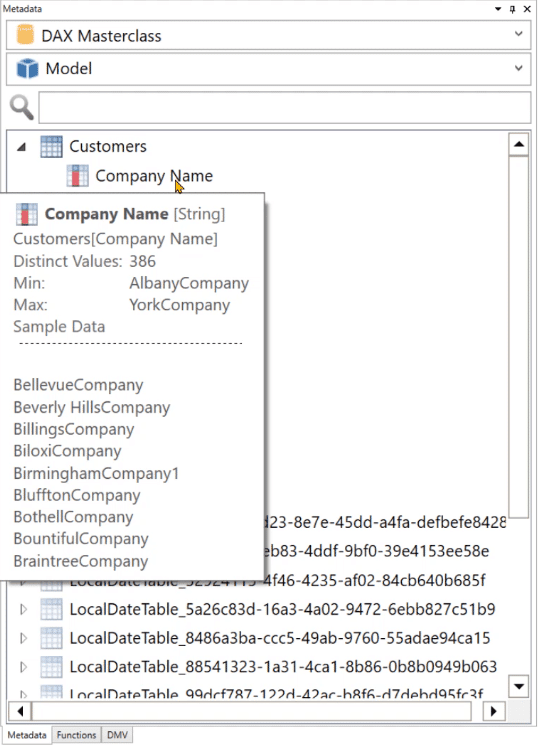
Moreover, if you hover over a table in the Metadata pane, detailed statistics will appear regarding that table/column.
You’ll also notice that there are tables with translucent icons which aren’t originally part of the Power BI file used in DAX Studio.
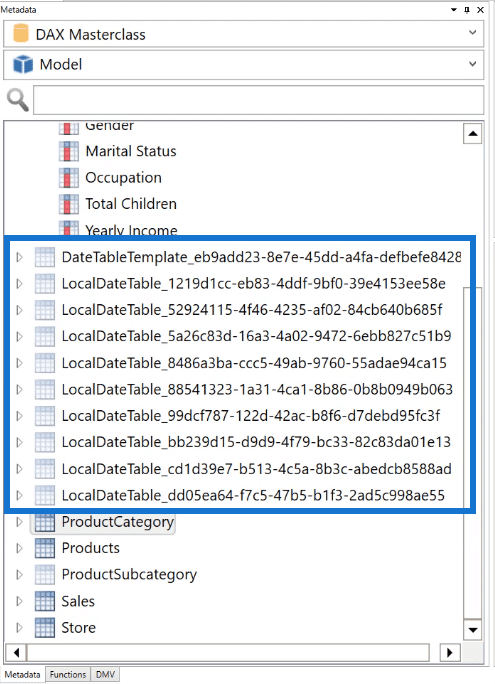
These tables exist because every time you use the Auto date/time functionality in Power BI, DAX Studio will create multiple tables for each column in your data model.
This is why it’s important to have a Date table in every data model in case you’re going to use it in the future to perform time intelligence computations.
These tables only appear inside external tools such as DAX studio and are not visible inside Power BI by default. You can turn this option off so that it doesn’t consume a lot of space in the program’s memory.
Using The Functions Pane In DAX Studio
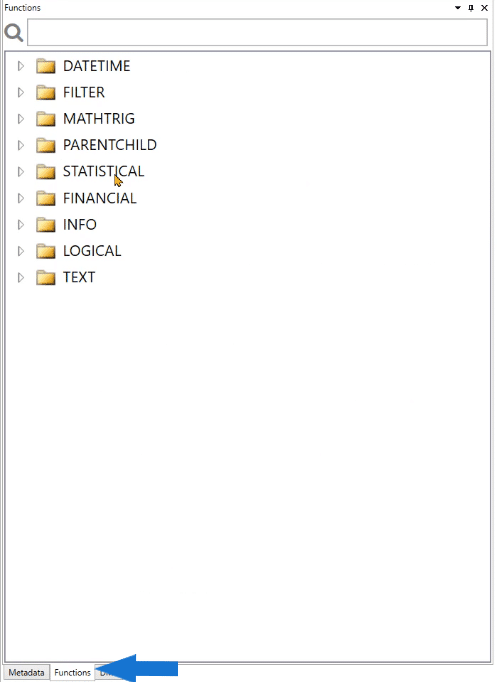
The Functions pane is used if you want to understand the parameters and argument of a given function.
To view the parameters, drag and drop a function from the Functions pane to the coding area. In this example, it’s the DATE function.
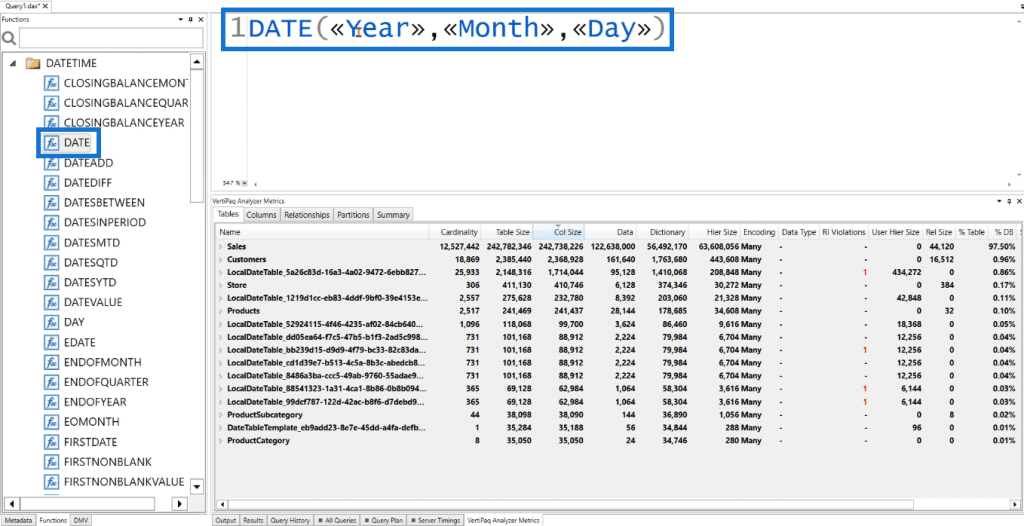
You’ll then see the argument you need to make the DATE function work properly in DAX Studio.
Using The DMV Pane In DAX Studio
DMV stands for Dynamic Management Views. These DMV’s return server state information .
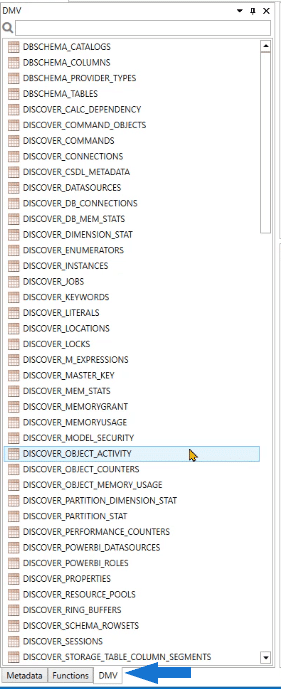
You can access any information about your data model with the help of these DMVs. They appear like an SQL statement, but they’re not really a code.
As an example, let’s drag and drop DISCOVER_KEYWORDS in the coding area and then Run it.
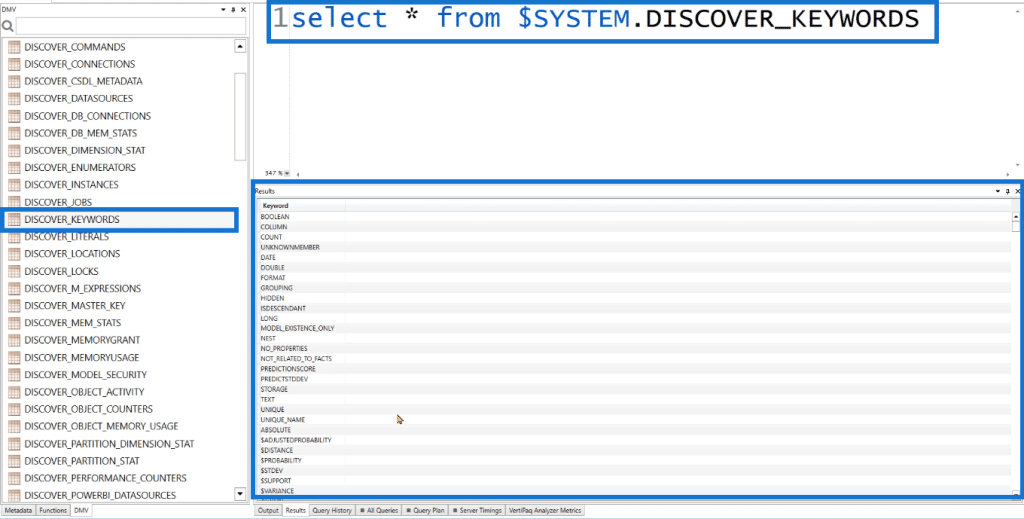
In the Results pane, you’ll see that it provides a column which says Keyword.
If you try to Run one of these Keywords in Power BI, you’ll get an error message saying that the code is incorrect.

This is because these Keywords are reserved.
You can’t use reserved Keywords in your DAX code.
This is a very useful feature as it helps prevent keyword mistakes. Using the right keywords in DAX Studio and Power BI are especially crucial if you’re writing multiple lines of code.
Using The Other Available Panes In DAX Studio
Output Pane
The Output pane provides information on the actions you performed in DAX Studio.
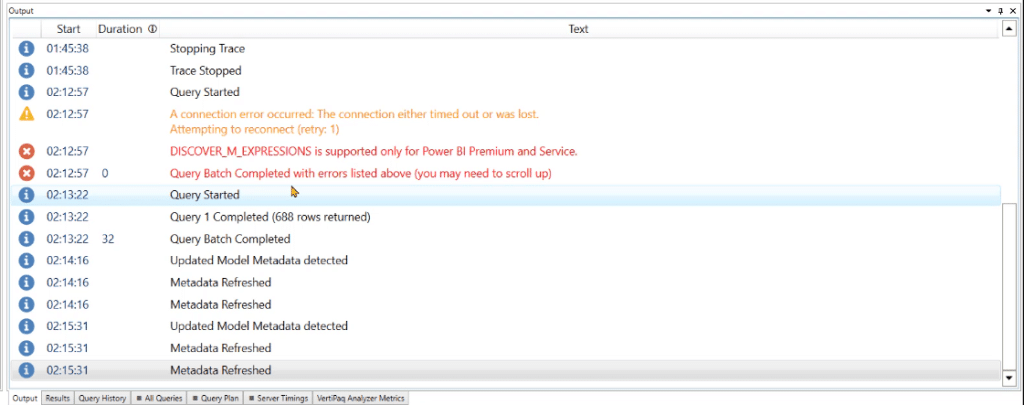
This includes, but are not limited to, establishing connections, waiting for the Trace to start, and/or refreshing the Metadata. It also includes detailed information on errors.
If you execute a code, it will also provide information about the number of rows that were returned and the query processing time.
Results Pane
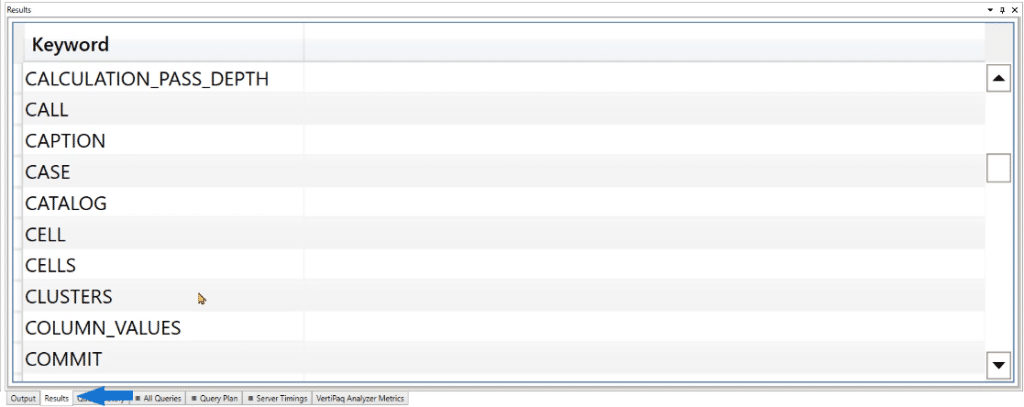
The Results pane shows the result of the DAX code or DMV you executed.
Query History Pane
The Query History pane shows a summary of the codes you’ve executed.
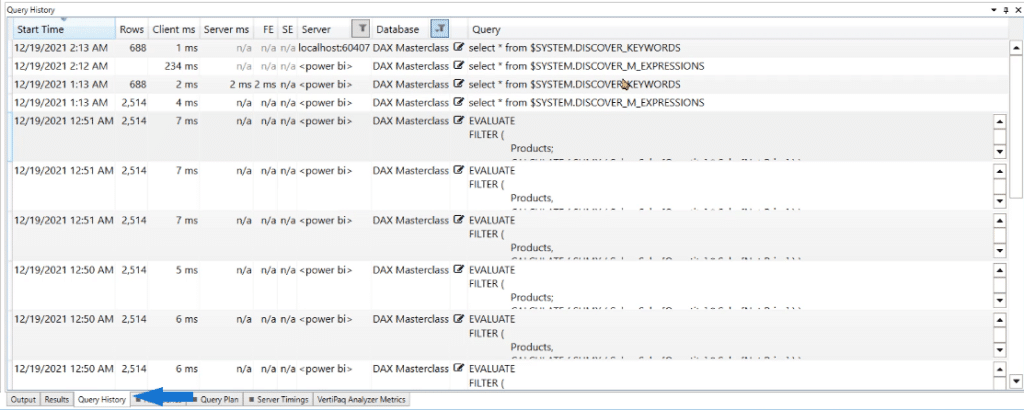
This is especially helpful if you close a DAX Studio session and want to retrieve information about the queries you executed. If you double-click a query, it will automatically appear in the code window.
Other Information
At the bottom-right side of DAX Studio, there are other several information available.

The most important information is the local host and the code number. When you try to connect Excel to either Power BI or Analysis Services, you need this information so that you can make a connection between DAX Studio and either of the two software mentioned.
The time, in the end, allows you to keep track of the seconds or minutes that have elapsed when executing a query.
***** Related Links *****
Materialization Ideas For Data Caches In DAX Studio
Connect DAX Studio To Power BI And SSAS
Query Performance And DAX Studio Setup
Conclusion
DAX Studio is the best tool to use when analyzing DAX queries in Power BI. So, it’s important to become familiar with each feature it has built with. It’s important to understand what they are, how they can be used, and how they can impact your workflow when using DAX Studio.
This overview of the user interface of DAX Studio is a good foundation before writing DAX codes. The more profound your knowledge of the basics, the more you’ll succeed when dealing with advanced problems.
Enterprise DNA Experts


