One of the most crucial topics for any Power BI beginner to know about is iterating functions. You may watch the full video of this tutorial at the bottom of this blog.
So before you dip your head in working with complex calculations, I will share with you some simple iterating functions in this article.
Why Use Iterating Functions?
I get this question all the time as I do live training or live summits.
So why should we use iterating functions instead of just creating a calculated column and use SUM?
We utilize iterating functions in cases that we don’t have the column available that provides the information to do a simple SUM.
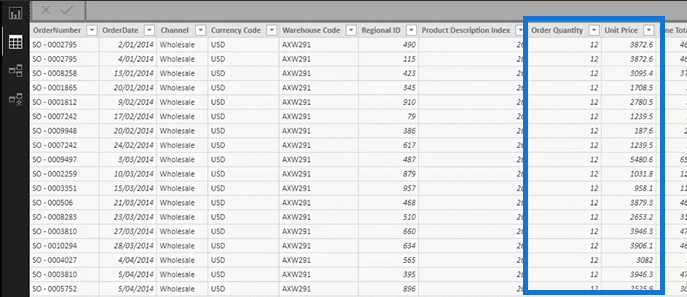
To explain further the SUMX and AVERAGEX functions, we will work on a generic sales table. We have two key pieces of information available: the order quantity and the price at which we sold a particular product.

So in every sale that we made, we know what quantity was ordered and the price. But we don’t have a generically named revenue column or sales column to do a sum.
To calculate this particular result virtually, we can iterate through the sales table and use SUMX or AVERAGEX. These functions allow you to iterate through a physical table or virtual table.
Simple Calculations Using SUMX
To get the Total Sales, we’re going row by row multiplying the order quantity by its unit price. After that, we’re going to save all of the individual results into memory and then sum them all up. This is exactly what the SUMX function does.

This is the purest reason why these particular formulas are so important and more optimal to use than creating some calculated column and doing those calculations individually.
The same thing will be done for the Total Cost. We’re going to iterate through the sales table and then multiply the order quantity by the total unit cost.

But remember that in this particular table, we don’t have a total cost column so we couldn’t just go and do a simple sum. So we need to go row by row, which is sometimes referred to as a row context.
You can learn more about row context through this link:
Explaining Row Context – (1.10) Ultimate Beginners Guide to DAX
Simple Calculations Using AVERAGEX
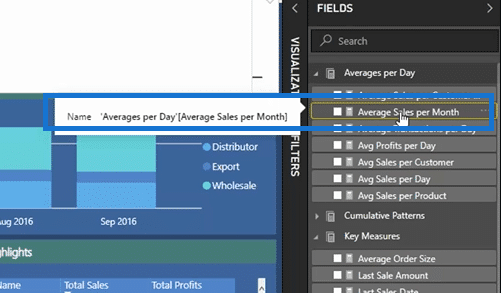
As we go into AVERAGEX, we will drill into the Average per Day measure group that I have and calculate the Average Sales per Month.

In the current context, we are going to iterate through a virtual table instead of the whole data table. This is totally legitimate with the AVERAGEX function. And then we are going to create a virtual table using the values.

The values is going to bring us one column table of each individual unique month and year. And then we’re going to aggregate the total sales for each month and year.
In this particular case, we’ve got three months, so it is going to create a table of three months and calculate up the sales for each month, and then average all of it.
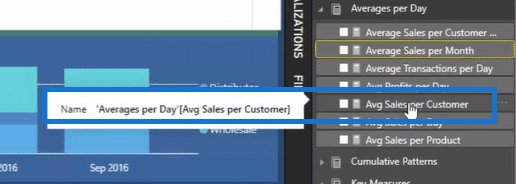
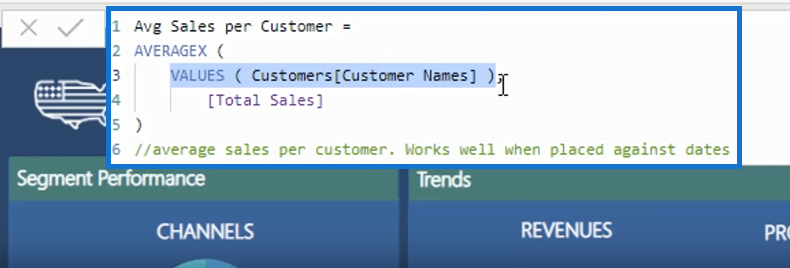
Another example we can look at is calculating the Average Sales per Customer.

In this particular case, we’re going to create a virtual table of every single customer and how many sales each customer has made iterates through them.

Once we have the sales of each customer, we can average it up and it’s going to give us the average sales per customer.
***** Related Links *****
How To Measure Averages Per Day In Power BI With DAX
Advanced Logic Within DAX Iterating Functions – Detailed Example
Cumulative Totals Across Averages & Dynamic Date Logic – Advanced DAX
Conclusion
Having a very good understanding of how these iterating functions work early on and actually utilizing them is very important.
We can use these iterating functions physically in a table or even virtually with whatever table you want to place inside of the particular function. You can place a whole range of different parameters in here.
I personally use these functions in very development that I do.
Enjoy working through this one. You can check the outline of Enterprise DNA Showcase model on this link: https://enterprisedna.co/power-bi-showcase
Feel free to practice on using the many available iterating functions in Power BI, and don’t forget to browse through these links to get more information on this topic:
Understanding How The AVERAGEX Function Works
How To Understand Virtual Tables Inside Iterating Functions In Power BI – DAX Concepts
Hopefully, you can get a good understanding of how this particular calculation operates inside Power BI.
Sam
[youtube https://www.youtube.com/watch?v=0c3o1rXccys?rel=0&w=784&h=441]


