
Cascading parameters are filters that have an effect on other linked parameters. They allow users to manage large amounts of information in a paginated report. The values selected for one parameter depend on the selected values for another.
In this tutorial, you’ll learn how to create cascading parameters to filter table data in Power BI Report Builder. We’ll use an example where the end user wants to filter the data by city, and the results should only show cities with product sales.


Adding A Parameter To Filter Data In Power BI Report Builder
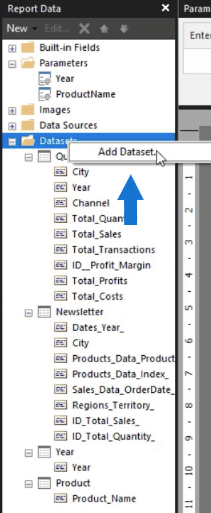
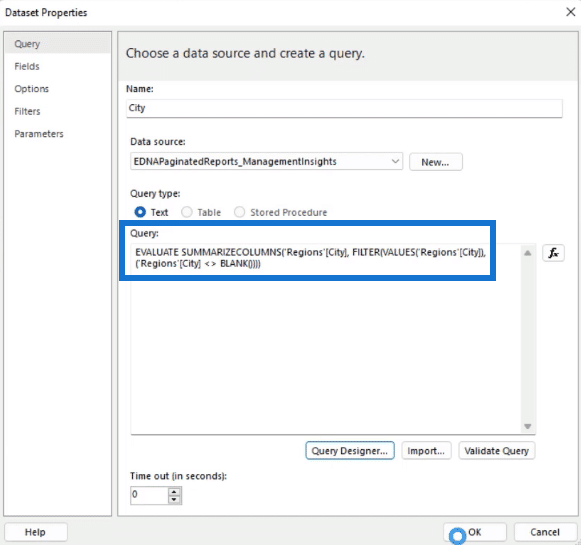
To add a parameter, right-click on your Datasets folder and select Add Dataset.
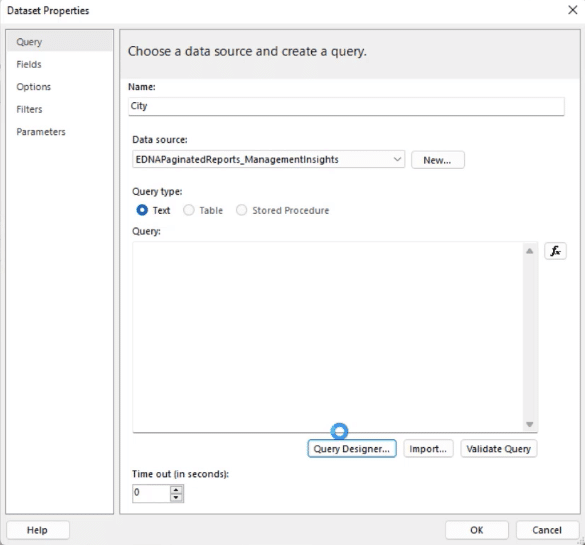
Write the dataset name and select the data source. Then, click Query Designer.
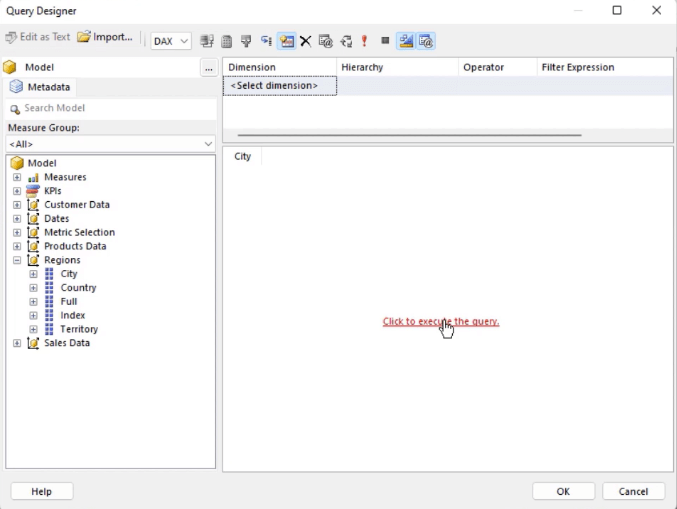
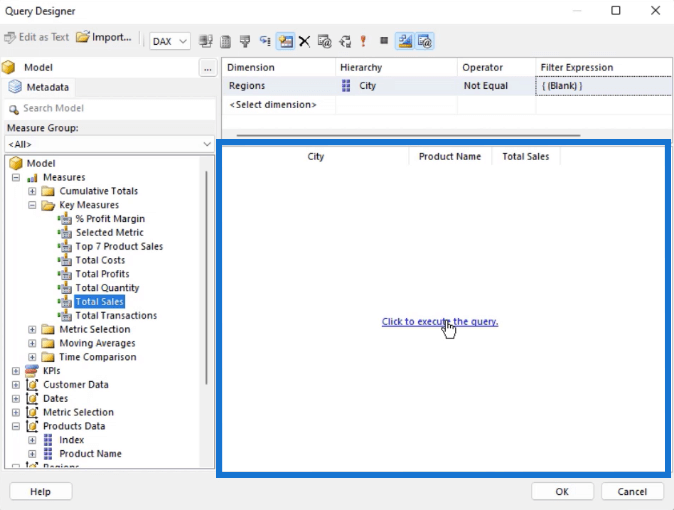
Click Regions and drag the City field to the blank space. Then, select the Click to execute the query option.
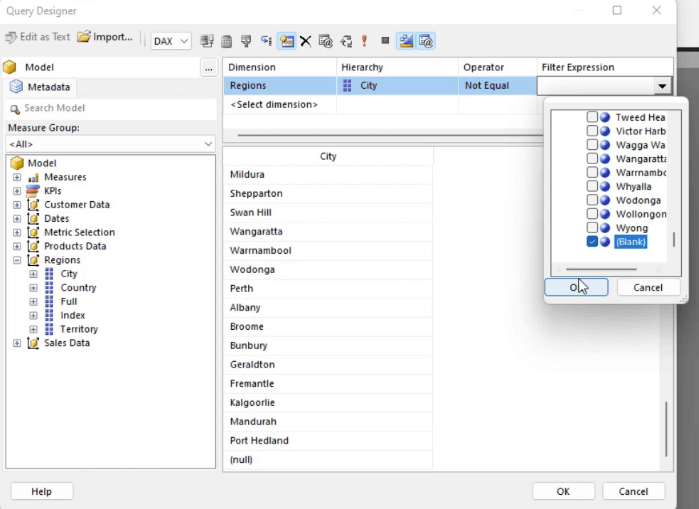
At the bottom of the column, you can see that it has a null entry. You need to remove it or else you’ll get an error.
To remove null or blank values, drag the City field to the Dimension pane and filter out the unnecessary values.
The Query Designer automatically creates a DAX code depending on the fields and filter you applied.
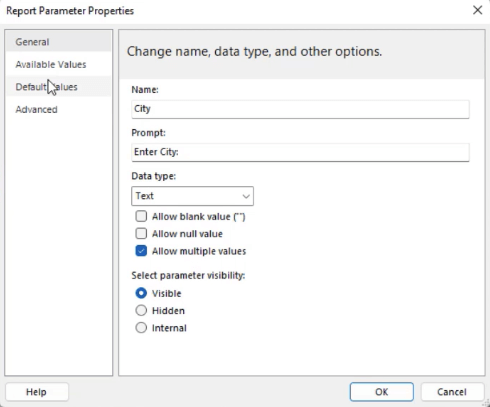
Next, right-click on the Parameters folder and select Add Parameter. For this example, the parameter name is “City” and the Prompt is “Enter City:”. It’s also recommended to enable the Allow multiple values option, because this will allow you to check more than one selection per parameter.

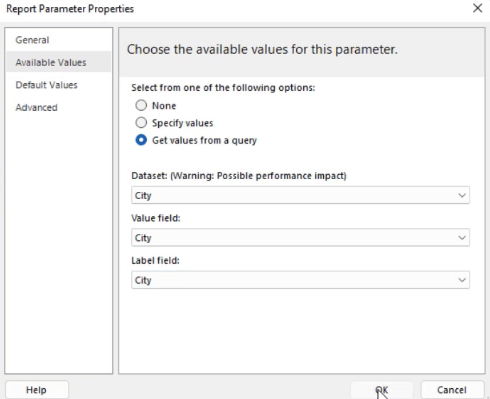
In the Available Values tab, select Get values from a query and then choose City for all the drop-down boxes. Then, click OK.
If you click Run, you’ll notice that the new parameter won’t have any effect on the report. This is because you haven’t established a relationship between the parameters.
For this example, you need to enable the City parameter and link it to the Product parameter.
Connecting Two Or More Parameter Filters In Power BI Report Builder
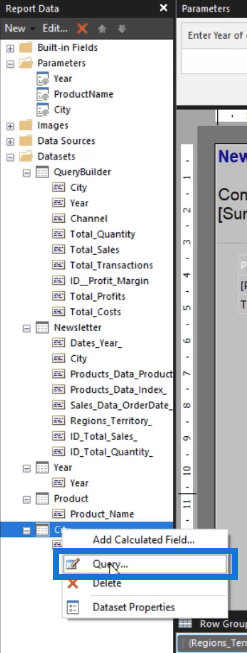
Right-click on the City dataset and select Query.
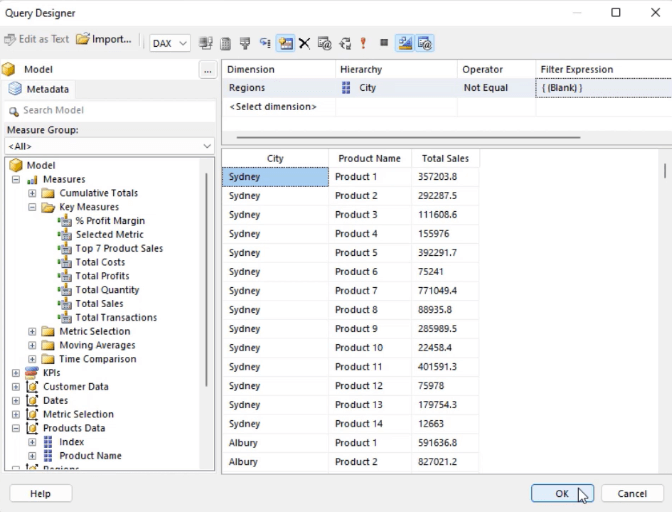
In the Query Designer window, drag the Product Name and Total Sales measure to the query text box. Then, Run the query.
The Total Sales acts as the connection between the City and Product Name.
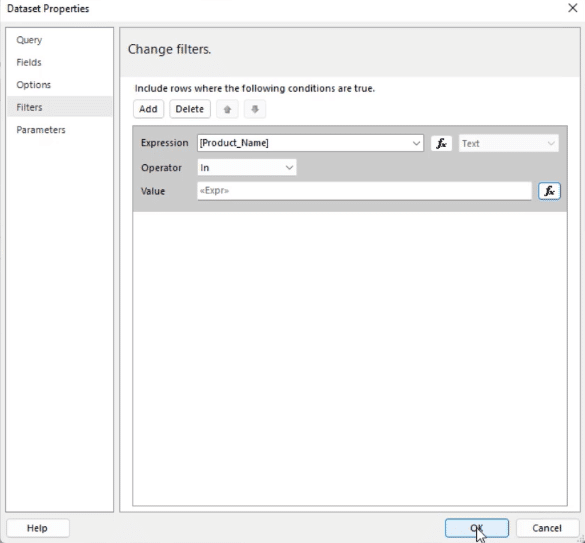
Next, open the Dataset Properties wizard for the City dataset. Go to the Filters tab and add a filter. In the Expression, select Product_Name. For the Operator, use In. This operator allows you to filter within arrays. Then, click the fx button to input the value.
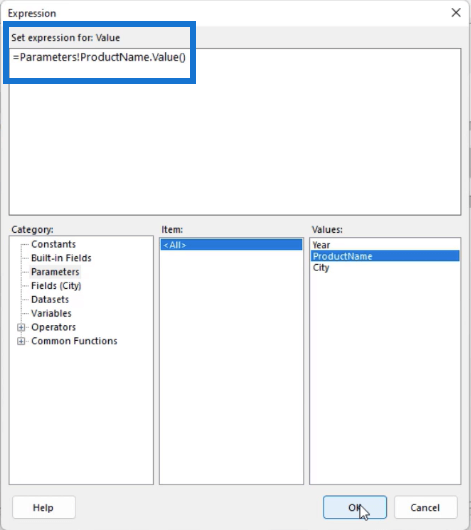
This opens the Expression Builder tool in Report Builder. Double-click the Parameters option under Category and select ProductName for the Values. The zero (0) in the expression is an index placing. You need to delete it so that the report will display all the data from the array.
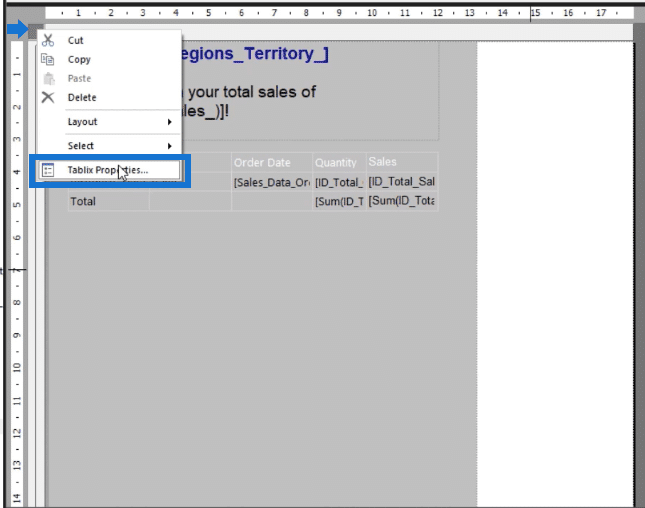
Next, click on your report and select Tablix Properties.
In this example, the header and table are contained in a list. So for every filter you add in your report, all the elements in the list will be affected.
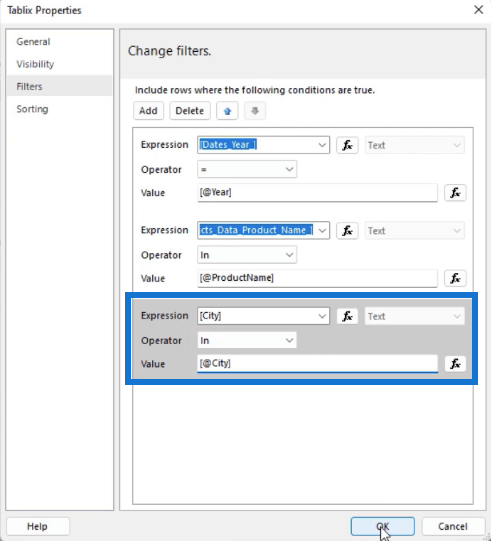
Go to the Filters tab in the Tablix Properties wizard and click Add. In the Expression, choose City. Then, select In as the Operator, and for the Value, write [@City].
Run the report after you press OK.
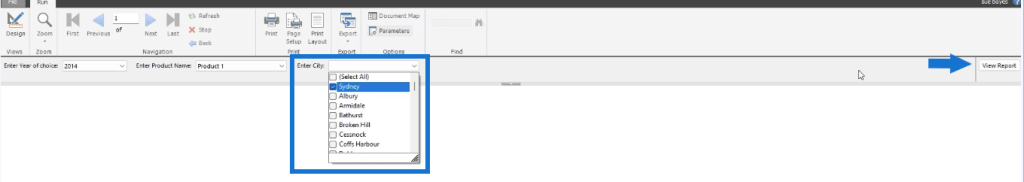
You’ll be asked to choose from the new parameter before you’re able to view the paginated report. Once done, click the View Report button.
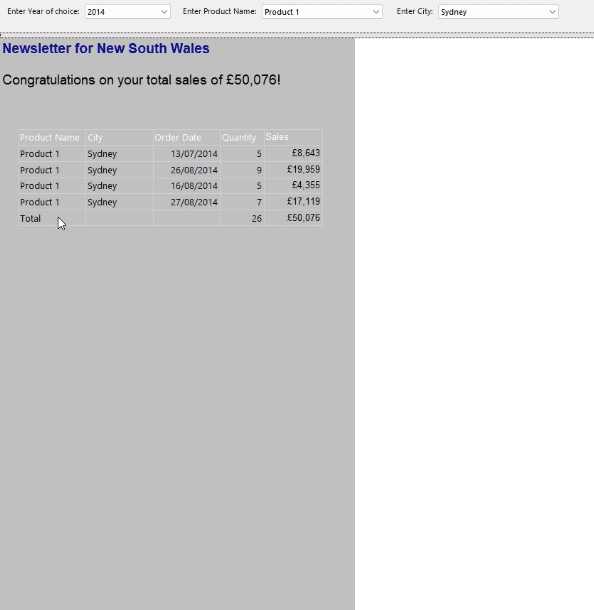
You’ll see that the paginated report only contains data that’s within the parameters you chose.
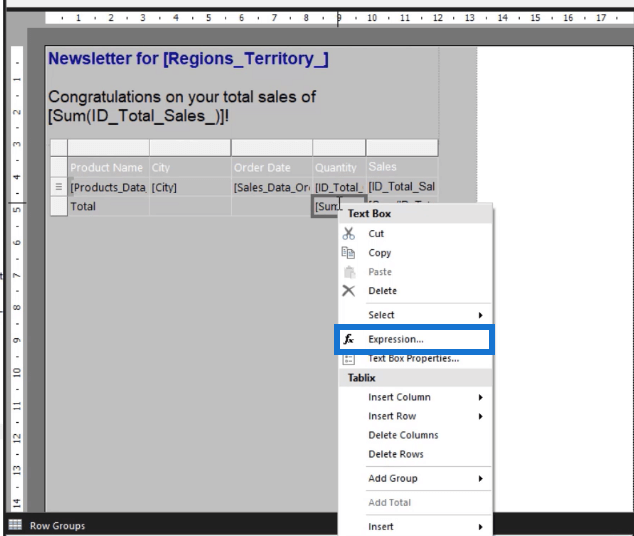
Additional Lesson: Adding A Row Showing Column Total
To add a total for each column in your matrix, add a new row. Then, right-click on the cell you want to place the total amounts in and select Expression.

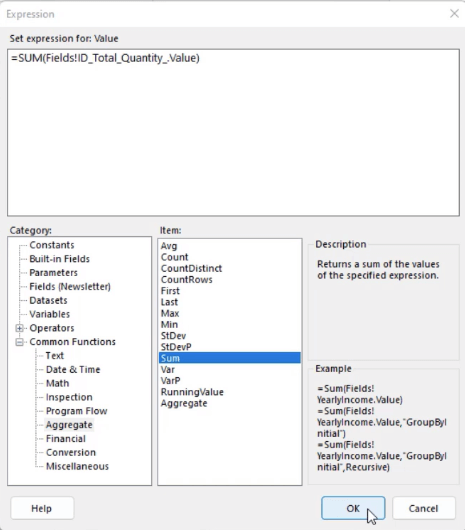
Under Category, choose between different Common Functions that contain specific Items that will allow you to create a query.
To create a query for the Total, click Aggregate and then choose Sum. On the bottom-right side, you’re provided with examples on how to use each function. Follow the format to get the total sum for each field.
***** Related Links *****
How To Format Data In Report Builder
Report Builder Tutorial: How To Add A Table
How To Import Datasets Into Report Builder
Conclusion
This tutorial discussed how to create cascading parameters in your paginated report. To summarize, cascading parameters create a connection for each filter in Power BI Report Builder.
In the example shown above, the City parameter is linked to the Product Name through the Total Sales measure. That is, the City filter will only show Products with a Sales history. This feature allows end users to aggregate data and better manage report information.
Remember that order is important when dealing with cascading parameters. So when choosing the filters, keep in mind that the hierarchy in which you select them affects the results that appear in the report.
All the best,
Sue Bayes


