Now, let’s delve deeper into one of the most important concepts in Power BI calculations — the aggregations.
Power BI aggregations are formulas used to calculate a single summarized value from multiple rows that are grouped together.
There are different ways to create aggregations in Power BI. Some of the examples of aggregation functions are the AVERAGE, COUNT, MIN, and MAX functions.
In the next sections, I’ll discuss some of them and explain how the said aggregations work.
Using Power BI Aggregations For Simple Calculations
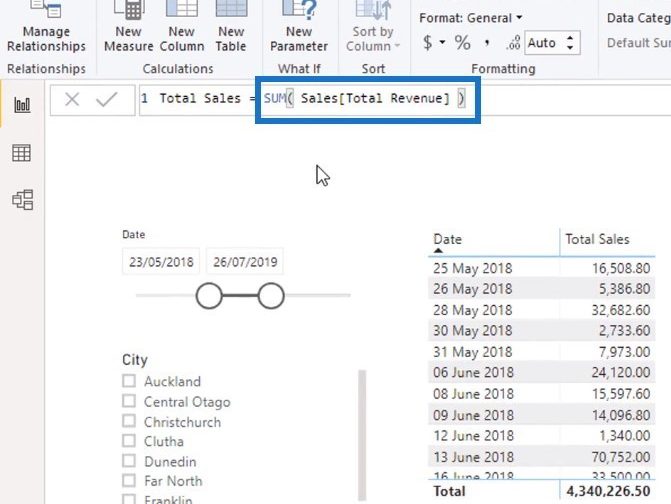
In the example below, you can see that the formula for Total Sales contains a SUM function. This is an example of an aggregating formula.

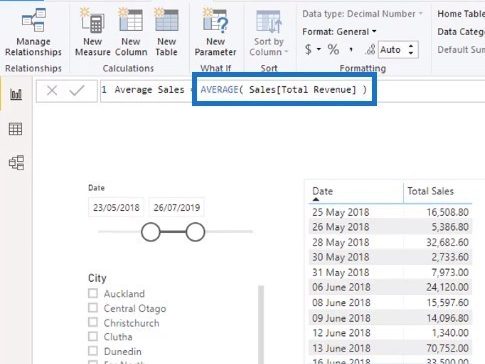
To create another aggregating formula, click New Measure and use it to calculate for the Average Sales.
Obviously, you’ll have to use the AVERAGE function which is one of the most common examples of aggregations.

After creating the new measure, drag it to the table. You need to look at the initial context to clearly understand the average sales data. You can find the initial context from the City filter as well as the Date slicer.
If you click Hamilton from the City filter, you’ll know that the results you see in the table are from that particular city.

In another example, let’s calculate the total transactions using the COUNTA function. You have to use COUNTA instead of COUNT function because the Order Number column is considered a text column.

After creating the formula, drag the said measure to the table to see the results.
Placing it beside the Average Sales table can help you compare the total sales for the corresponding number of transactions.
Now, why is the COUNTA function considered an aggregation function? Well, it is an aggregating formula because it is the first context that is added before considering the other calculation engines.
For example, there’s no filter that is selected from the City filter so the only initial context is the dates. Therefore, the results on the 23rd of May, 2018 are based on all the available cities.

Working Out The Data Model
Now, let’s take a look at the data relationships in the model based on the formula for Total Sales.
In the data model, you’ll see that the filter comes from the Dates table going to the Sales table through a filter propagation.

Once the said filter is active, the Sales table runs its evaluation to calculate the total revenue. This is because the formula references the Total Revenue column in the Sales table.
The SUM aggregation function evaluates every single row of the Total Revenue column after the initial context.

The same logic is true for the AVERAGE function. It evaluates all of the sales in the current context (e.g. date) then looks at every row of the Total Revenue column before getting its average.
In addition to that, the formula for Total Transactions works the same. The COUNTA function evaluates all the rows under the Order Number column. After that, it counts the numbers based on the initial context.
That’s basically how aggregations work inside Power BI in terms of DAX calculations.
Using Other Power BI Aggregations
Another set of aggregating formulas that you can encounter are the MIN and MAX functions.
To give you an example of how these aggregation functions work, let’s make a new measure.
Name the measure as Max Sales and use the MAX function to calculate the maximum total revenue.

Again, drag the new measure and place it inside the table. As you have noticed, the formula still references the Total Revenue column of the Sales table. But this time, the results have changed because we now use a different function.
When you select a city from the filter, for example the Turanga region, the data in the table also changes. This is because the MAX function summarizes the values based on the given context.
***** Related Links *****
Introduction to Filter Context in Power BI
The Difference Between SUM vs SUMX In Power BI
How the DAX Calculation Engine Works
Conclusion
Learning about aggregations is one of the crucial steps in understanding how DAX calculations work.
Most of the formulas are easy to run inside an aggregating formula. Things will only start to get trickier once you start using iterating formulas.
In the next tutorial, let’s learn about iterating functions and how to use it for more flexible calculations.
I hope you’ve picked up some helpful tips here. I can’t wait to show you more in our next tutorial.
Thanks!
Sam


