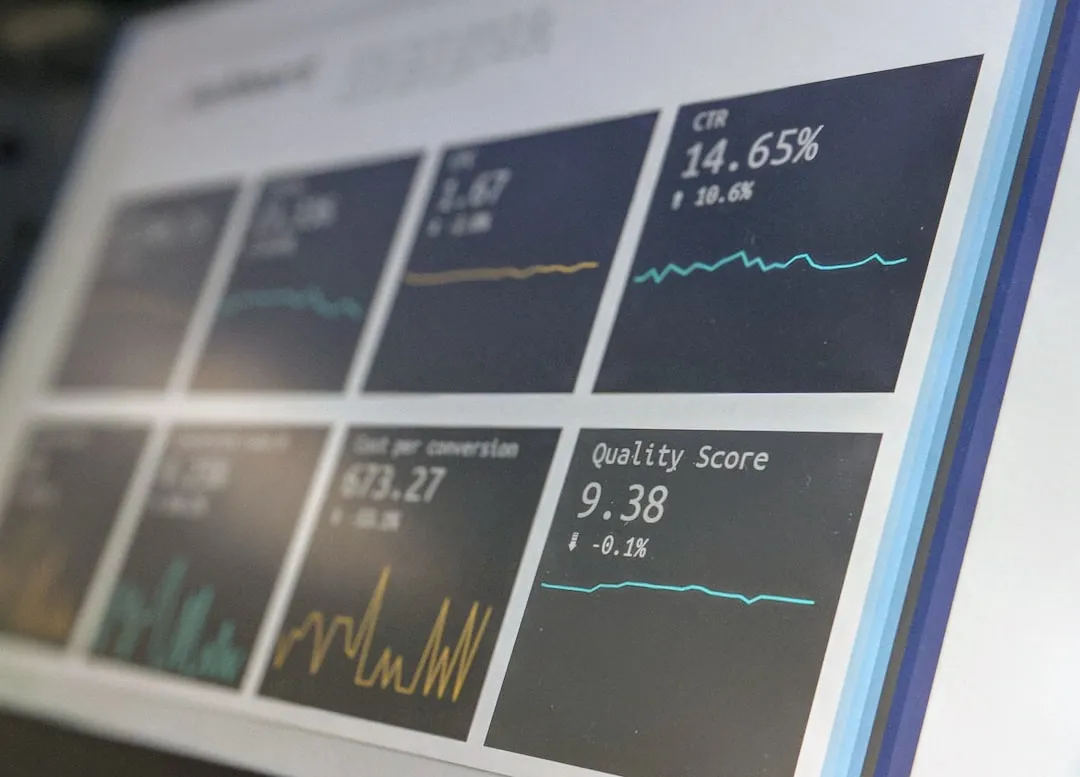
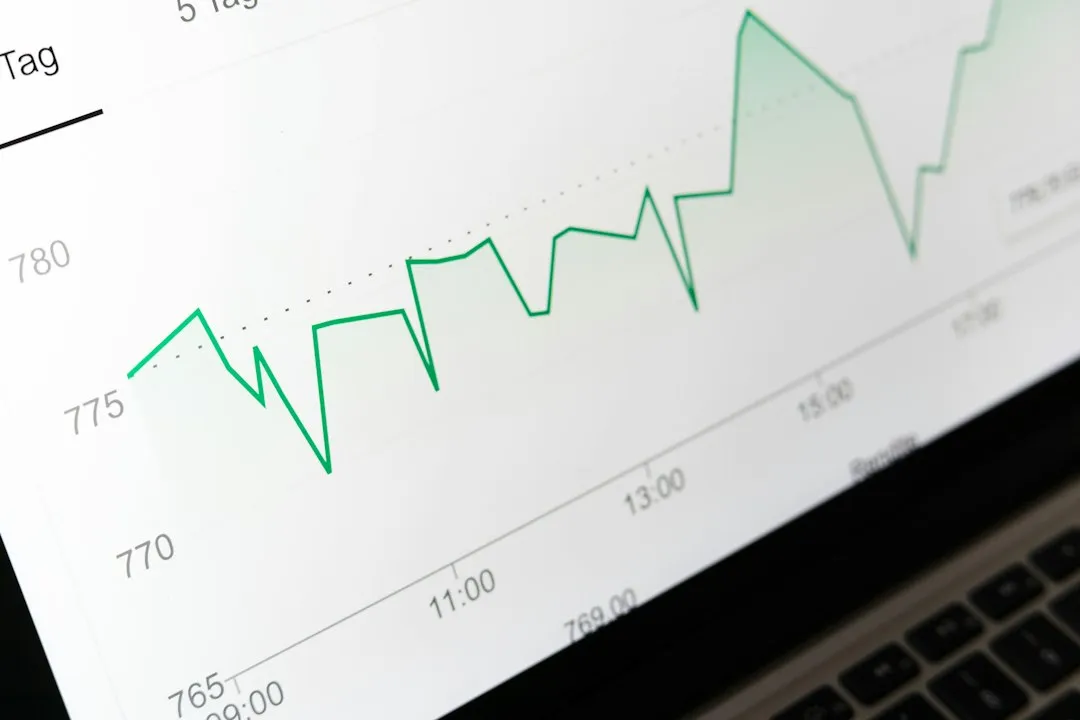
In today’s data-driven world, the role of data analytics has never been more crucial. Data analytics is the process of examining and interpreting data sets to uncover valuable insights, patterns, and trends.
These insights can be used to make more informed business decisions, drive innovation, and gain a competitive edge.
Data analytics allows organizations to:
- Understand customer behavior and preferences.
- Identify and mitigate potential risks.
- Optimize business processes.
- Forecast future trends and market demands.
- Personalize products and services.
The ability to harness the power of data and turn it into actionable insights is a game-changer in nearly every industry, from healthcare and finance to retail and education.
With the right tools and strategies, data analytics can drive growth, improve efficiency, and create a more sustainable future.
But, how do you apply this science to your work, and what tools are available to make it all happen?
Let’s explore things further
Understanding Data Analytics

There are various stages and techniques involved in data analytics, and it can be categorized into several different types.
The four key stages of data analytics are:
- Descriptive Analytics: This is the initial stage of data analytics, where raw data is collected, processed, and analyzed to understand what has happened in the past. It helps organizations gain insights into their historical data, identify trends, and understand the current state of their business.
- Diagnostic Analytics: Diagnostic analytics is the stage where data analysts delve deeper into the data to identify the reasons behind specific events or trends. It answers the question of why something happened and helps organizations understand the factors that contributed to their past performance.
- Predictive Analytics: This stage of data analytics uses statistical models and machine learning algorithms to forecast future events and trends. By analyzing historical and current data, organizations can make predictions about what is likely to happen in the future, allowing them to anticipate potential opportunities or risks.
- Prescriptive Analytics: This final stage of data analytics focuses on providing recommendations or actions that organizations should take based on the insights gained from the previous stages. It not only predicts what will happen but also offers guidance on what should be done to achieve a desired outcome.
Now that we’ve looked at the key stages of data analytics, let’s explore some of the techniques that you can apply to your work.
Data Analytics Techniques

Data analytics involves the application of various techniques to process, interpret, and visualize data. Here are some of the most common data analytics techniques:
- Data Mining: This technique involves analyzing large datasets to identify patterns, relationships, and anomalies. It is used to discover hidden insights and extract valuable information from the data.
- Text Analytics: Text analytics focuses on analyzing unstructured text data, such as social media posts, customer reviews, or emails. It uses natural language processing (NLP) and machine learning to extract meaning and sentiment from the text.
- Statistical Analysis: Statistical analysis involves applying mathematical models and techniques to analyze data. It is used to identify trends, make predictions, and quantify the level of confidence in the results.
- Machine Learning: Machine learning is a subset of artificial intelligence that enables systems to learn from data without being explicitly programmed. It involves training models on historical data to make predictions or decisions.
- Visualization: Data visualization techniques are used to represent data visually, making it easier to understand and interpret. Common visualization methods include charts, graphs, and maps.
By using these techniques, data analysts can gain valuable insights from the data, enabling organizations to make more informed decisions and take appropriate actions.
So, how do you get started in the world of data analytics?
Getting Started With Data Analytics

In today’s world, learning data analytics has never been more accessible and crucial for anyone in business. There are a wide variety of courses and training programs available that can help you get started with data analytics.
In addition, there are also free and paid software tools that you can use to start analyzing data. One of the most widely used tools in the world of data analytics is the data analytics platform, Power BI.
Power BI is a powerful business intelligence and data visualization tool that can help you create interactive reports, dashboards, and other visualizations from your data. It offers a user-friendly interface and a wide range of data connectors, making it easy to work with various data sources.
You can learn more about this in our article here.
Another popular tool is Google Analytics. Google Analytics is a free web analytics service that tracks and reports website traffic. It provides a detailed analysis of visitor behavior, including where they came from, what pages they viewed, and how long they stayed on your site.
Also, If you’re looking to build your career in data analytics, there are many job opportunities in the field.
Roles such as data analyst, data scientist, and business intelligence developer are in high demand. According to the U.S. Bureau of Labor Statistics, the demand for data analysts is expected to grow by 33% over the next decade, making it one of the fastest-growing occupations.
Final Thoughts
The importance of data analytics in today’s world cannot be overstated. In a world where data is being generated at an unprecedented rate, the ability to analyze and derive insights from this data is crucial for making informed decisions and gaining a competitive edge.
Whether you’re a business owner looking to understand your customers better, a student looking to kickstart your career, or a professional looking to upskill, data analytics has something to offer everyone.
With the right tools, techniques, and mindset, you can harness the power of data analytics to drive innovation, make smarter decisions, and create a more sustainable future.
Now is the time to embrace data analytics and unlock its endless possibilities, check out our FREE Courses.
More of a video learner, watch our latest clip on data visualization below:
Frequently Asked Questions

What are the top benefits of using data analytics?
The top benefits of data analytics include gaining a competitive advantage, improving decision-making, enhancing operational efficiency, and boosting customer satisfaction. With data analytics, you can make more informed decisions, identify new opportunities, and mitigate risks.
How can data analytics be applied in various industries?
Data analytics can be applied in various industries, including healthcare, finance, retail, manufacturing, and more. In healthcare, it can help improve patient outcomes and reduce costs. In finance, it can aid in fraud detection and risk management.
In retail, it can optimize inventory management and personalize customer experiences. In manufacturing, it can improve production processes and equipment maintenance.
What are the key steps to becoming a data analyst?
To become a data analyst, you should start by learning essential data analytics tools, like Python and R. You should also focus on developing skills in data visualization, machine learning, and statistical analysis.
It’s essential to work on real-world projects and build a strong portfolio to showcase your skills. Networking with professionals in the field and continuous learning are also critical to your success.
What is the role of data analytics in business decision-making?
Data analytics plays a crucial role in business decision-making by providing valuable insights into the company’s performance and market trends. It helps in identifying areas for improvement, potential risks, and new opportunities.
By analyzing data, businesses can make informed decisions that are more likely to lead to success and growth.
What are the differences between data analytics, data science, and business intelligence?
Data analytics focuses on analyzing historical data to gain insights and make data-driven decisions. Data science involves the use of advanced techniques and algorithms to extract knowledge and make predictions from data.
Business intelligence is the process of collecting, analyzing, and reporting on data to help businesses make strategic decisions.


