In today’s business world, conducting common customer behavior analysis is of utmost importance for many functional areas within companies. You may watch the full video of this tutorial at the bottom of this blog.
Analyzing consumer behavior serves as a tool to help plan and meet sales objectives.
Additionally, understanding buyer behavior helps decide where and how to better position products or services.
You can evaluate how your customers act and predict how they will behave in the future in a dynamic way using Power BI.
In this video tutorial, I will dive into some behavioral type analysis to work out the most common behavior from customers.
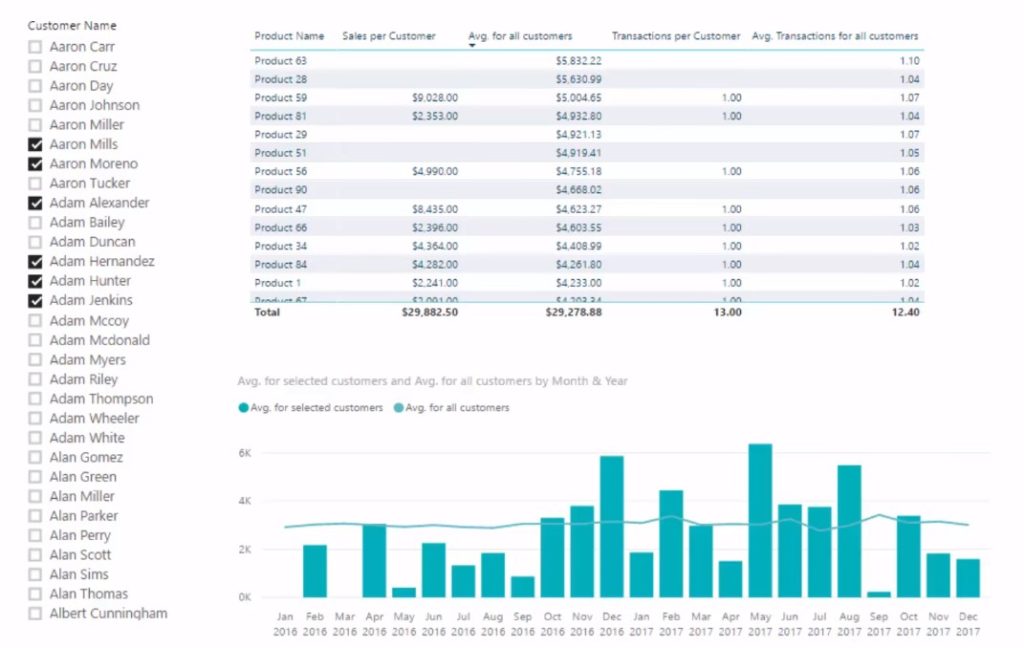
I’m going to run through how you can analyze behavior of particular elements in your data set. In this case, I want to analyze how much on average your consumers purchase based on your products through time. I also want to look at how many transactions on average our customers make on a particular product. So these are the behavioral-type answers that you can retrieve from your data sets.
The DAX formula is not terribly difficult, and the main thing you have to understand is iterating functions – or how you can iterate through a different dimension and then analyze the result of their effect based on whatever context you’re in.
Let me show you how I did it and hopefully you can have an insight that you might want to apply to your own analysis.
Average Sales Per Customer

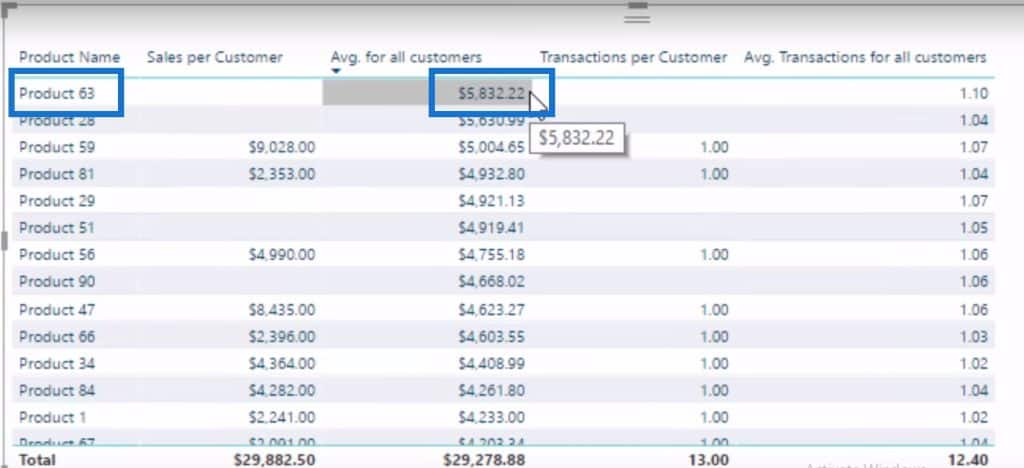
I want to see what are the average sales per customer for a particular product. For example, I want to see how much our customers get to spend on average on Product 63.

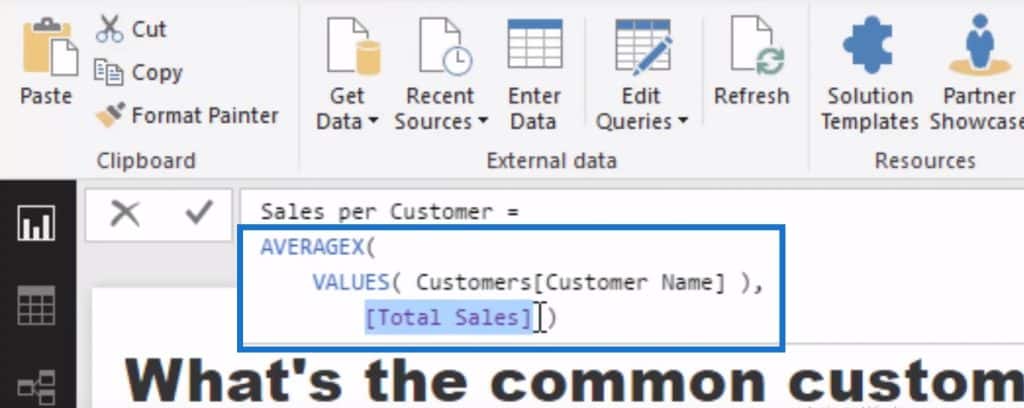
So how do I do it? First of all, we have to come up with a formula that says every single product will iterate through every single customer to evaluate the Total Sales that that particular customer makes, and then average that up. This is going to give us the average sales, but per customer.

If you think about it, you can also just use the Customer ID and you’re going to get exactly the same results.

It’s totally up to you how you do that, but it’s good to have a good understanding of what’s happening to the data model.
This is what VALUES does: we are going to iterate through every single customer who has purchased Product 63. We’re going to evaluate how much they bought and then it’s going to average it up with the AVERAGEX function.
Average For All Customers
This is going to be affected by whatever context we have on the Customer Name. So what happens is whenever I select any one customer or grouping of customers, the iteration only applies to the customer that we have actually selected.
This would only iterate through every customer if we got rid of any filter coming from this particular slicer.

This is what the Average for All Customers does; this will always be a number which does not change regardless of the selection you make in the Customer Name slicer.

What I did to come up with this average is to make sure that anything from the Customers table does not apply to the current context. This will allow me to iterate – regardless of selection – through every single customer and retrieve the sales.

This is how we can work out what is the common customer behavior and then compare it to a selection or a grouping of customers that we select. This is the part where it can get quite fancy in your analysis. Let’s say you are looking at all customers, but you also wanted to group those customers by region, or if they are a good or bad customer, or if they are a high margin or a low margin client.
Transactions Per Customer
You can also do this for transactions and have a look at your products on a whole from a behavioral perspective. I used exactly the same technique and calculated their total transactions on average for every single customer.

Then I went back and put that inside the CALCULATE statement with ALL. This gave me the overall behavior of every single customer in the data set and then we could compare it to whatever selection we made.

This is powerful stuff right here, and there are lots of applications for techniques similar to this. There are so many things you can achieve with Power BI simply by analyzing average customer behavior and then comparing it to a small subset.
***** Related Links *****
Power BI Data Sets: Learn How To Detect Abnormal Behavior Using DAX
Understanding How The AVERAGEX Function Works
Using Iterating Functions SUMX And AVERAGEX In Power BI
Conclusion
If you look at it on face value, it’s quite difficult to imagine how you can make a customer behavior analysis inside of Power BI. That’s the reason for this tutorial, where I do a deep dive into this type of insight.
First, you need to analytically think about how you want to achieve your desired result in Power BI. And then structure your model and DAX formulas by combining both ‘out of the box’ thinking and some practical applications.
There are many ways customer behavior analysis like this can benefit a business. Such insights can help you determine the actions and decisions you’ll implement from a marketing perspective and also for future logistical challenges.
For more examples around advanced business analytics. Check out the below course module from Enterprise DNA Online.
Enjoy learning about this analytical technique.
Sam
***** Learning Power BI? *****
FREE COURSE – Ultimate Beginners Guide To Power BI
FREE COURSE – Ultimate Beginners Guide To DAX
FREE – 60 Page DAX Reference Guide Download
FREE – Power BI Resources
Enterprise DNA Membership
Enterprise DNA Online
Enterprise DNA Events


