I’m going to show you some simple Power BI measures you can start with. These can give you a good foundation on what kind of insights Power BI can give you. Understanding these simple Power BI measures is key to easing into more advanced techniques later on.
One thing you have to remember if you’re just shifting to Power BI from Excel is that you won’t be working with individual cells here. Power BI lets you work on columns instead.
In Excel, for example, doing a simple SUM would mean working on individual cells. But in Power BI, you’ll be applying that SUM to entire columns. Once you understand this concept, it changes the way you build your reports from a formula perspective.
To show you how to work on those columns, I’m going to show you a few examples on how these simple measures work. You may watch the full video of this tutorial at the bottom of this blog.
Average Quantity Example
I’m going to start with an example of how I can get the Average Quantity.
I’ll click on the New Measure icon.
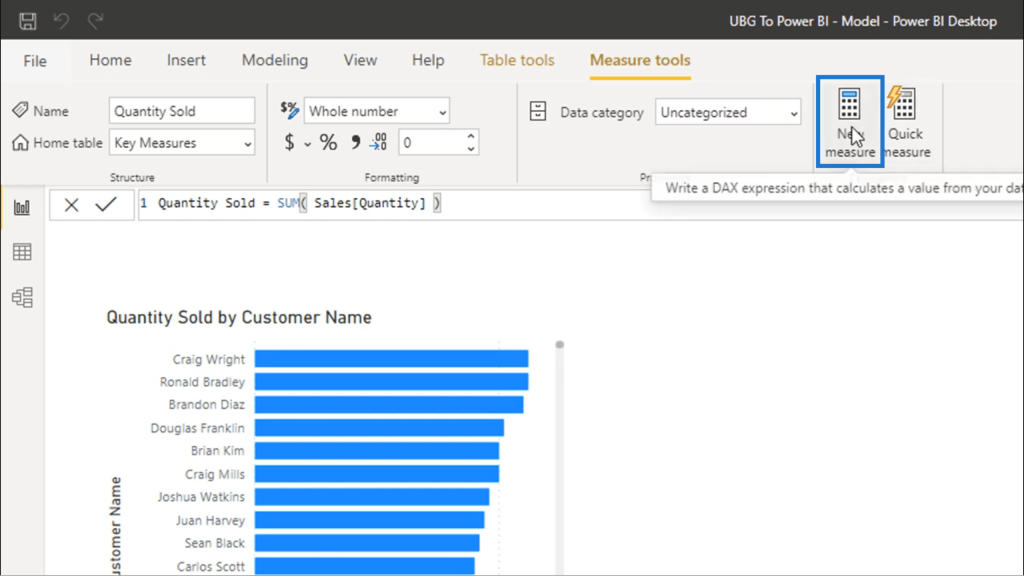
Note that before creating this measure, I made sure that I clicked on my Key Measures first, which is found in the Fields pane. This ensures that once my new measure is created, it lands right into that group.
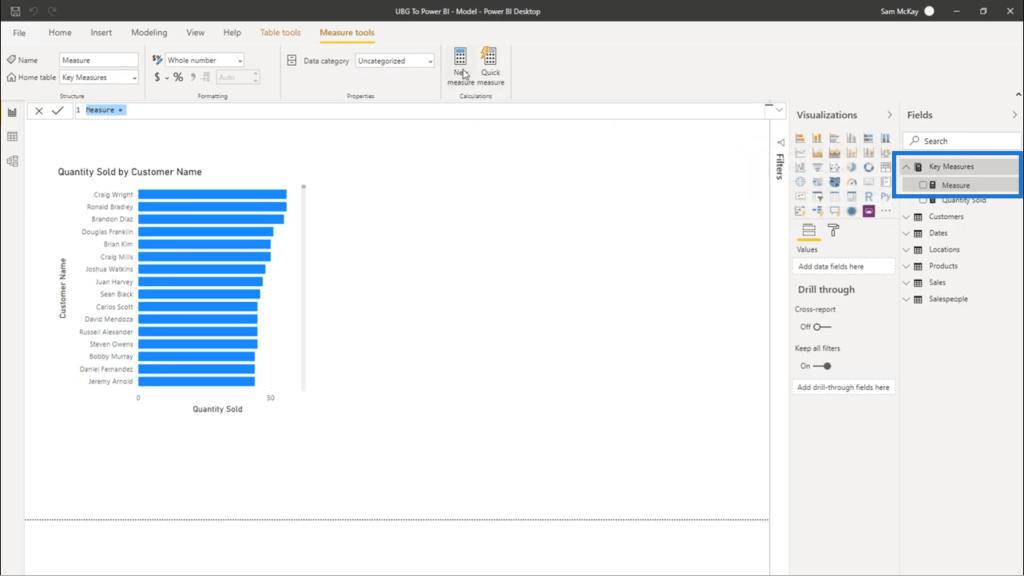
Average Quantity is just a form of simple averaging.
Using averages is a really simple way to create some of these easy to load formulas. As you can see, a few options automatically pop up when I start typing the word “average”.
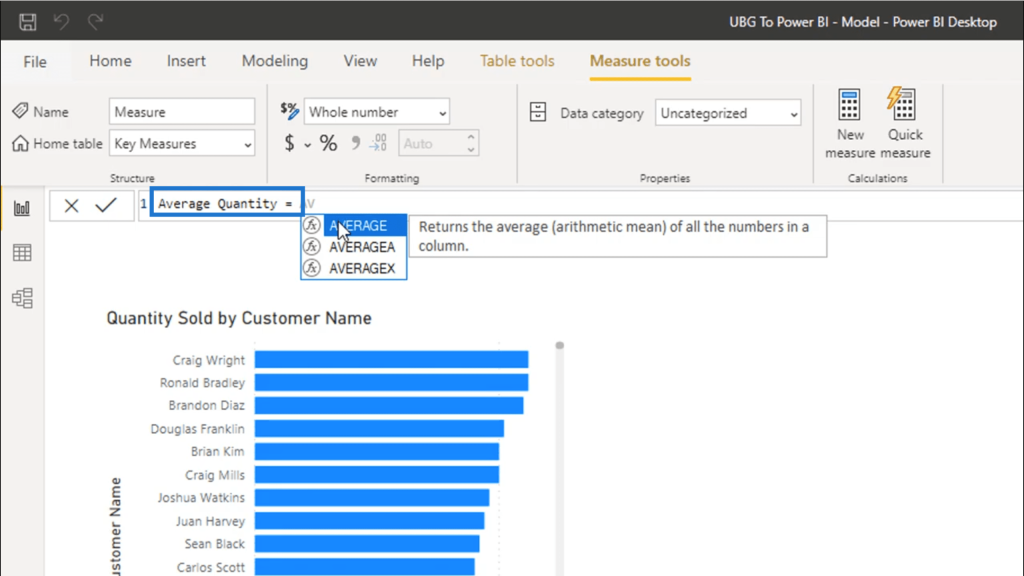
The moment I choose AVERAGE, you’ll see that it shows a description of the function. It tells us that this function returns the average of all the numbers in the column.
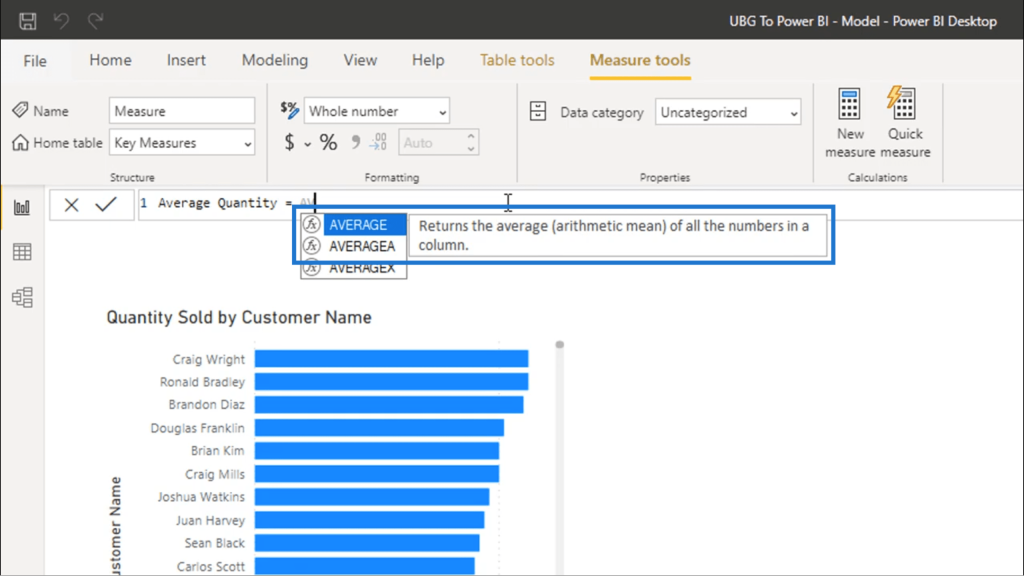
These descriptions are a great way to familiarize yourself with the different functions you can use in Power BI.
Once I input that function, it automatically gives me more details in terms of what parameters need to go inside it.
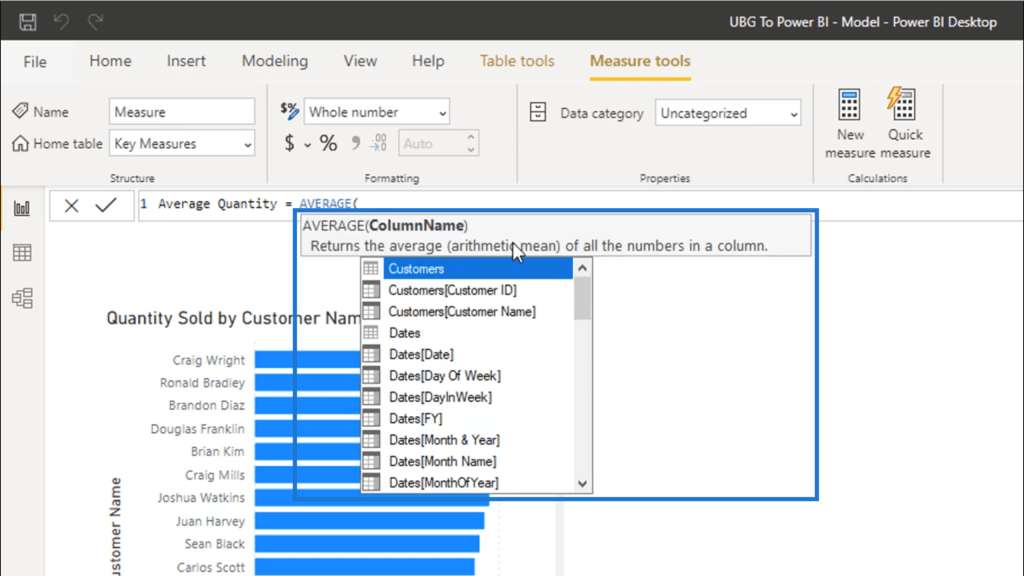
I’ll use the Quantity column in this example.
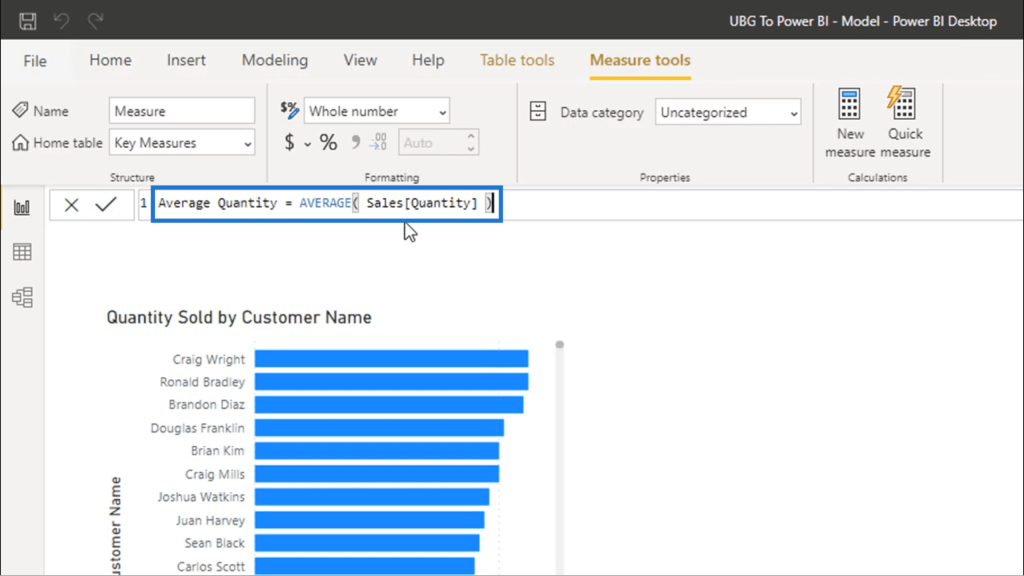
Once I hit enter, that measure will be saved into the Key Measures group.
One important thing to note here is that you’re dependent on the data you have. In this case, I only have my pricing and quantity data. So that makes my options a bit limited.
Just to show you other functions you can use here, you’ll see that you can also type in MIN and you have a number of options showing up.
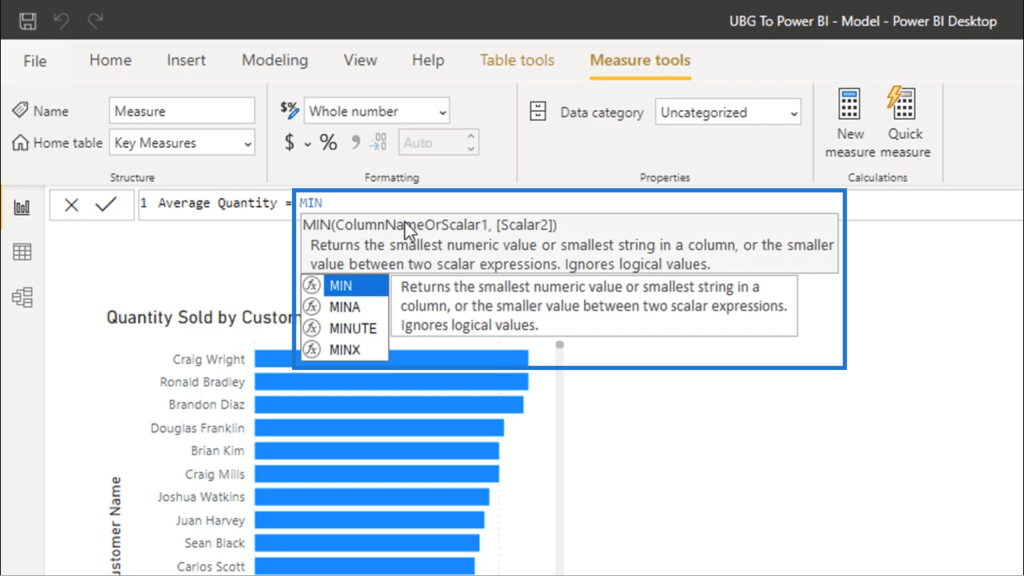
You can also try MAX.
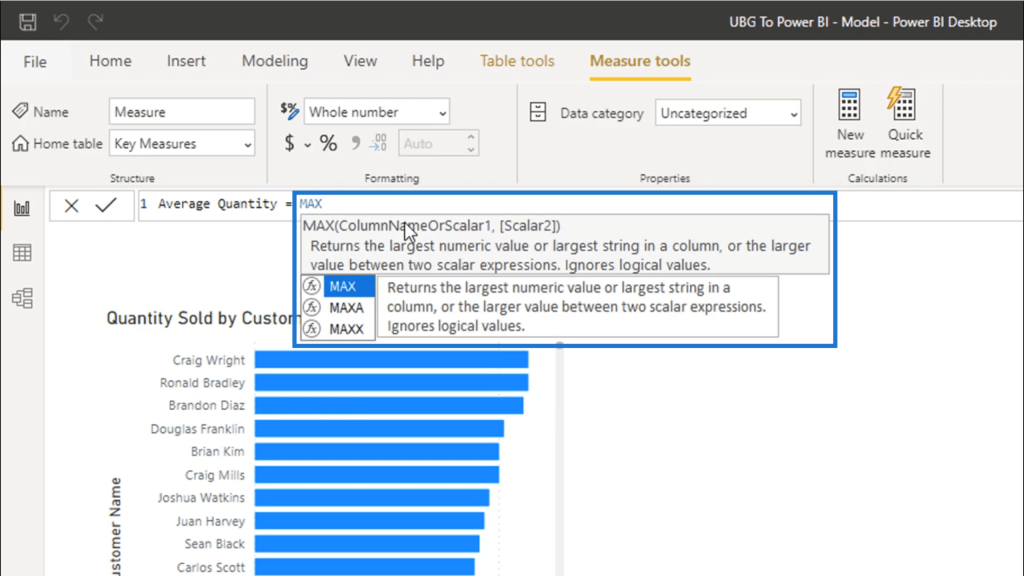
The other variations showing up for these functions are further covered in the different DAX courses available in Enterprise DNA Online. But for now, I’ll concentrate on the simplest ones.
Revenue Calculations Using Iterating Functions
Bringing in some revenue information is extremely useful. This will bring in additional data that would give me more insights for further analysis.
To find out whether I can do that, I need to check what kind of information I have inside my table.
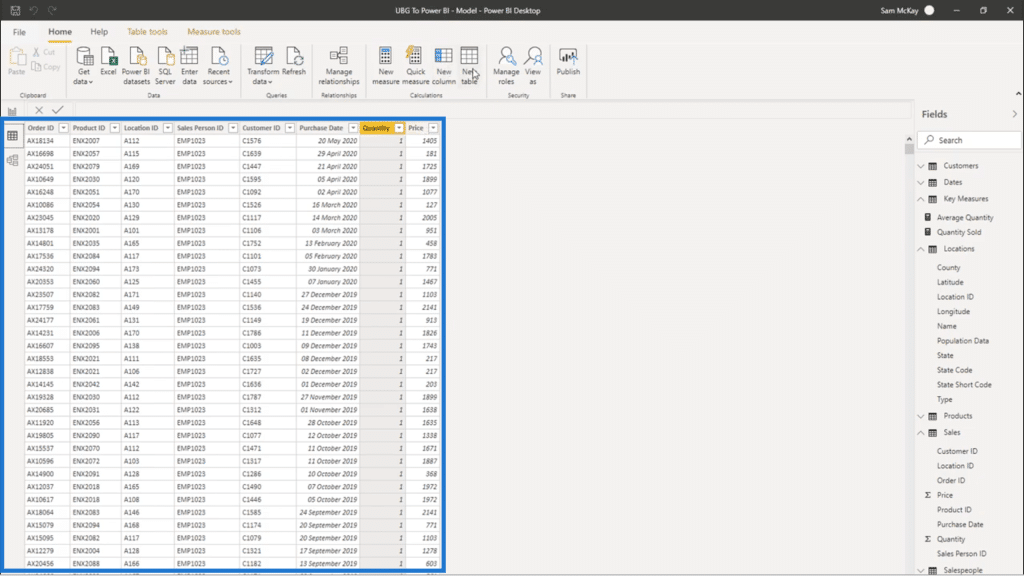
Looking at the data, it shows that I can add some revenue information because I have the Quantity and the Price.
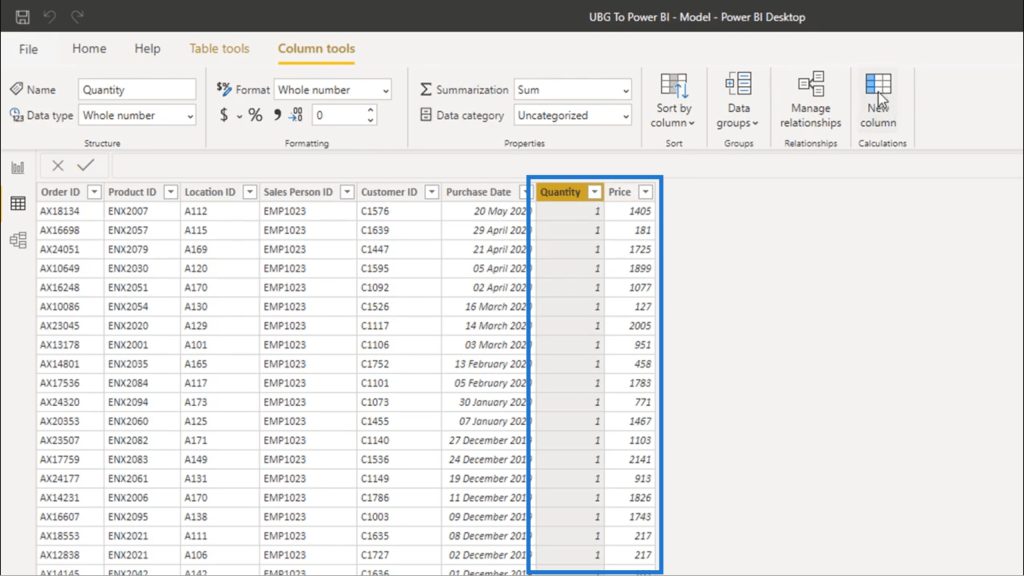
Since I want you to truly understand the importance of using measures instead of calculated columns, I’m going to show you a comparison of the two.
I’ll start off by creating a new column.
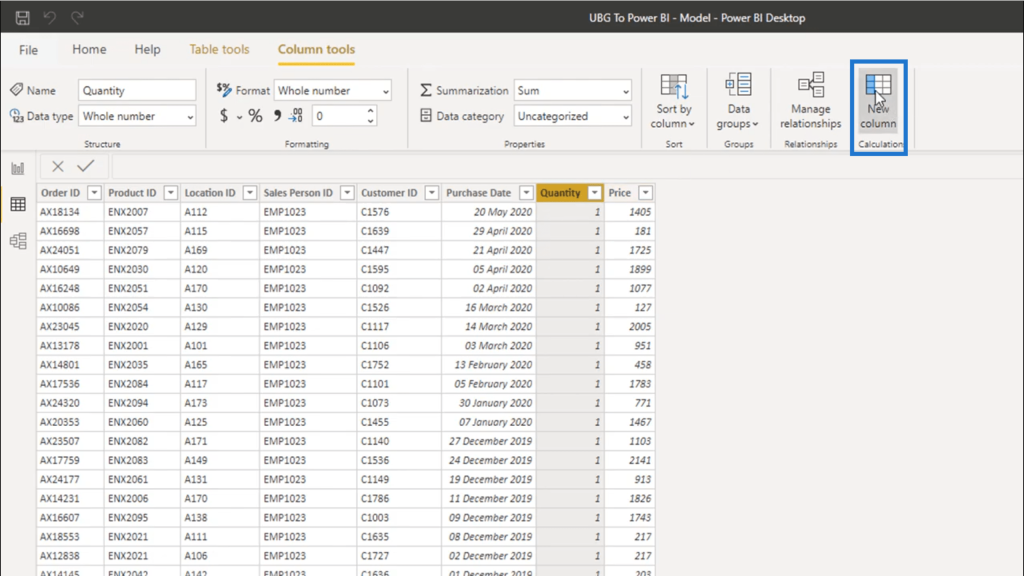
I’ll call this column Revenues.
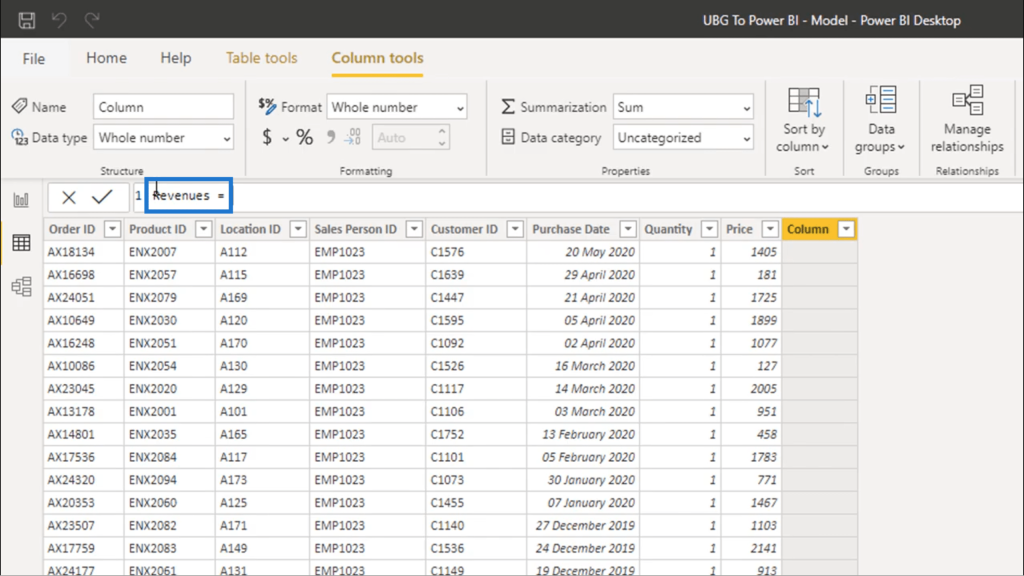
To get the revenue, I’m going to multiply Quantity by Price. Note that I’m referencing these specific columns from the Sales table because I’m physically adding data into the table directly.
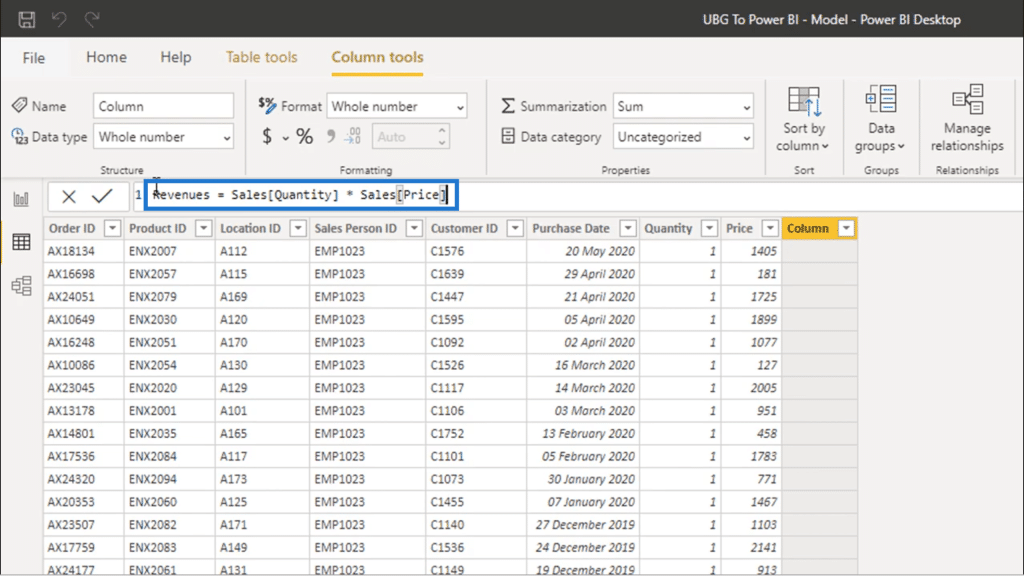
Once I hit enter, the Revenues column will give me numbers where I could apply the SUM function or maybe the AVERAGE function. This is a calculated column.
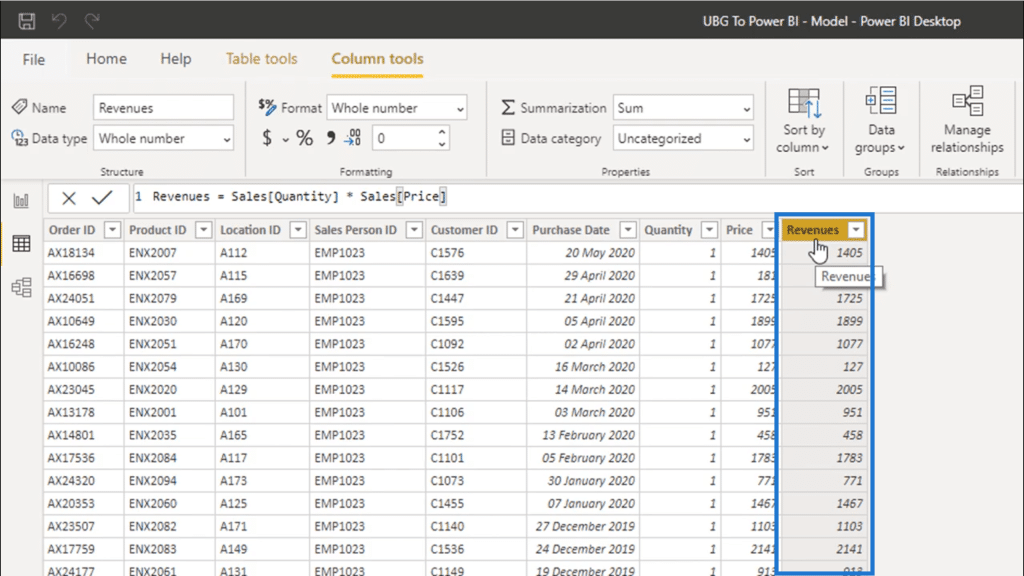
But I want to show you that you don’t need to create these columns to get the data you need. This is something that you would normally do in Excel, but the goal here is for you to see the advantage of using Power BI. You can do so much more by using virtual calculations as long as you know which formula to choose.
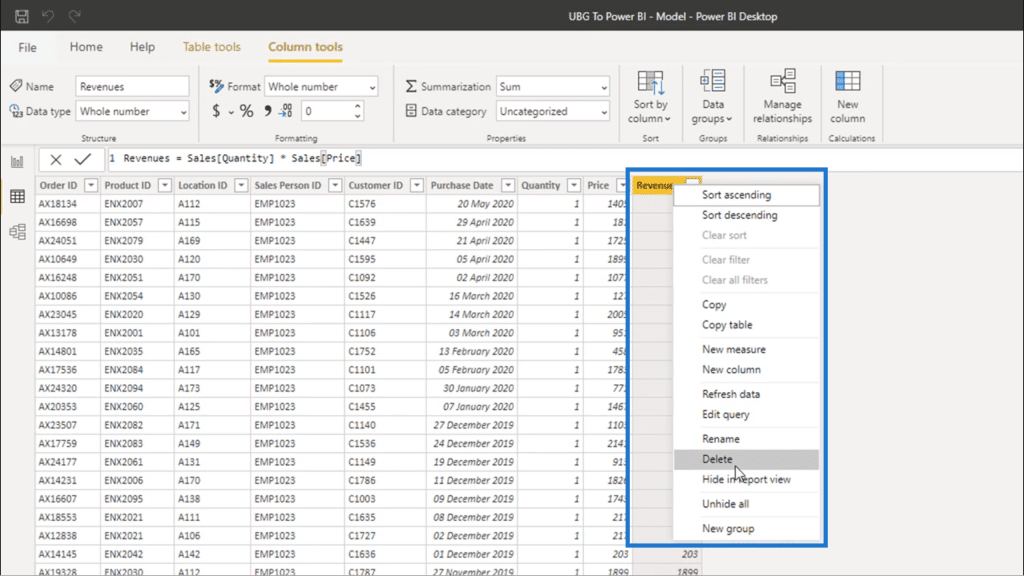
So I’m going to delete that column I just made.
Then I’ll add a New Measure by clicking this icon.
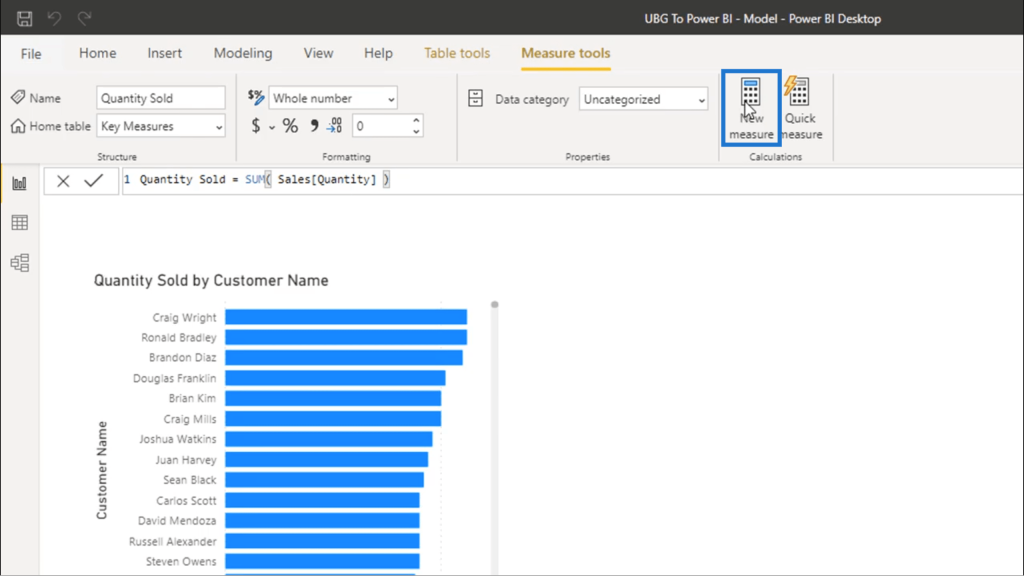
I’m going to call this Total Sales.
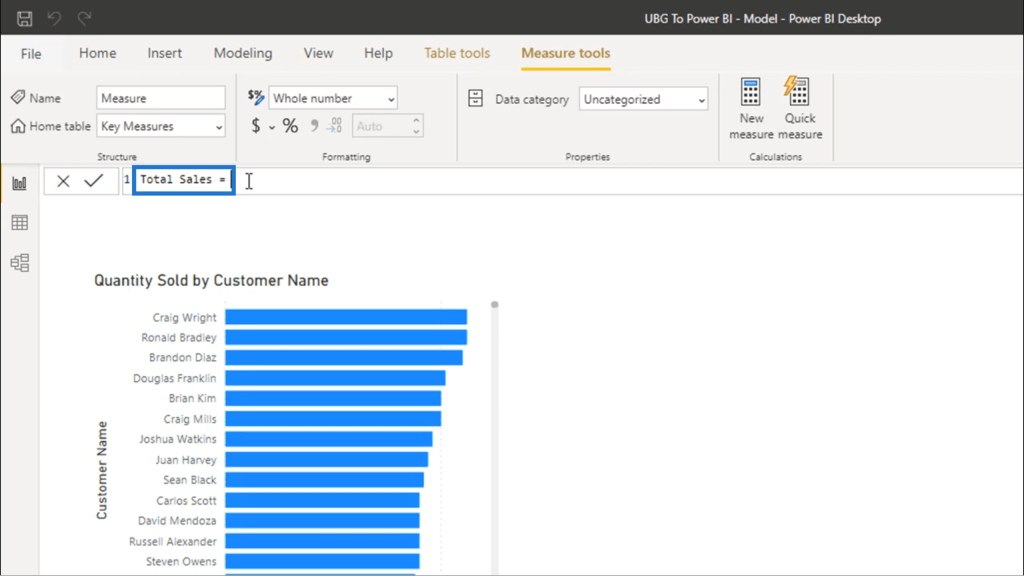
I am also going to add a new line to my formula by doing Shift + Enter. Then, I’ll use the SUM function, then I’ll do a SUMX.
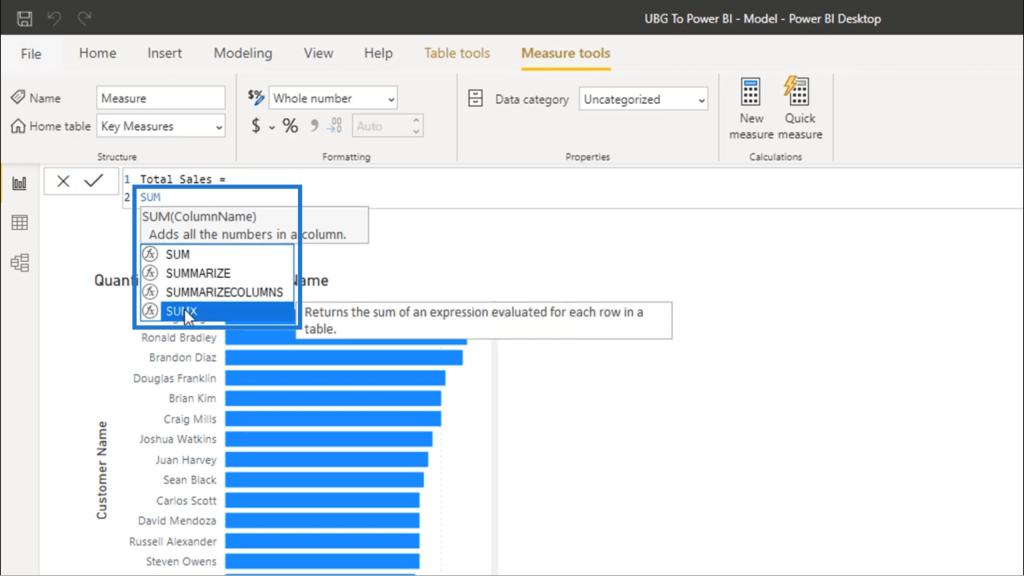
Before continuing, I want to briefly discuss what SUMX does. The basic principle behind SUMX also applies to other functions that have an X at the end of the name.
These functions with an X are called iterating functions. They allow you to run logic at every single row in any table that you specify.
In other words, it’s bringing what you would ordinarily do in a calculated column into a measure.
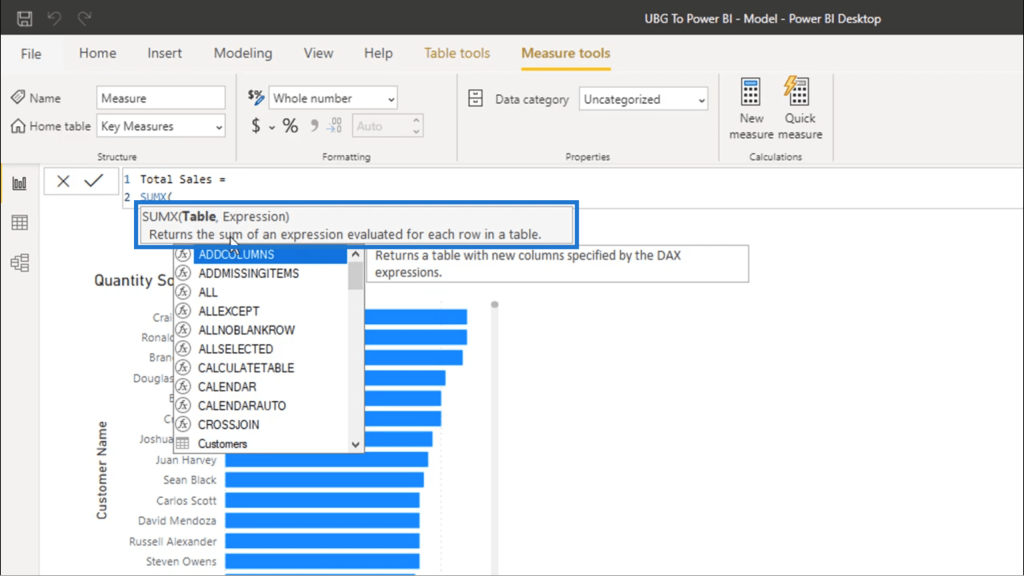
As you can see, it requires us to reference a table and an expression. The expression can be any kind of logic you have to use to get the results you want.
So I’m going to put Sales since I’m trying to recreate the calculated column I made earlier.
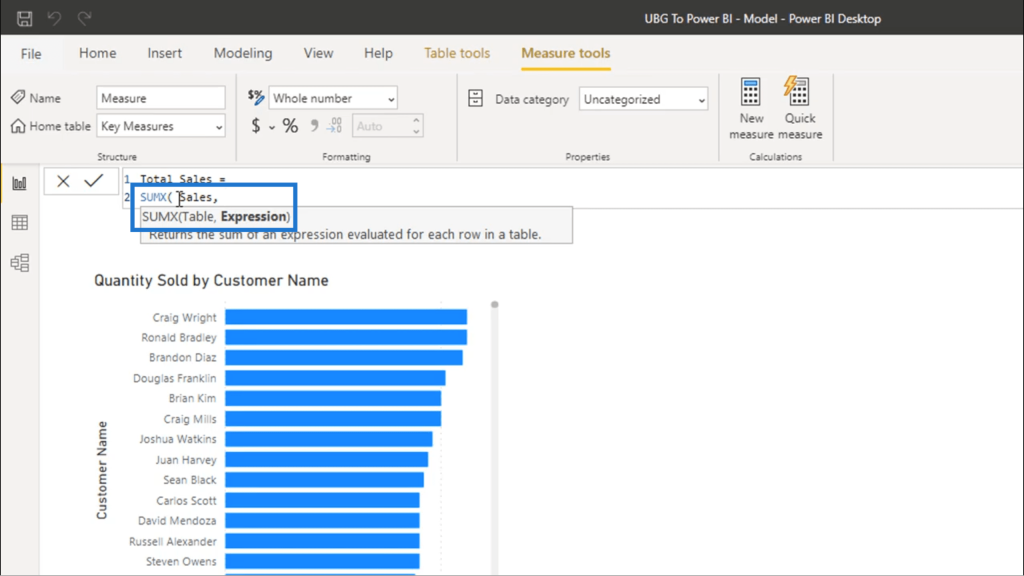
Then, I’ll use the Quantity times the Price.
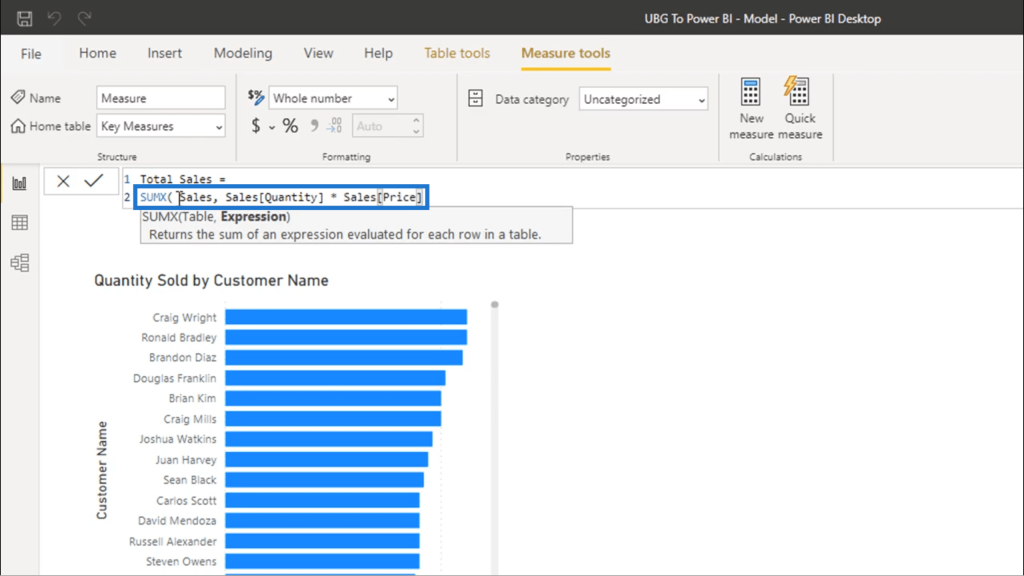
Once I press enter, that measure is now going to add the logic I just added into every single row.
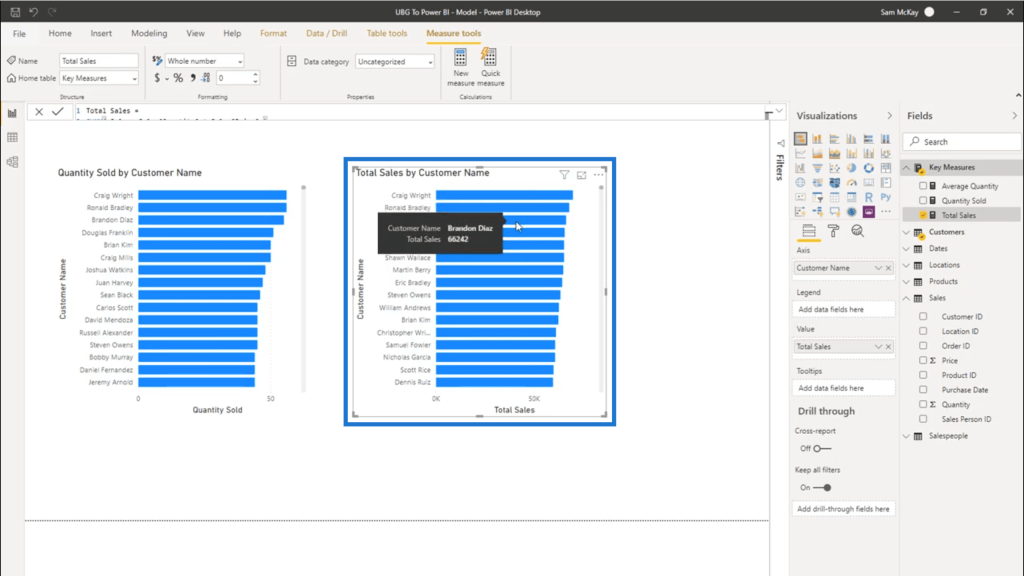
To show you the results, I’m going to copy and paste the original visualization.
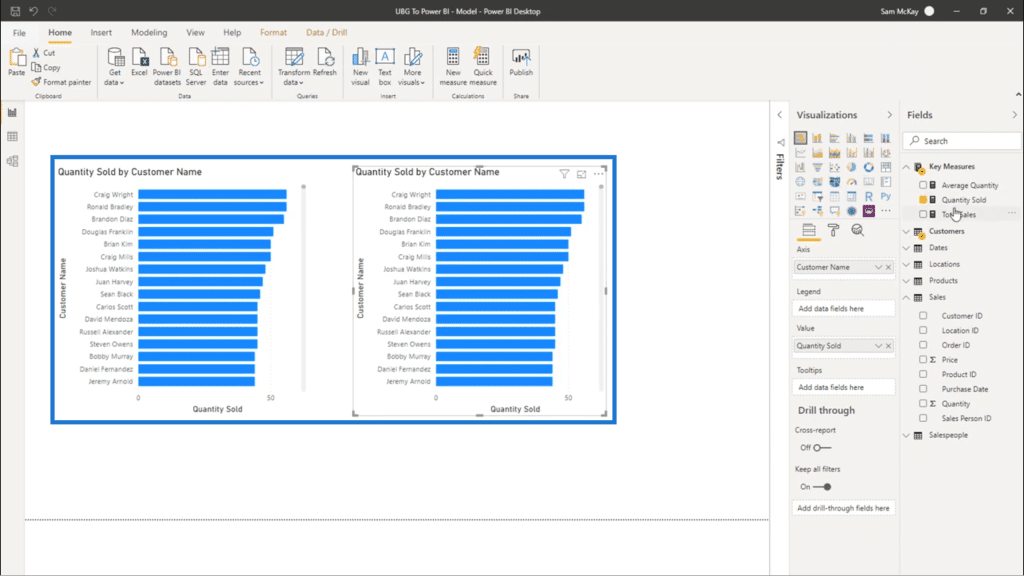
Remember that we have Quantity Sold under Value.
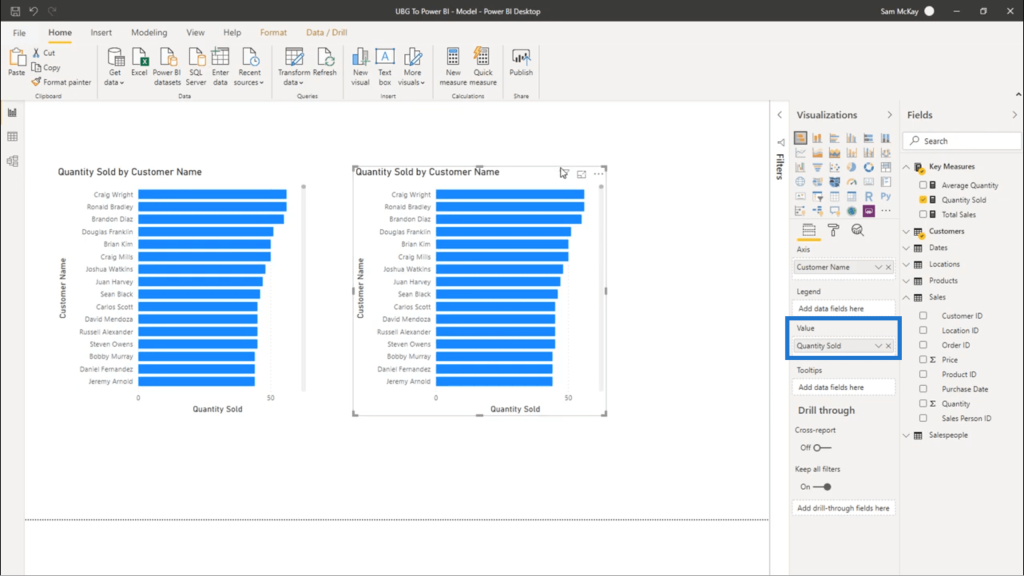
For the duplicate visualization, what I’m going to do is add Total Sales into Value.
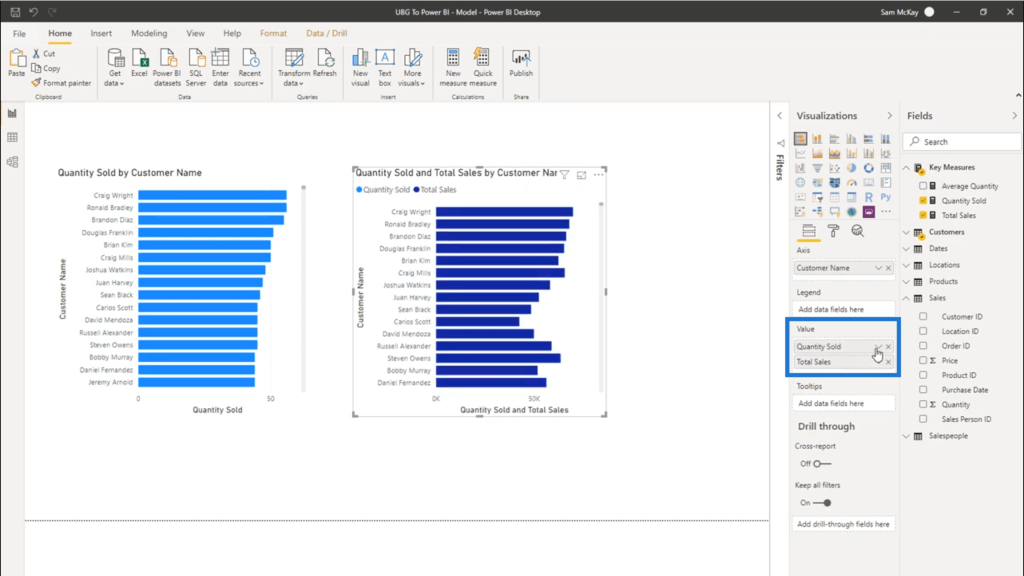
Then, I’ll delete Quantity Sold so that I only have Total Sales left.
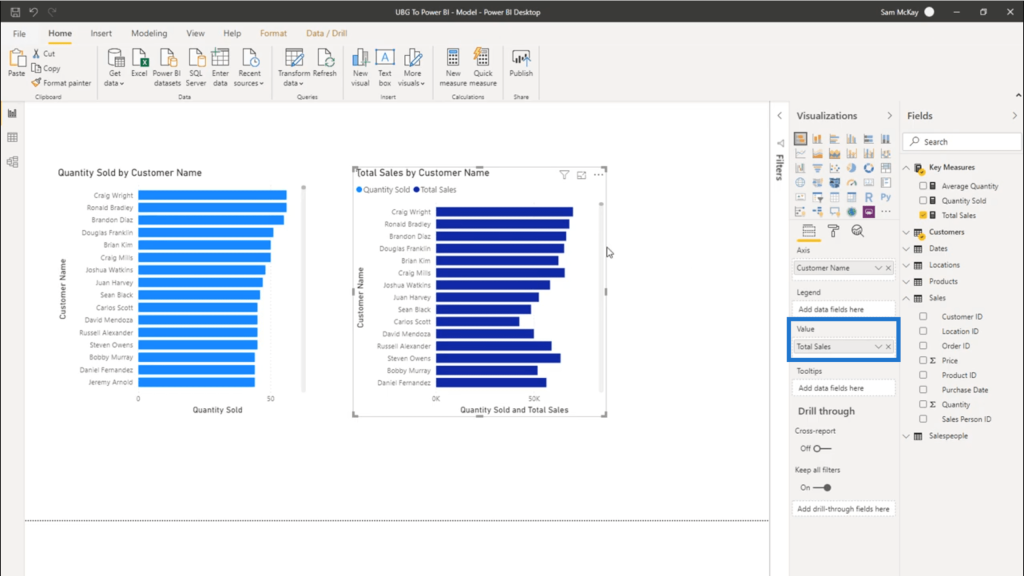
Now, the results that I’m showing is based on every filter put in place instead of just a one-time general calculation like what happens in a calculated column.
You can see that if you go into the modeling area.
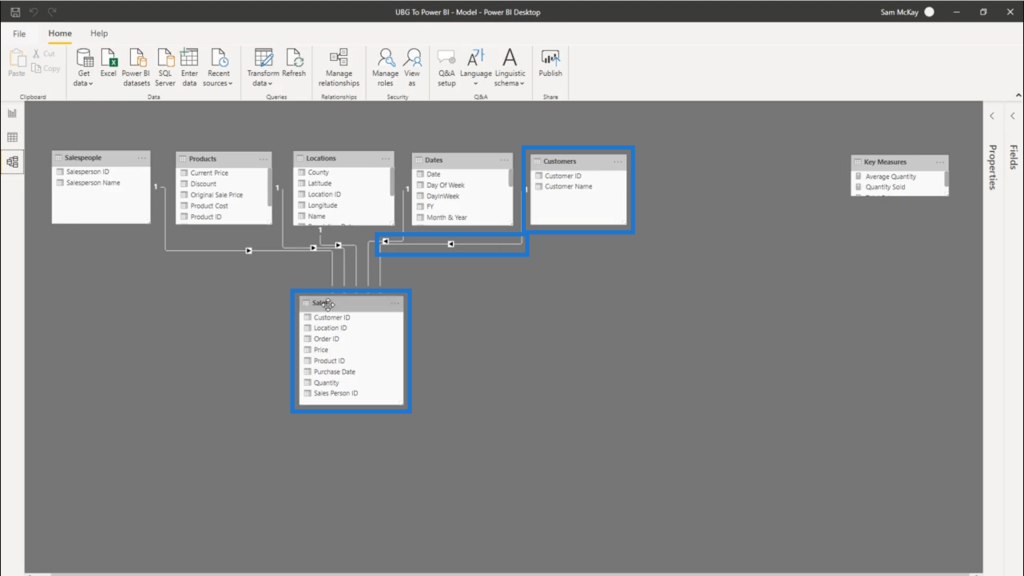
So the relationship flows from the Customers table where each customer is being filtered as it flows into the Sales table as represented by the arrow and the line. This means that I’m only looking at every single sale for that specific customer.
With this measure in place , I can now iterate through every single row. So in the table, the first row is going to compute for the Quantity times the Price. Then, it’s going to do the same thing on the second row, then the third, and so on. It’s going to continue doing that until it has gone through every single sale.
It basically commits each row’s result into memory. And once that’s done, it’s going to sum it all up. Those results are what’s showing up in the visualization below.
I also recommend that you turn your visualizations into tables when you’re starting out with measures instead of the usual charts.
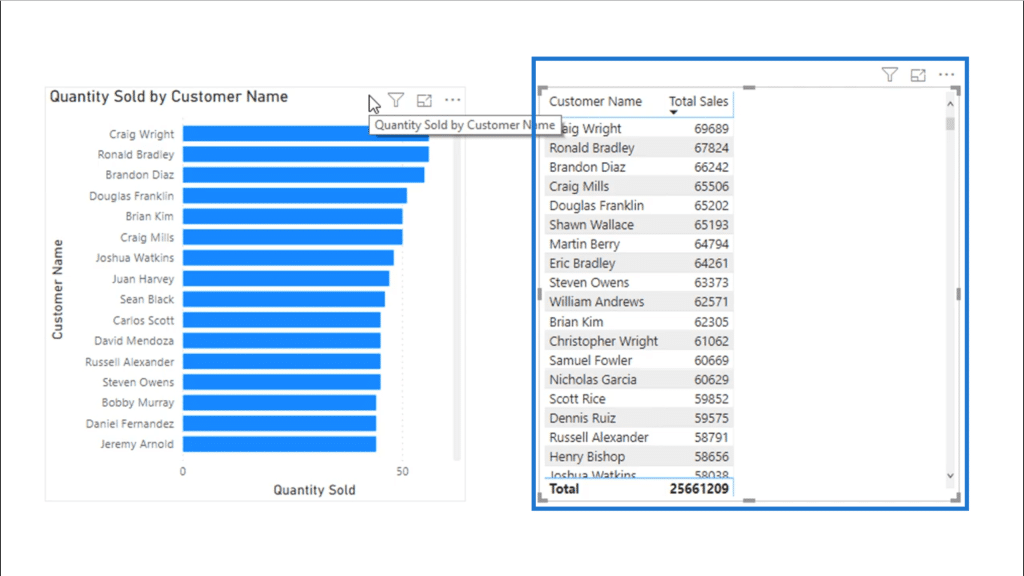
This makes it easier to see the actual numbers instead of having to look deeper into each visualization.
I find it’s just so much easier to try to actually see the number than trying to sort of look deeply into a visualization and understand, okay. What is the formula doing? If you can see each individual result, it makes it a little bit easier to understand maybe what is that actually happening it within a formula.
Using COUNTROWS To Get Total Transactions
The last formula I’m going to use as an example computes for the Total Transactions. I’m going to add a new measure again for this.
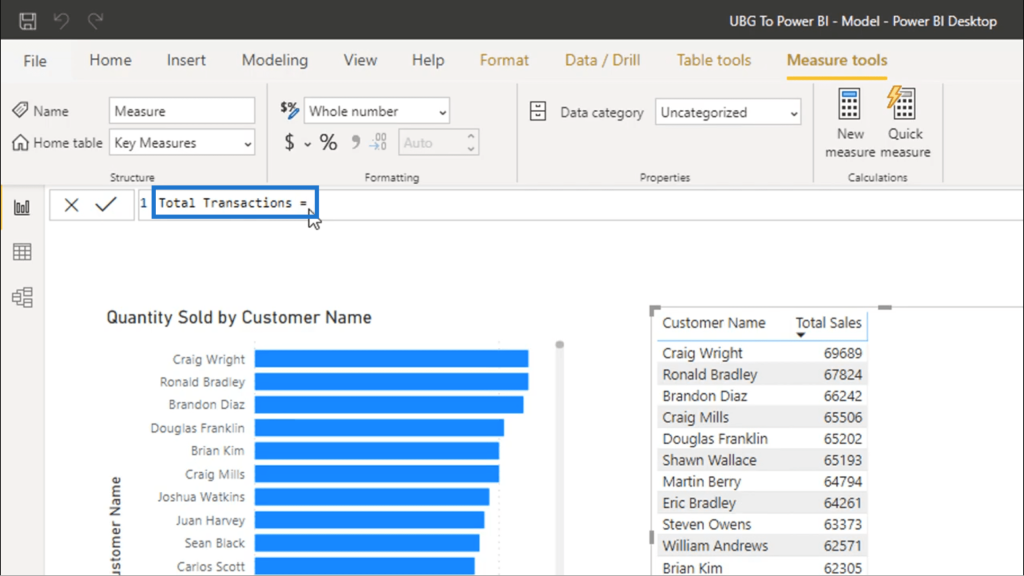
Then, I’m going to use COUNTROWS.
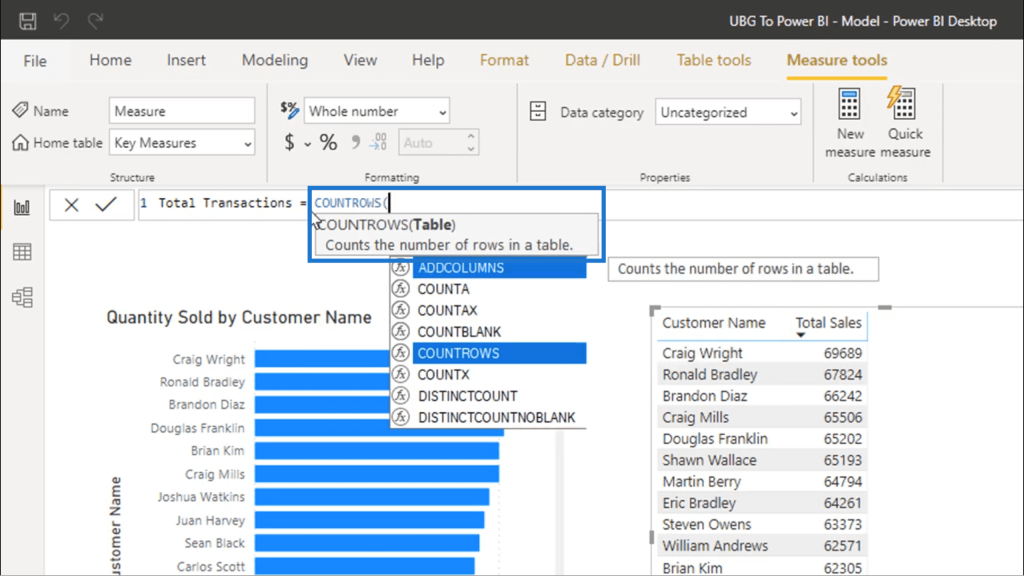
COUNTROWS lets me count the number of rows in a specific table.
Since I need a table for this function, I’m going to reference my Sales table.
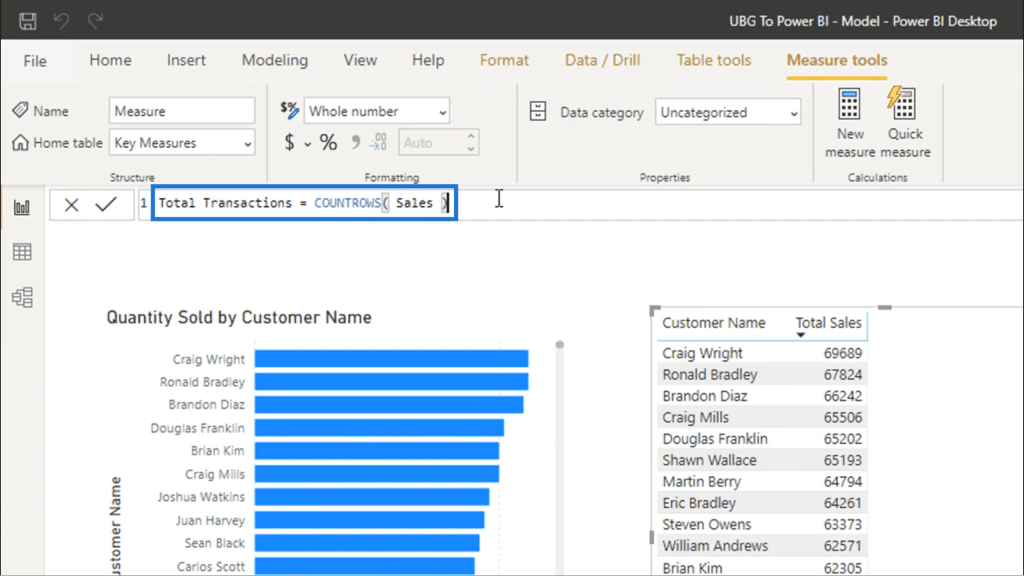
Once I push enter, that measure will be added to the Key Measures group. I’ll drag that into my table so that I can start comparing the data.
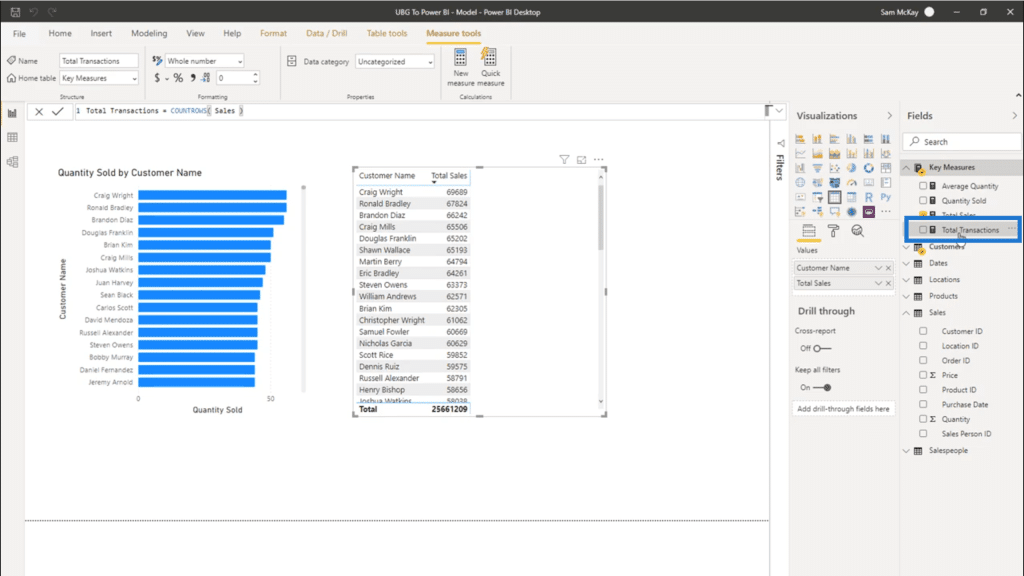
I’m also going to drag the Quantity Sold for even more insights.
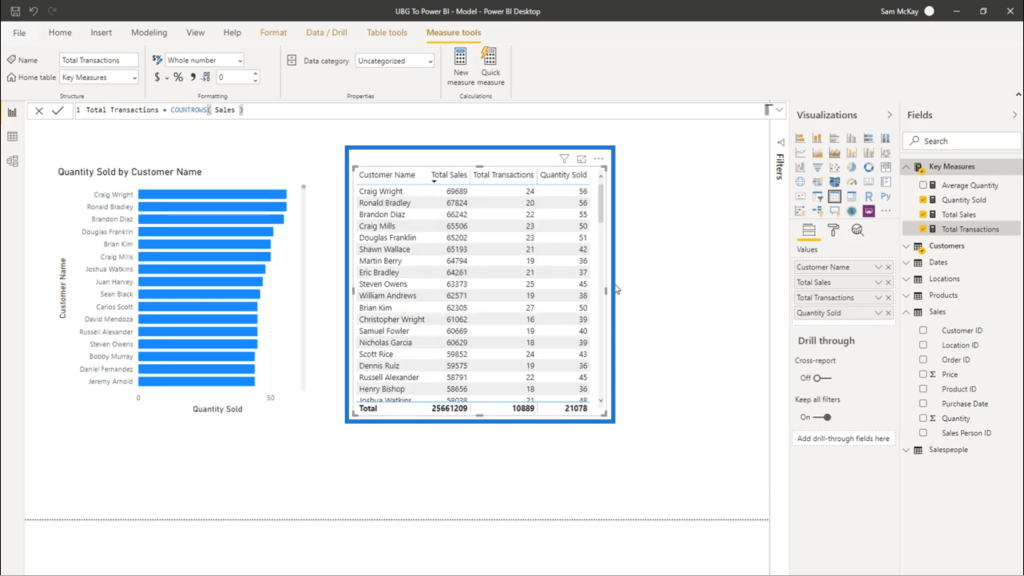
Now, I can see how many purchases each customer has made and how many products have been sold. Because I placed them side by side, it’s also easier to compare the numbers.
***** Related Links *****
Quick Measures – How To Use Them In Power BI Models
Comparing Calculated Columns And Measures In Power BI
Measure Branching: Power BI Development Strategy
Conclusion
Since this is a beginner’s course, I just gave you a quick overview of some iterating functions you can use in your Power BI measures. These examples already show you how much potential your reports have if you have a basic understanding of these functions.
There’s an entire group of iterating you can use aside from SUMX like AVERAGEX, MAXX and COUNTX, among others. From here, you can jump to more advanced measures and get even more insights.
Again, when working with Power BI, the key is to keep things simple first. Mastering the simple techniques you can apply will make it easier for you to play around with more advanced calculations.
All the best,
Sam


