
The topic that I’m going to discuss in this tutorial was part of a full-hour workshop on budgeting and forecasting in Power BI during an Enterprise DNA Learning Summit. You may watch the full video of this tutorial at the bottom of this blog.
This tutorial focuses on how we calculate and highlight the differences between cumulative sales and cumulative budgets up to a certain date only.
Firstly, I’ll show you the problem that I believe a lot of you may have experienced when it comes to budgeting and forecasting in Power BI. Then, I’ll show you the DAX formula to calculate the difference and the visualization of the result.

Cumulative Sales vs Cumulative Budgets To Date
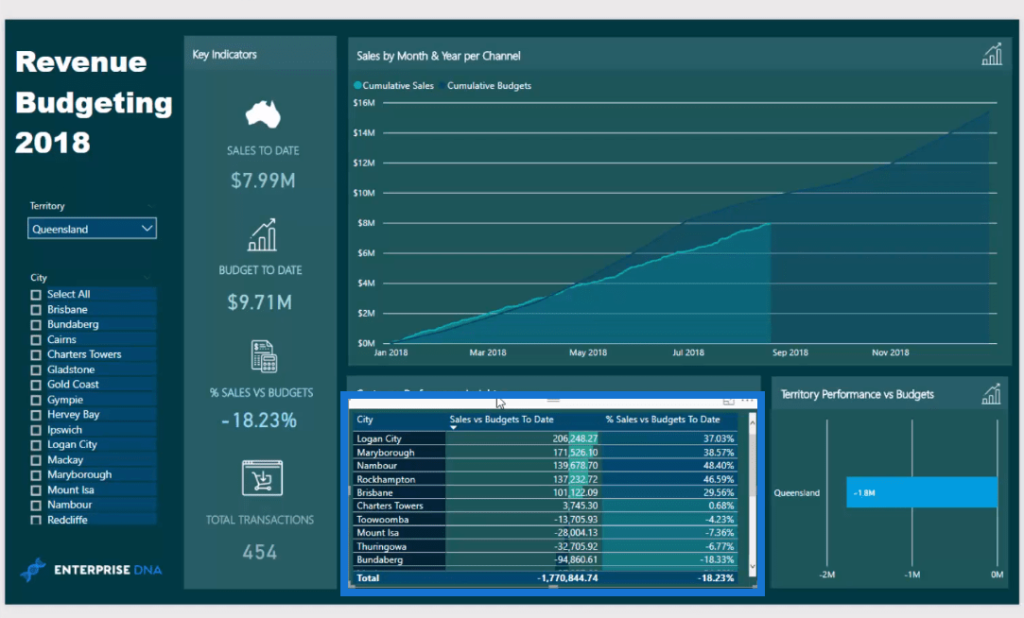
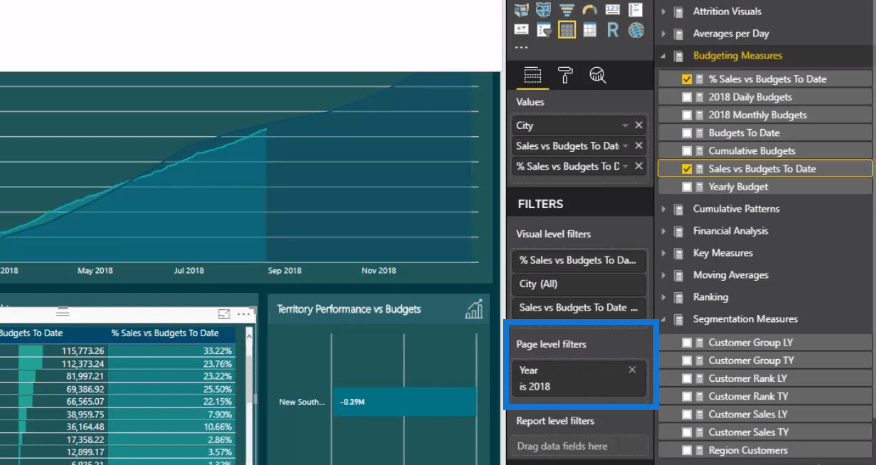
Let’s look at this chart presenting the cumulative sales and budgets. You’ll see that we have a cumulative total for our budgets, which is illustrated by the dark blue line, while the cumulative total for our actuals is in the light blue colored line.
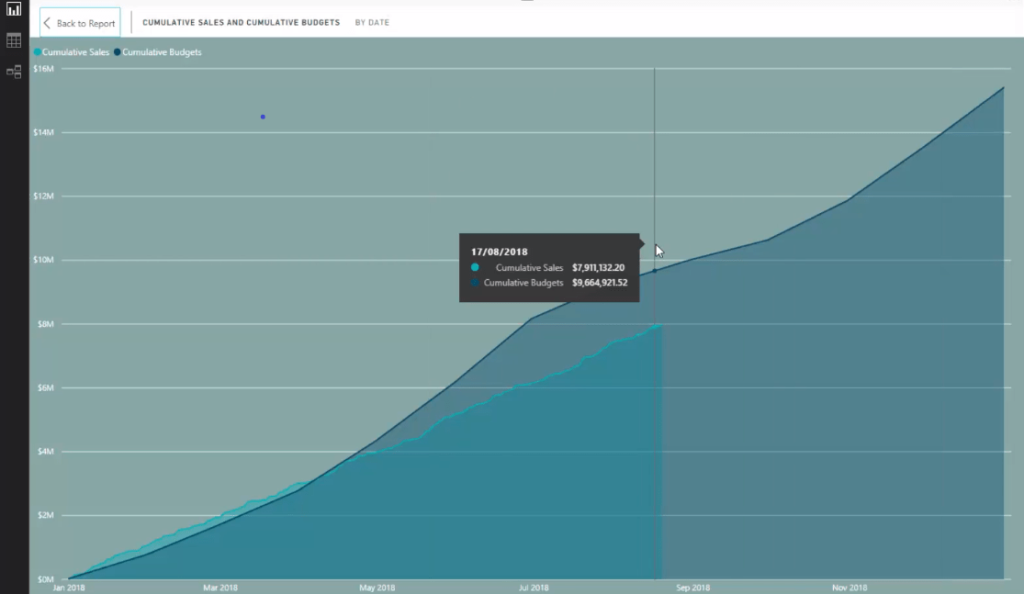
In this visualization, we only wanted to show a cumulative total up to the last sale date or up to today, for example. Now we want to work out the difference between these two numbers (sales and budgets).
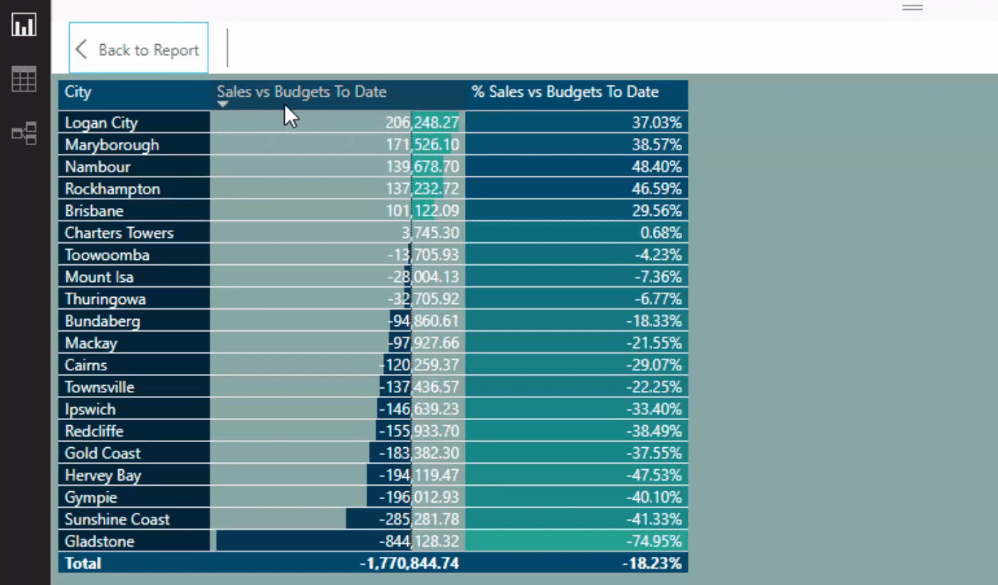
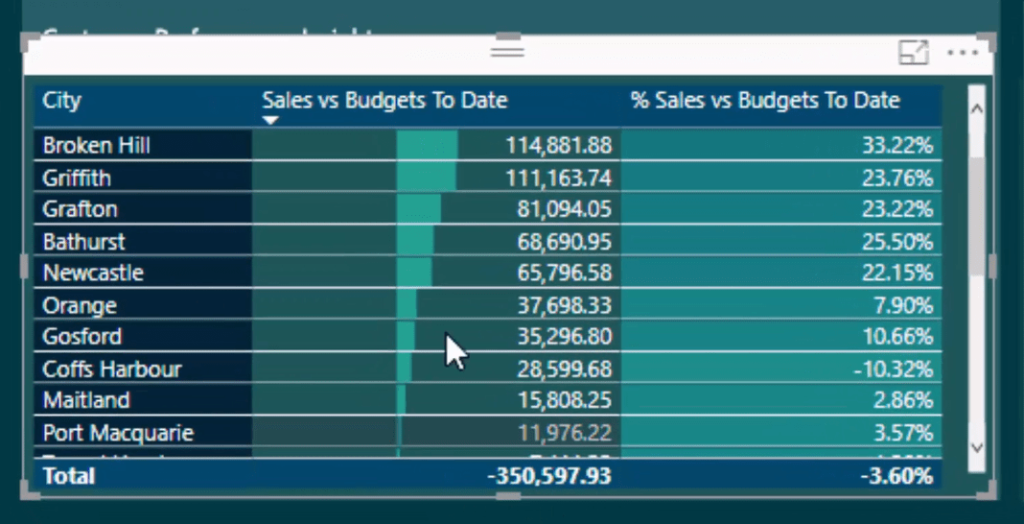
It’s not as easy as just subtracting cumulative sales from our cumulative budgets, because cumulative budgets mean calculating up the entire year. It’s not right because we want to see it up to today or the last sale date only. And that’s what this table below shows.
If you take a closer look at this table, you’ll see that we have a breakdown per city.
Now let’s look at the DAX formula I created to get this insight.
DAX Calculation To Work Out The Difference
I called the measure Sales vs Budgets To Date. In the first part of this calculation, I used variables (VAR) and the CALCULATE function to work out the very last sale date.

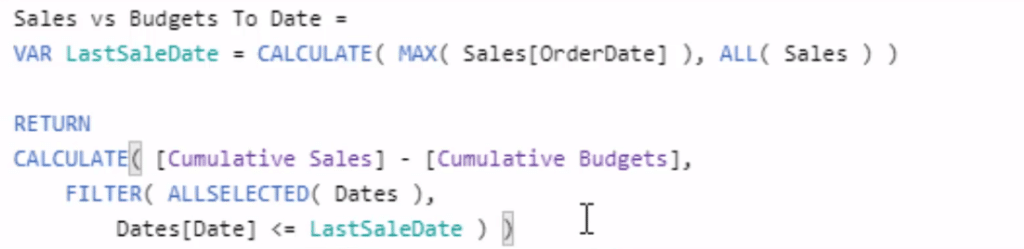
The CALCULATE function goes and finds the very last day (with MAX) in the OrderDate column, which is in the Sales table. But first of all, remove any context from the Sales table and that’s what the ALL function does.
The second part of the formula is key to this calculation. It requires subtracting budgets from sales, but we’re doing it in a different context, which is what the CALCULATE function enables us to do. This context is going to be adjusted by the LastSaleDate, as we only want to calculate up to the last sale date.
The ALLSELECTED Dates will create a list of dates in the current context. In this case, it’s 2018 because I have this Page Level Filters down to 2018. And so it’s only looks at 2018 budgets.
Then, it’s going to look through every single date, and if that date is less than the LastSaleDate, we will include it in this calculation.
And that’s how you get the difference to forecast up to the last sales date. This is very similar to calculating a cumulative total, but in this case, we’re restricting the cumulative budgets result.
You’ll see in the table the result, which the the difference, -350, 597.93. And we have a breakdown of the amount of each individual city, showing the sales versus budgets to date.
***** Related Links*****
Show Actual Results vs Targets Only To Last Sales Date – DAX Cumulative Totals
Forecasting Analysis Techniques in Power BI with DAX
Create Dynamic Cumulative Totals Using DAX In Power BI
Conclusion
This is a relatively simple technique, but a very useful one for your own reports on budgeting and forecasting in Power BI. It’s just a matter of understanding the DAX functions used especially CALCULATE, and how you can change the context within CALCULATE using FILTER.
I hope you can make use of this technique efficiently in your business and be able to see the significant insights from your analysis.
Check out the video and the links below for more information regarding this tutorial.
All the best!
Sam
***** Learning Power BI? *****
FREE COURSE – Ultimate Beginners Guide To Power BI
FREE COURSE – Ultimate Beginners Guide To DAX
FREE – 60 Page DAX Reference Guide Download
FREE – Power BI Resources
Enterprise DNA Membership
Enterprise DNA Online
Enterprise DNA Events


