
In this tutorial, I’m going to cover a specific technique around Cumulative Total and budgeting information that you might be showing in your reports in Power BI. You may watch the full video of this tutorial at the bottom of this blog.
This is a very common question in the Enterprise DNA Support Forum. It’s usually asked when people are trying to do a comparison between their Cumulative Totals and forecasting data.
When creating reports, the Forecast is already done for the entire year but the Sales information available is only up to a certain point in the data.

I want to show the Cumulative Total only up to a certain point so that it matches with the available Sales data.
I don’t want to see an extension of the line in my Cumulative Totals or Budgets in the charts.
So, in this tutorial, I’m going to show how to stop the Cumulative Total from having any projected number for the rest of the time frame in the visualizations in Power BI.
This is a short breakout session from a Learning Summit course in Enterprise DNA Online.
Show Cumulative Totals Up To The Last Sales Date
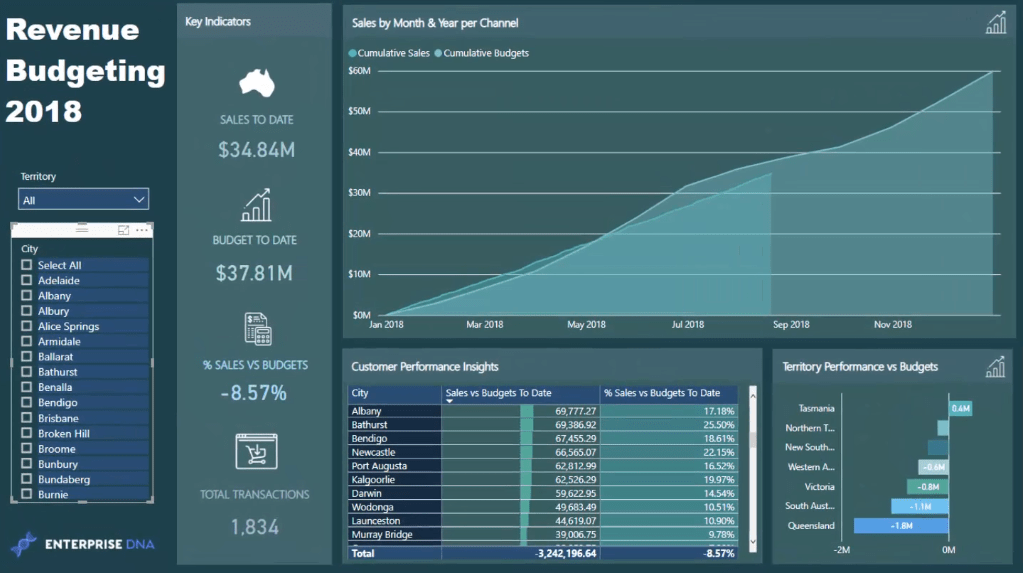
Let’s look at the Cumulative Sales versus Cumulative Budgets chart.

My budgets are extending all the way to the end of December 2018 while the Sales only show up to August 2018. There’s a mismatch in their time frames.

To make this visualization more compelling, I need to make the Cumulative Budgets end on the same date as the Cumulative Sales.
Here’s how to do it:
Let’s look at the Cumulative Sales formula:

The logic I’m working on is to calculate Sales cumulatively only up to the very Last Sales Date.
I’m going to calculate the LastSalesDate regardless of the context coming from the Date table or Date column.
This part of the formula is finding the LASTDATE when a Sale was made regardless of the context:

So, it’s looking for the last OrderDate in the Sales table.
I’ve removed the filter from Sales using the ALL function:

The SELECTEDVALUE function will tell what the current date is:

And then, if it’s greater than the Last Sales Date, it will return BLANK. So, if the current date is greater than the Last Sales Date, the Cumulative Totals won’t display any result.
And if the current date is less than the Last Sales Date, the formula will CALCULATE the Cumulative Total:

This part of the formula is the standard Cumulative Total pattern which can be used and reused in a variety of ways in Power BI.
Getting Better Visuals In Power BI
Let’s look again at the chart.
I can make additional selections to the visualization which will show various budgeting information.

This is a dynamic way to view Sales versus Budgets in a very compelling way. I would have a lot of clutter in my reports if I didn’t use this simple technique.

If this Cumulative Total technique isn’t applied in Power BI reports, it will make the charts have a line that continuously comes out from the last Sales date.

This happens because the Cumulative Total will always go back to the last Total it had on the previous day. It will continue calculating the amounts of the previous Sales.
***** Related Links *****
Cumulative Totals Based On Monthly Average Results In Power BI
Showing Cumulative Results Vs Targets Only To Last Sales Date In Power BI
Compare Multiple Metrics Cumulatively In Power BI Using Advanced DAX
Conclusion
This tutorial gave a very simple fix to a frequently asked question in the Enterprise DNA Support Forum.
The LASTDATE and SELECTEDVALUE functions are key to make reports that show Cumulative Totals up to the date of the last Sales transaction.
Implementing this technique in your models will help create compelling visuals in Power BI.
All the best,
Sam


