
Power BI is an incredible tool to run scenario analysis and what-if analysis examples. I’ve actually never seen or come across an analytical tool that is as effective and intuitive to implement this type of complex analytics. You may watch the full video of this tutorial at the bottom of this blog.
The key is that you’ve got to think more analytically about the underlying elements in your datasets than what you may have done in the past. You need to isolate key variables, then decide how you actually want to run the ‘what-if’ or scenario analysis on top of them.
In this blog post, I show you how you can bring together many different elements within Power BI, especially with DAX formulas, to ultimately initiate this type of analysis in your own models.

Doing A Scenario Analysis In Power BI
Creating ‘what-if’ analysis has become a lot easier with the ‘what-if’ parameters that you can now initiate from the top ribbon in Power BI. Once these are enabled, it’s just a matter of using the measures (which are automatically created) and bringing those into effect to shock the necessary variables in your data.
These can be things like price or quantity demanded, or commodity costs, etc. (I dive deeper into these variables during the tutorial).
One of the key learnings of scenario analysis inside Power BI is that you have to understand iterating functions very well. Within the video example, I showcase how you can isolate certain variables and then overlay the correct ‘what-if’ parameter to them, inside of an iterating function like SUMX. This is really the only way you can do it effectively, so you should certainly look to master this concept.
A Real-Life Scenario
I was emailed by someone who wanted to see what the returns would be or what the returns would have been – either historical or forecasted – if you reduce the price of one product or a group of products, and then through that discount, you can check how much your profits or your sales would be if that increased demand for your other products.
This is a real-life scenario, right? For example, you might want to reduce the price of your products, which is going to bring more people to your store. Ultimately, they might buy a wider portfolio of your products. The demand for your products, in general, may go up for all those non-selected or non-discounted products.
This is an example of some real-life scenarios that you can analyze inside of Power BI. Instead of going through every single individual calculation step-by-step, I’ve already set it up and I’m just going to run through how I did it.
First of all, let’s see the functionality. I’ve set things up where we can change the price of a selected product. For example, we can choose from 2%, 5%, 10%, and 20%.


If we choose 20%, you can see that the change in sales is basically down by 20% because it’s saying we’re reducing the price of everything down by 20%.

Isolating Products
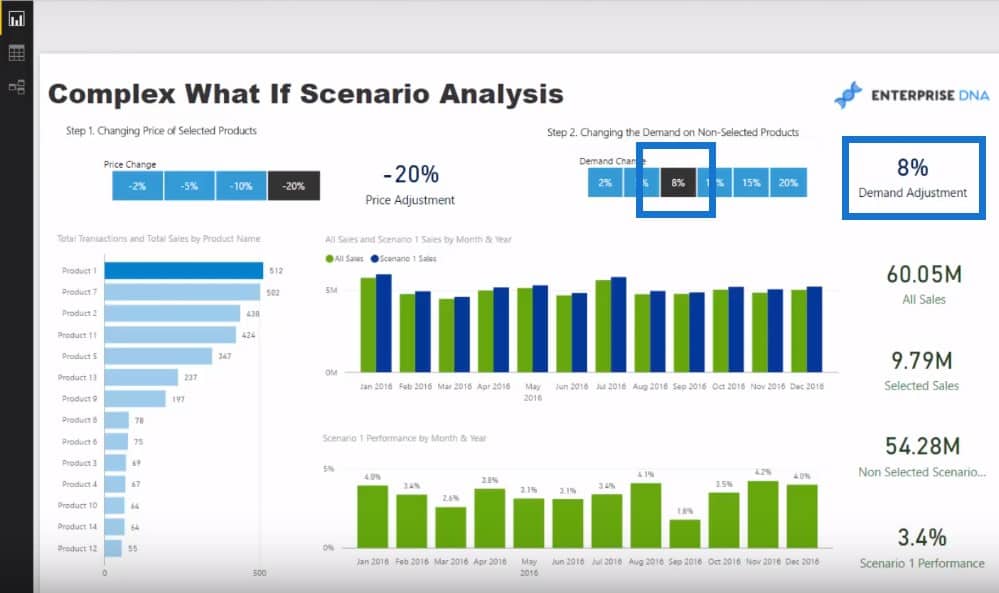
What I want to do is to isolate which products we change the price on. Let’s say we select a product and decrease the price by 20%. On the flip side, the demand will increase by a certain percentage on the non-selected products. Let’s say we select Product 1 and reduce its price by 20%. Because of that price change, we’re going to see an 8% increase in demand for all the other products.

So what is this going to do to the overall sales performance? You can see here a percentage of increase on Total Sales through time.

Selected Scenario Sales
Let’s sit through some of the formula that I used to actually create this. Obviously, this is historical so we calculated the Total Sales by using the SUMX of the unit price multiplied by the order quantity.
The next step is to work out the Total Sales of just the selected products. To get this, I created a new measure and called it Selected Scenario Sales. I used a VARIABLE to sum up the Total Sales and added in the price adjustment.

And then at the bottom part of the formula, I only calculated for those products that have been selected.

So when I click on Product 1 and hover over it, the tooltip is saying 9.79 million, which is also reflected in Selected Sales.
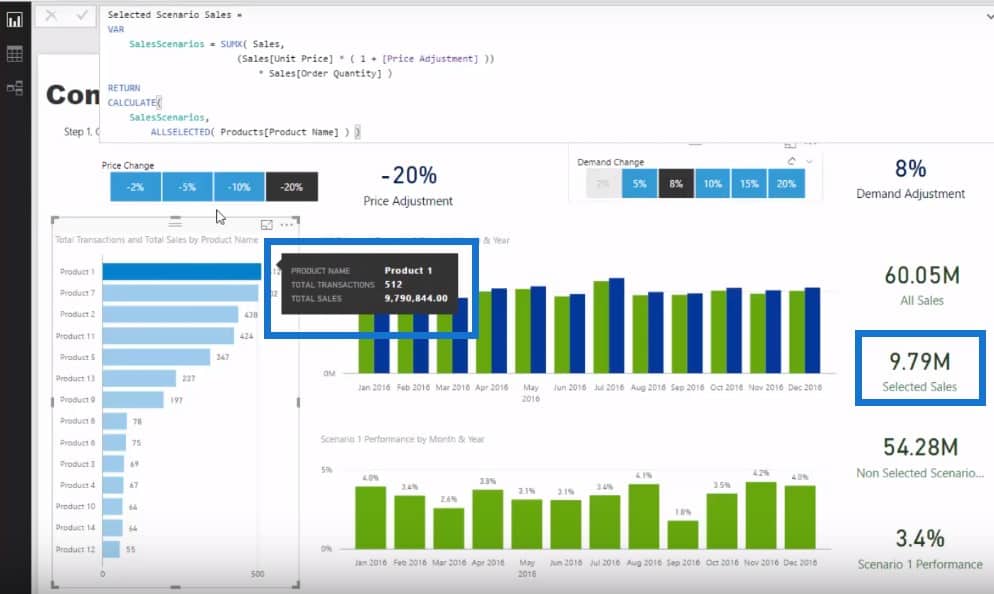
As we click through the different products, you can see that it’s changing for whatever selection we’ve made since the data is dynamic.
What the Selected Scenario Sales is doing is that it is calculating the Total Sales but only for the adjusted Price Change. However, we need to add that to what is not selected, right? The non-selected portion is being adjusted by 8% higher.
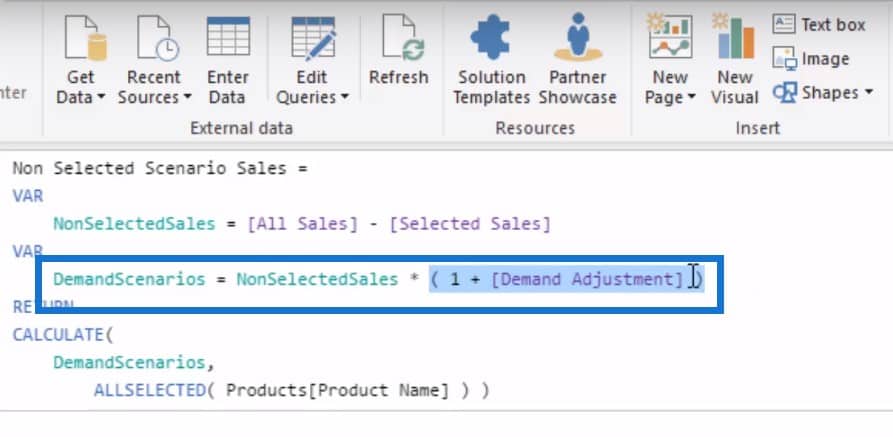
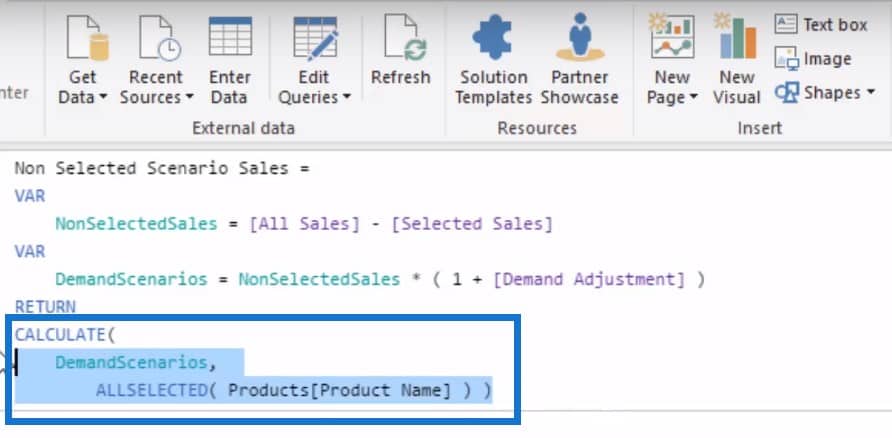
Non-Selected Scenario Sales
To create the measure for Non-Selected Scenario Sales, we’re going with All Sales – Selected Sales.

For DemandScenarios, we’re going with Non-Selected Sales and then adding the Demand Adjustment to it. We’re getting our Non-Selected Sales and then we’re saying if it’s not selected, then it will be adjusted by the demand parameter.
Finally, we’re putting them inside the CALCULATE statement as well.
Now we have these two numbers: the Selected Scenario and the Non-Selected Scenario. If I jump down to my Scenario I Sales, I’m adding the two together: the Selected Scenario Sales + the Non-Selected scenario Sales.

Scenario Performance
So Product 1 is being adjusted by this and all of these other products are being adjusted by the demand. With this information, I can then work out what’s the performance, which is the Scenario Sales divided by All Sales if nothing happened.
So those are the core calculations which go into this specific scenario. This is a perfect example of a scenario that could happen in real life. For example, you might be thinking of dropping your Top 3 products and see what impact that would have. Let’s say for instance you drop your Top 3 products by 10%. You can expect a huge amount of people coming in and see an increase in the demand for all your other products by 15%.


Using this calculation, we can very quickly work out if the discount is going to be profitable for us or if it is worth doing. We can also run some sensitivity analysis and find out where is our actual break-even using this current model.
This technique showcases the real analytical power behind Power BI and it’s just one derivative of the many scenarios you can incorporate into your own analysis.
***** Related Links *****
Power BI ‘What-If’ Parameter Feature
How To Start Using ‘What If’ Parameters Inside Power BI
Develop Advanced Scenario Analysis Models Using DAX in Power BI
Conclusion
If you can get to an understanding of how this all works, then you can very quickly do some complex work within your models and over your own data sets, which is ultimately the key thing I want you to be able to achieve.
As soon as you do this once or twice, you’ll be able to start creating very effective Power BI models that are producing some really high quality insights.
If you want to explore many more concepts and applications of scenario analysis in Power BI, check out my Scenario Analysis Deep Dive course at Enterprise DNA Online. There are plenty more advanced techniques to learn about creating this powerful type of analytics.
Good luck implementing this one.


