
In this tutorial, I’m going to show you some advanced ranking analysis in Power BI. As an example, I’m going to use the report that I submitted for the 10th Power BI Challenge on the Enterprise DNA forum.
I have discussed the other pages in this report in other tutorials. For now, I would like to focus on a specific page in the report that combines two sets of data.
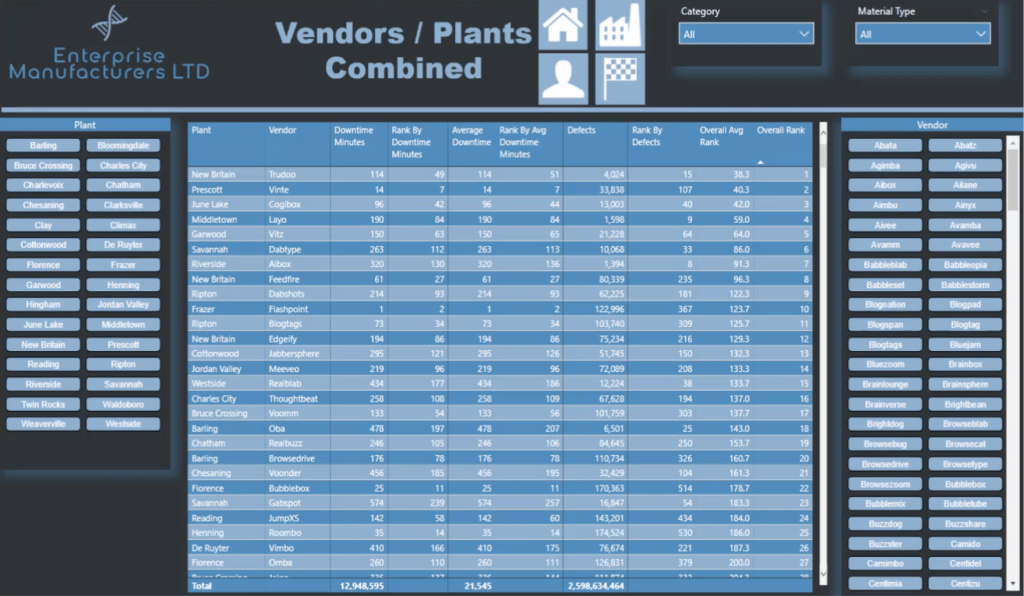
Note that I already have separate pages for the Vendors data and Plants data. But when these two data sets interact, users can get even deeper insights. That’s why I went ahead and did a combined slide.

Building The Vendors/Plants Combined Page
If you’ve seen the other tutorials on how I created this report, you’ll notice that all the slides I used look almost the same except for some unique visuals. That’s because I created a background template on PowerPoint and used it across the entire report.
This gave my report a consistent look and also made things easier, knowing that all I needed to do was to change the heading and the data on each page. The background remained the same all throughout.
On this page, I used one chiclet slicer on the left for Plant data and another chiclet slicer on the right for Vendor data.
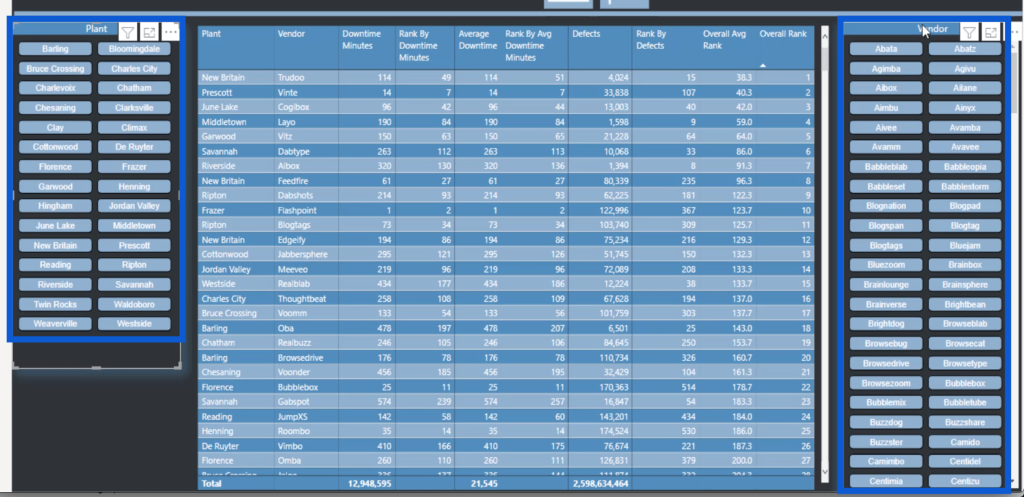
The chiclet slicer can be found under the visualization pane, but if you don’t see it yet, you can add it to your own Power BI desktop by downloading it via the AppSource.
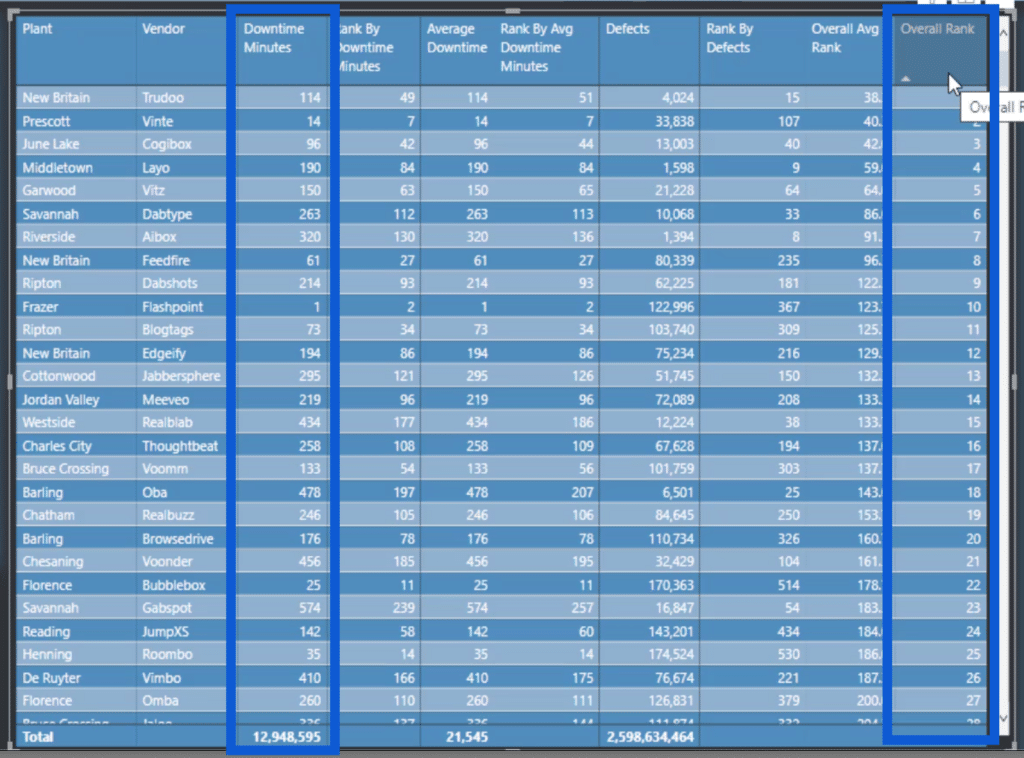
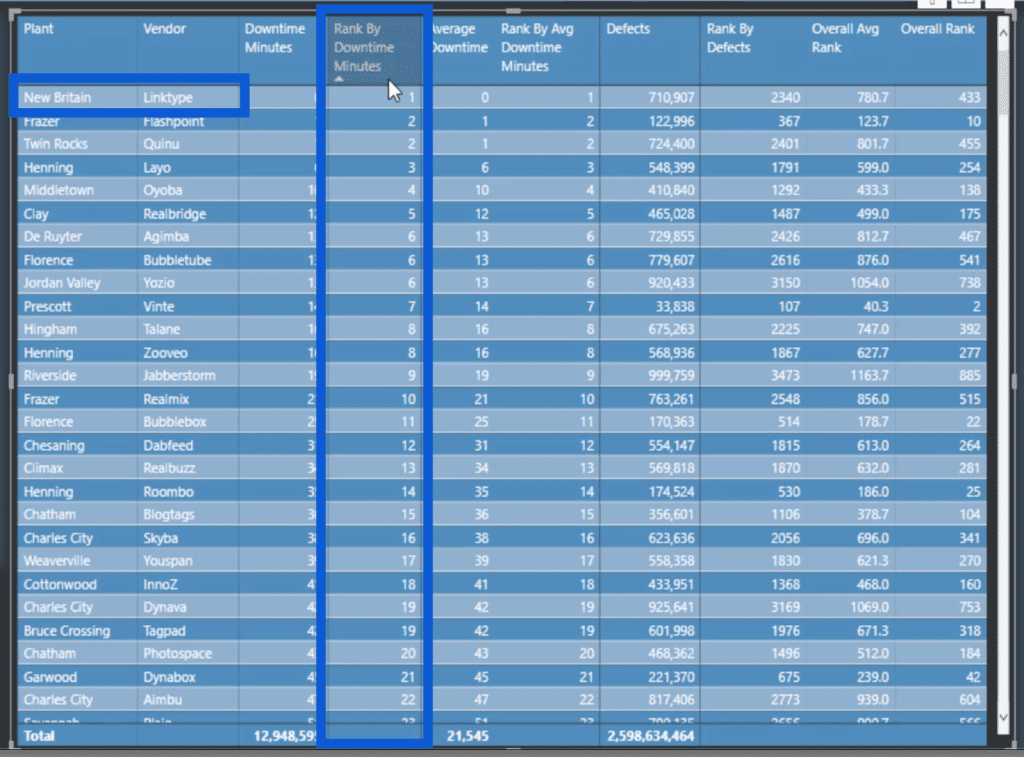
The table at the middle contains all the data. As you can see, it has both the Plant and the Vendor list.
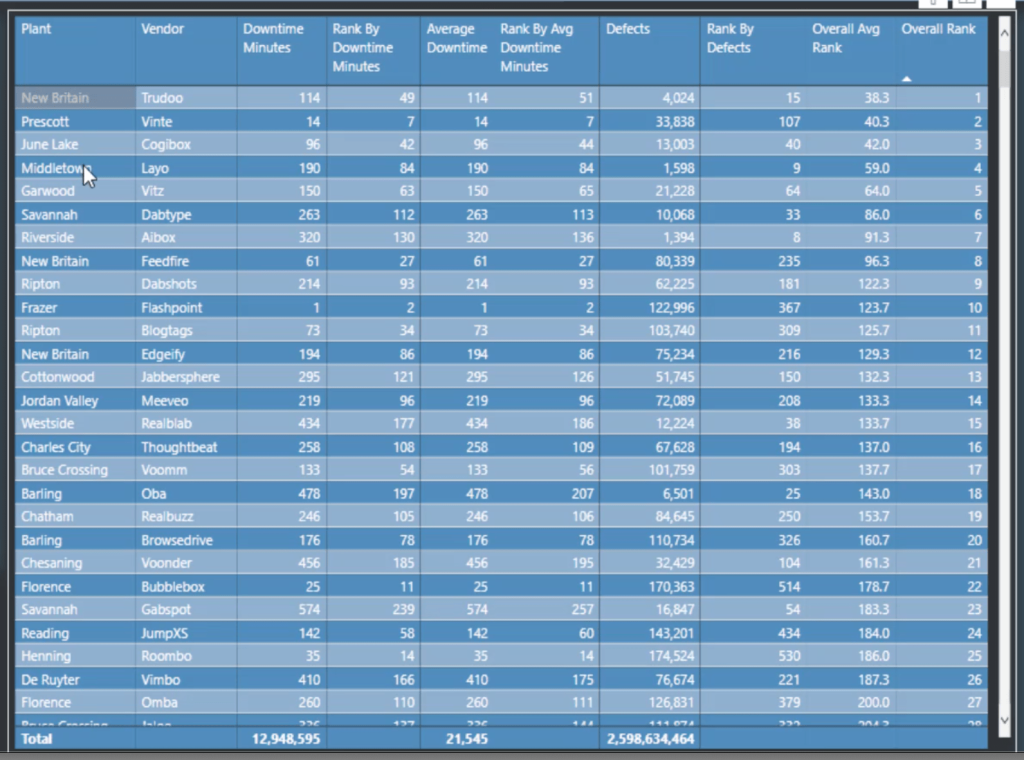
It also contains the Downtime Minutes, the Average Downtime, the Defects, and the rankings for those three measures. It also has the Overall Avg Rank and the Overall Rank.

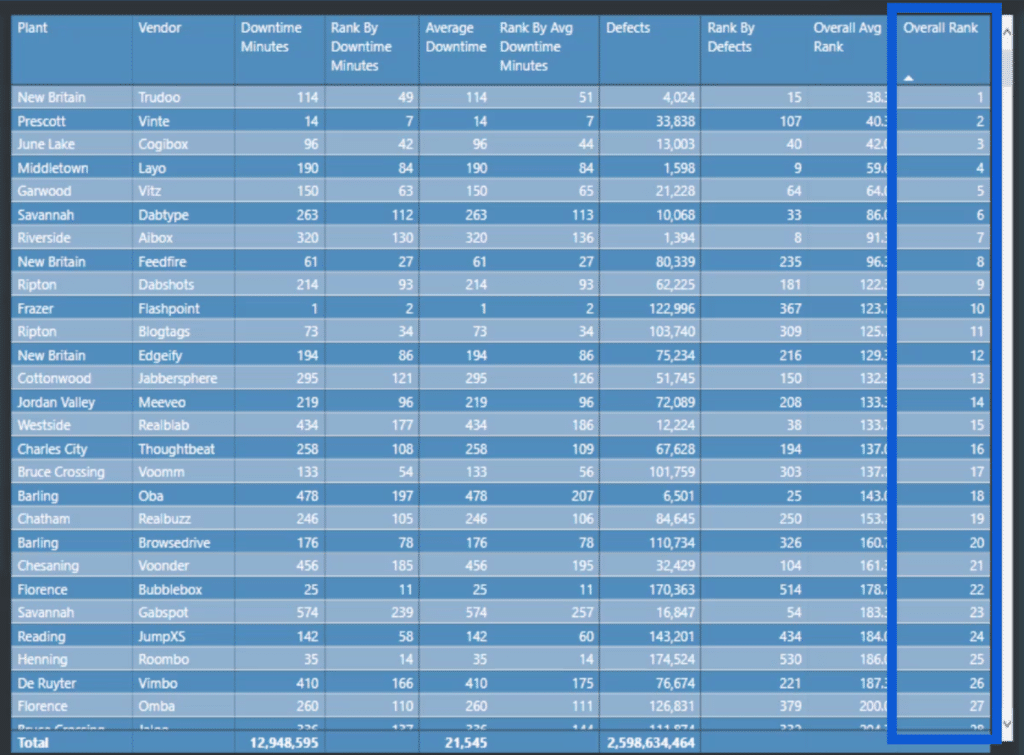
Notice that the data is currently sorted based on the Overall Rank, from the top performing to the worst performing.
Measures For Ranking Analysis
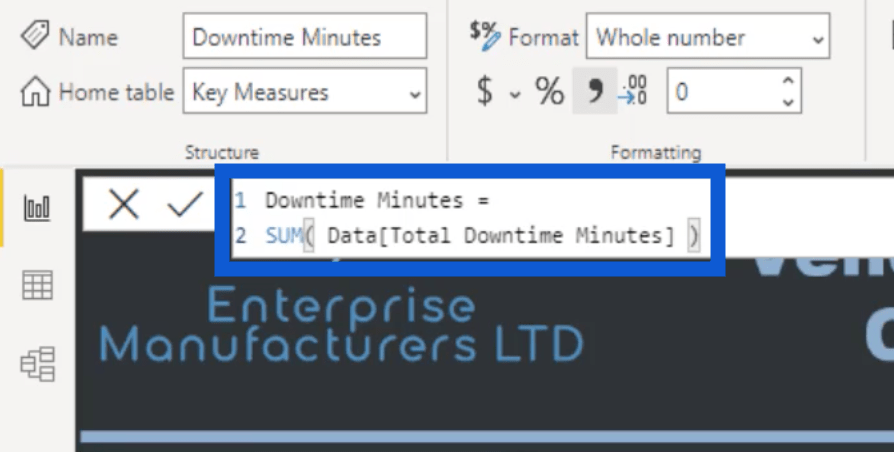
Now let’s dig into the actual measures that created the results that you see in the table. I’ll start off with the Downtime Minutes, which simply uses the SUM of the Total Downtime Minutes.
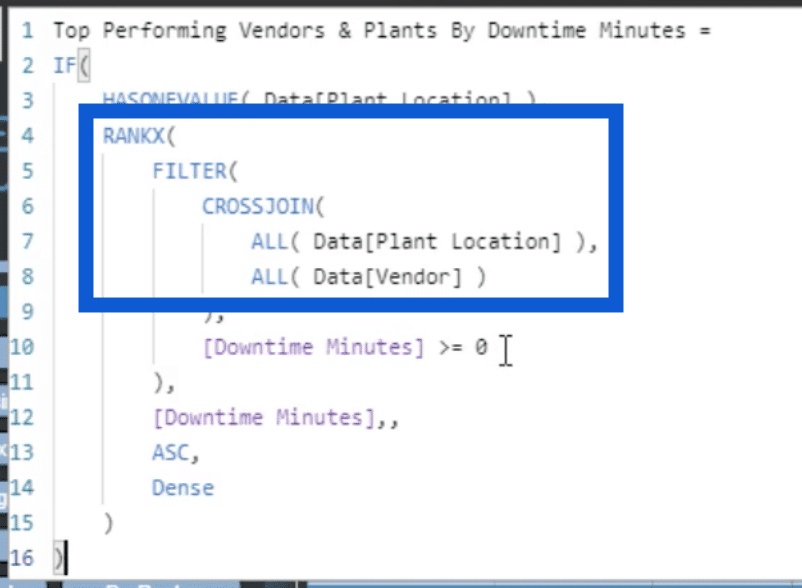
Now that I have the basic measure ready, I can start ranking the downtime minutes. I called this measure Top Performing Vendors & Plants by Downtime Minutes. But because I have limited space on the table, I simply named it Rank By Downtime Minutes on the visual.
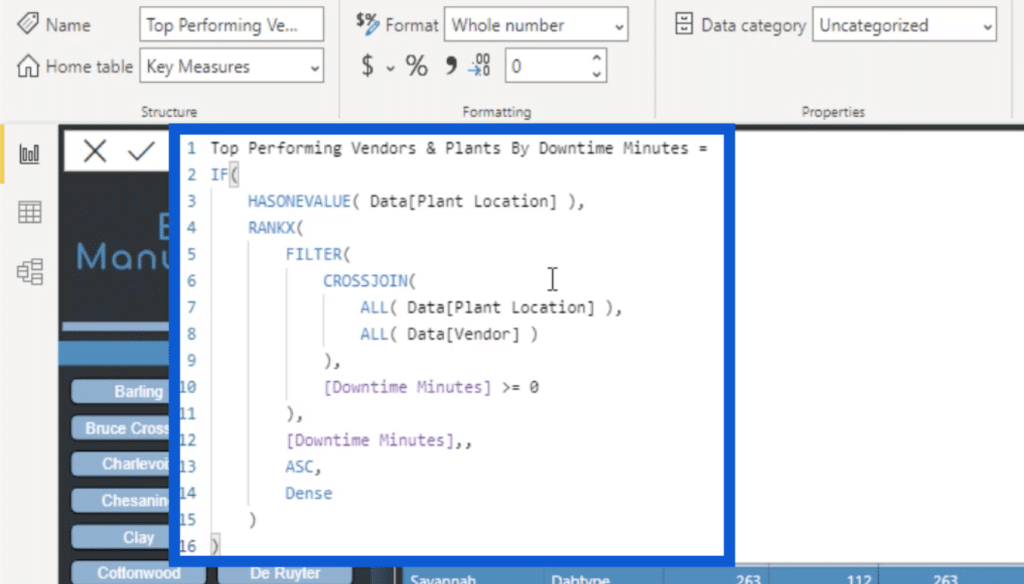
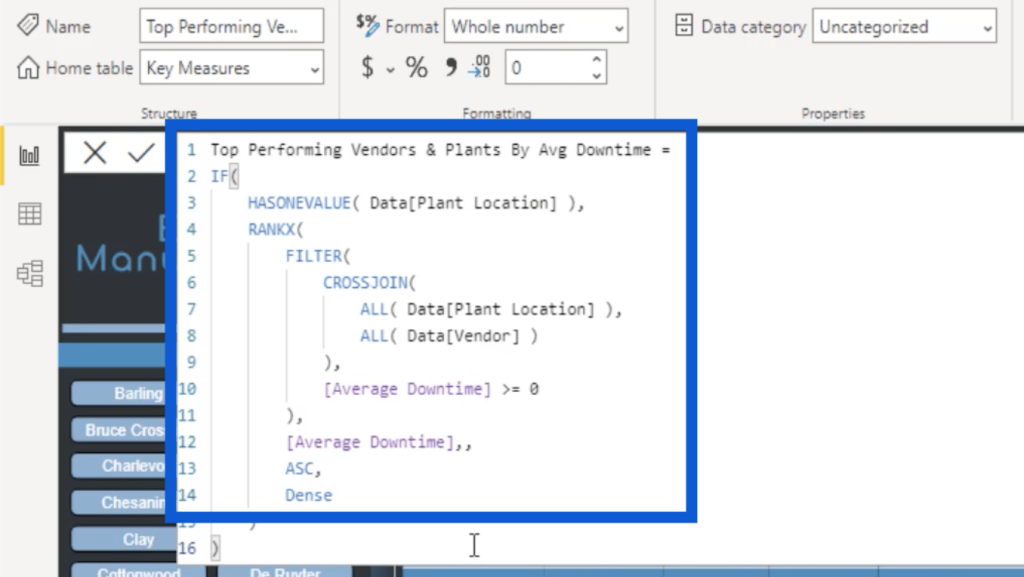
Some would use a SWITCH TRUE statement for cases like these. But what I did was create an IF statement with the function HASONEVALUE on the Plant Location.
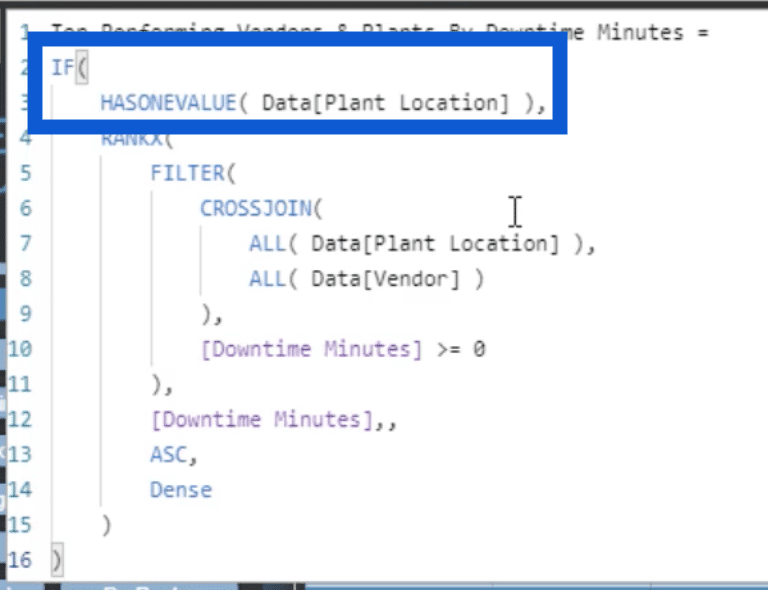
Basically, this statement says that if there is a value in the plant location, I want to show the rank. Otherwise, it has to stay blank.
I did this to make sure that the space for the Total remains blank. This column is only meant to rank the data across each row, so it doesn’t make sense to have a total at the bottom.
There are several ways to make this happen. But when I was assessing the results I wanted to get, I figured that using IF HASONEVALUE is the best option considering the way all the measures in this report interact with each other.
You’ll notice that across the table, other rank columns are also blank. That’s because the approach I used on all of them was similar.
The next part shows the use of the RANKX function. Then, I used CROSSJOIN to make sure that I am ranking both the Plant Location and the Vendor even if I have a FILTER in place. Basically, the CROSSJOIN function helps combine the data to come up with the rankings.
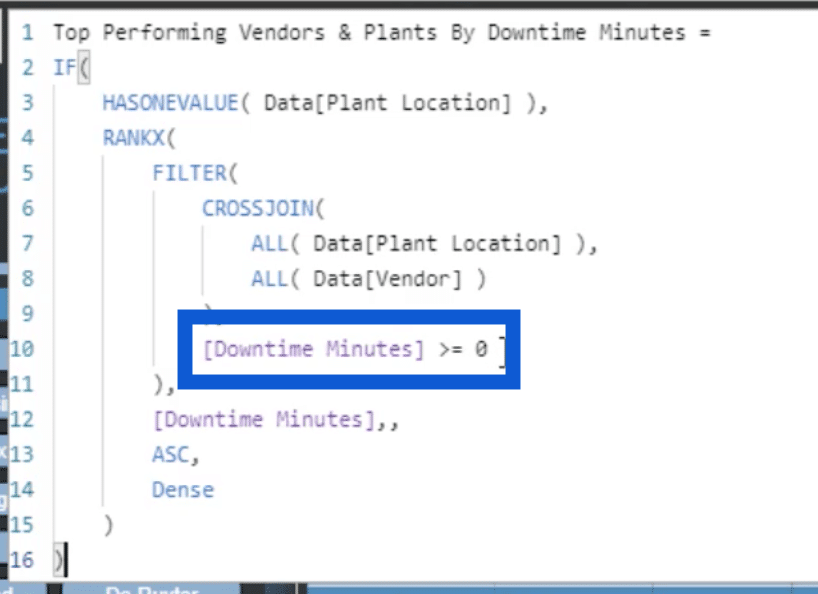
You’ll notice that I wanted the Downtime Minutes to be greater than or equal to zero before they are ranked. That’s because I wanted to exclude any plant or vendor that had a blank space under Downtime Minutes.
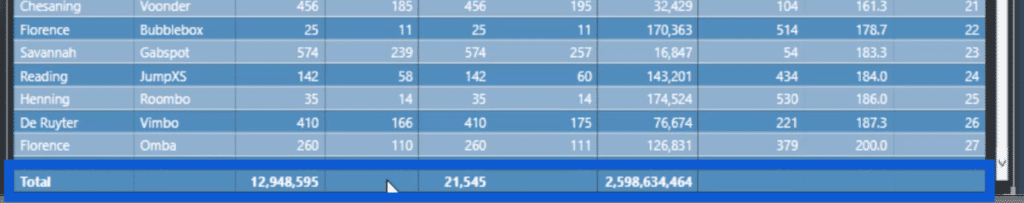
To demonstrate that, I’ll sort the data according to the Downtime Minutes. At the moment, it is sorted based on the Overall Rank.
This is how it’s going to look like when I sort the table by Downtime Minutes.
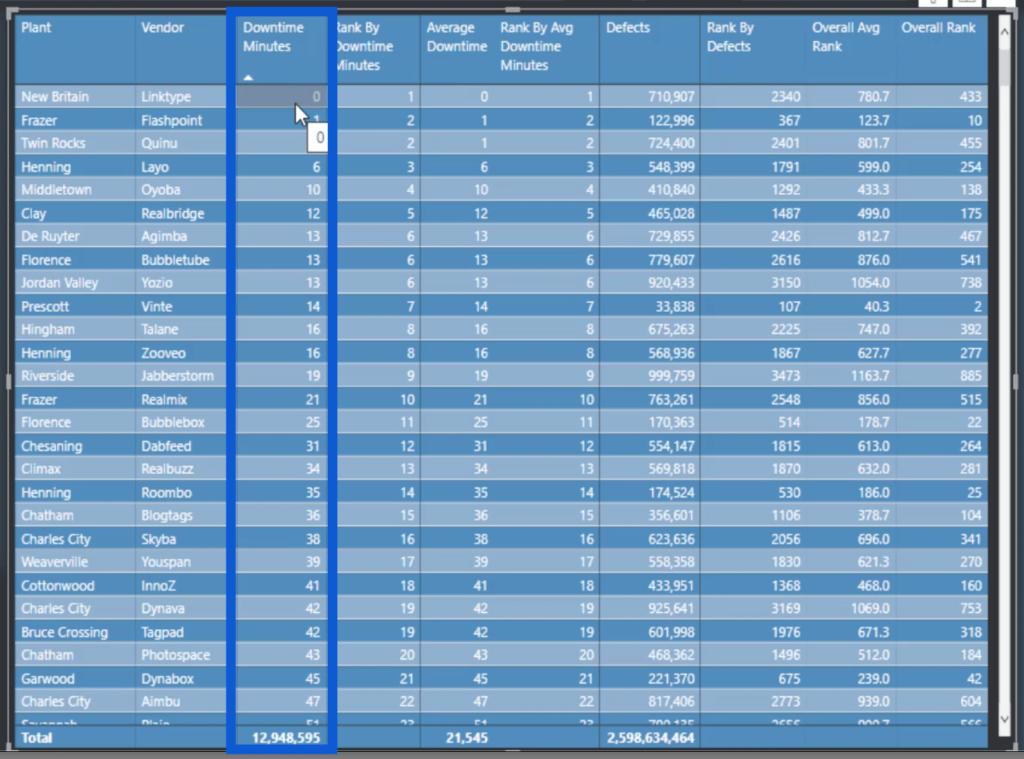
Notice that the topmost data has a zero in it. But in reality, there were some entries in the data set where the Downtime Minutes was actually blank. Those have been removed from the equation.
Let’s proceed to the next measure, which ranks the Avg Downtime. Basically, I just duplicated the ranking measure for the Downtime Minutes and changed the data being referenced.
This is a technique called measure branching. Basically, it means building a measure from a measure. I had an existing measure which I duplicated and tweaked to fit the new measure I need.

Measure branching makes the entire report development process more efficient.
This way, I don’t have to waste time creating measures from scratch especially if the measure I need is very similar to an existing one.
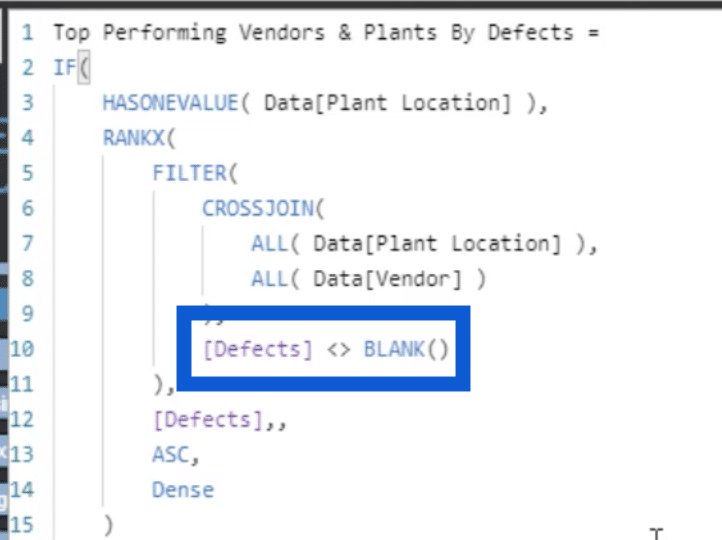
Now, I’m going to move onto the next measure, which is the Rank By Defects. Once again, I duplicated the measure I used earlier and just changed the areas that will be specific to Defects.
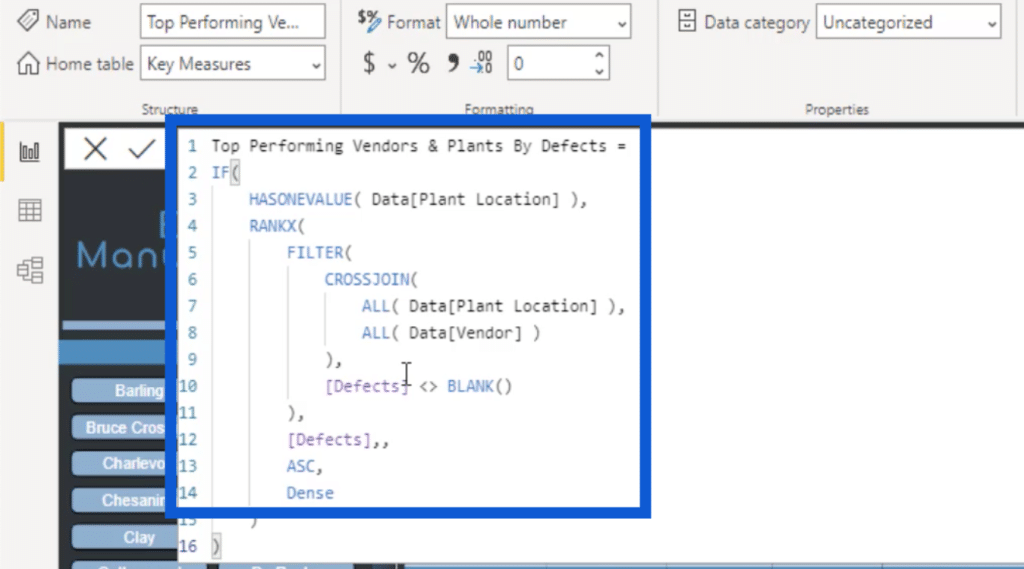
There’s an additional change that I made here, specifically the fact that I didn’t want anything to be BLANK. So even if a row under Defects does not have any value in it, I want it to be included in the ranking just the same.
Let’s proceed to the Overall Average. This is the measure I used to get the overall average.
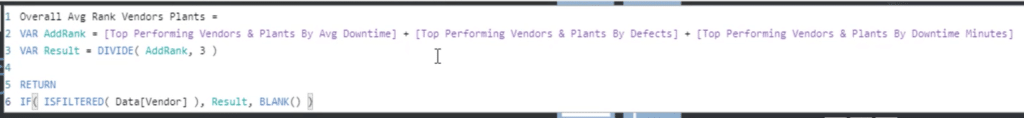
As you can see, I had to create variables for this measure. The first VAR I created is called AddRank. Basically, I just took the three measures I worked on earlier and added them all so that I can get a total number.
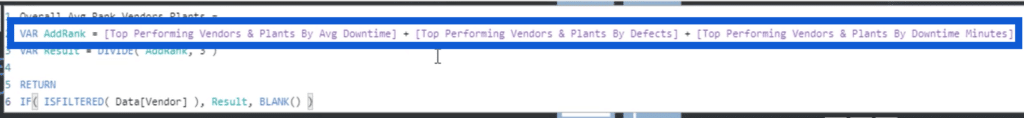
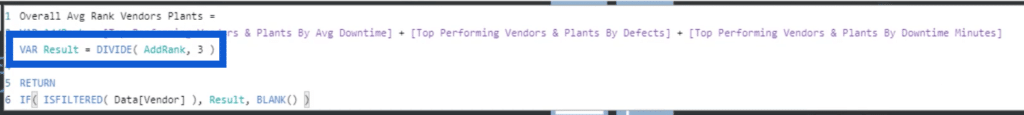
Then, I created the next VAR, which I called Result. In here, I used the DIVIDE function on the AddRank variable with a divisor of three.
And then on my RETURN statement at the bottom, I used IF ISFILTERED on the Vendor.
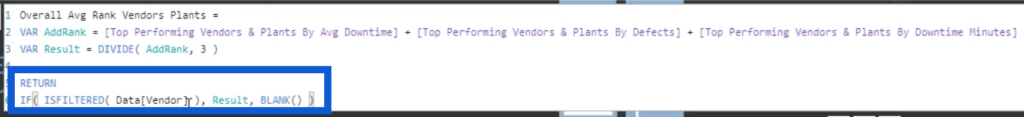
This is a different approach from the HASONEVALUE that I used earlier, although they have the same thought. It just says that if there is a Vendor listed, then show me a result. Otherwise, it should return a BLANK.
Now, I’ll proceed to the Overall Rank. Of course, this will still be similar to the other ranking measures I used earlier.
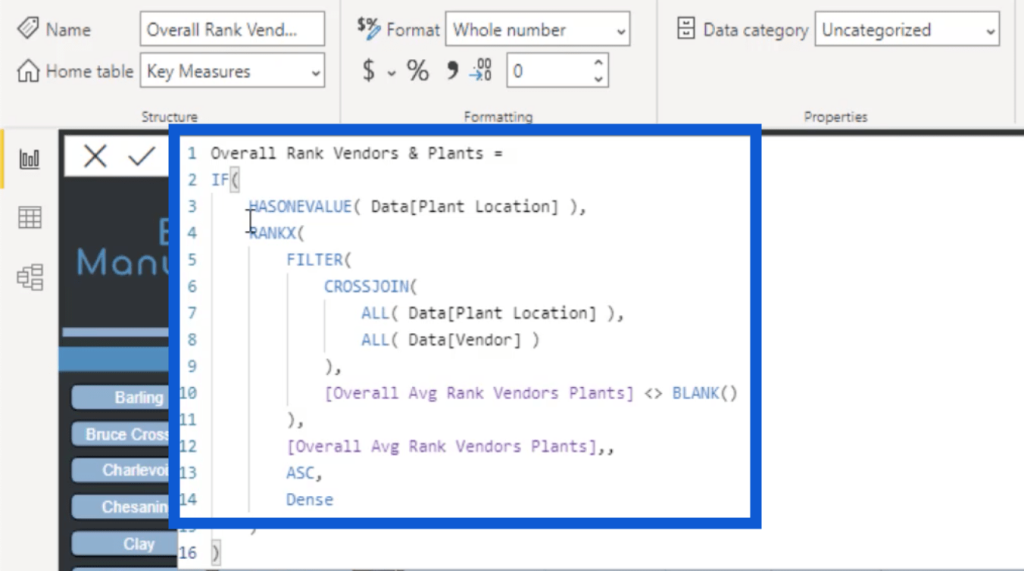
I used HASONEVALUE for the plant location, then I have my RANKX statement once again using the CROSSJOIN function to make sure that I get my results by both Plant Location and Vendor. I also referenced the measure for Overall Avg Rank Vendors and Plants, which is the measure I just worked on before this. I just want to make sure that the number won’t be blank.
The great thing about this is that the entire table can be sorted using any of the ranks. So if I wanted to sort my data using the Downtime Minutes, I can do that. It will show that the top result for the Plant would be New Britain, and the Vendor would be Linktype.
Even better, it doesn’t adjust the other rankings in the page. This is because I used ALL in my measure, and not ALLSELECTED.
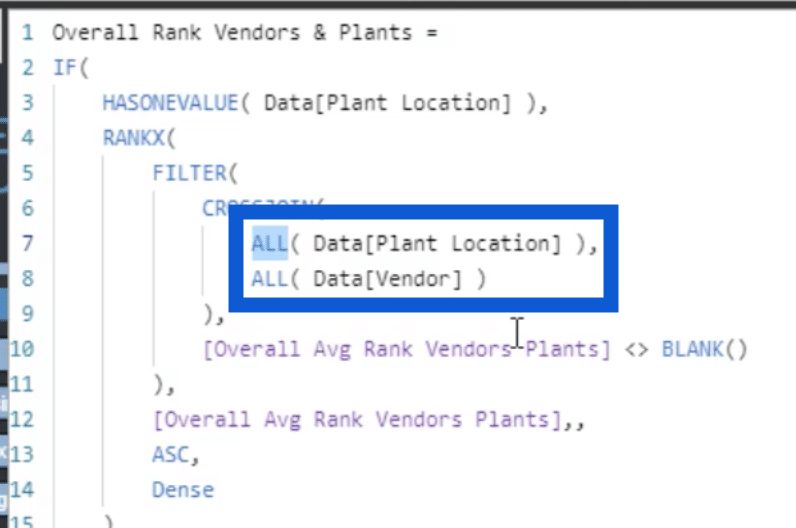
You see, ALLSELECTED will only rank the data based on the data selected. If I apply a filter, for example, only the data showing up in the table will be ranked. The data excluded because of the filter will not be included in the ranking.
It all boils down to the kind of results that you’re looking for. In this case, I didn’t want the overall ranks to change regardless if I’m only looking at specific pieces of data. That’s why I chose to use ALL.
Using The Enterprise DNA Forum For Ranking Analysis
Ranking analysis could be tricky, especially if you’re working with functions like RANKX. The great thing about Enterprise DNA is that we have great course materials and a collaborative culture within the community. On the Enterprise DNA Forum alone, you can find so many discussions about ranking analysis.
Let’s head over to the Forum so that you can have an idea what to expect.
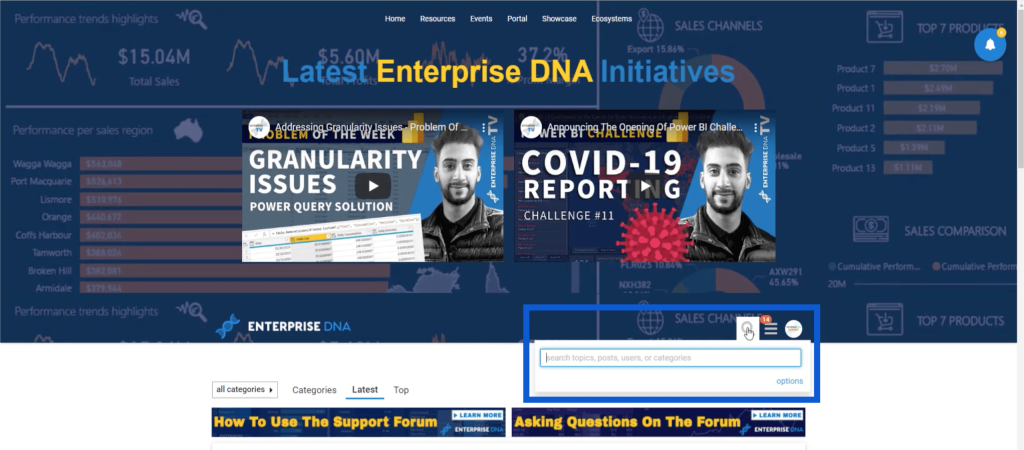
When you reach the forum homepage, you’ll see the search function here.
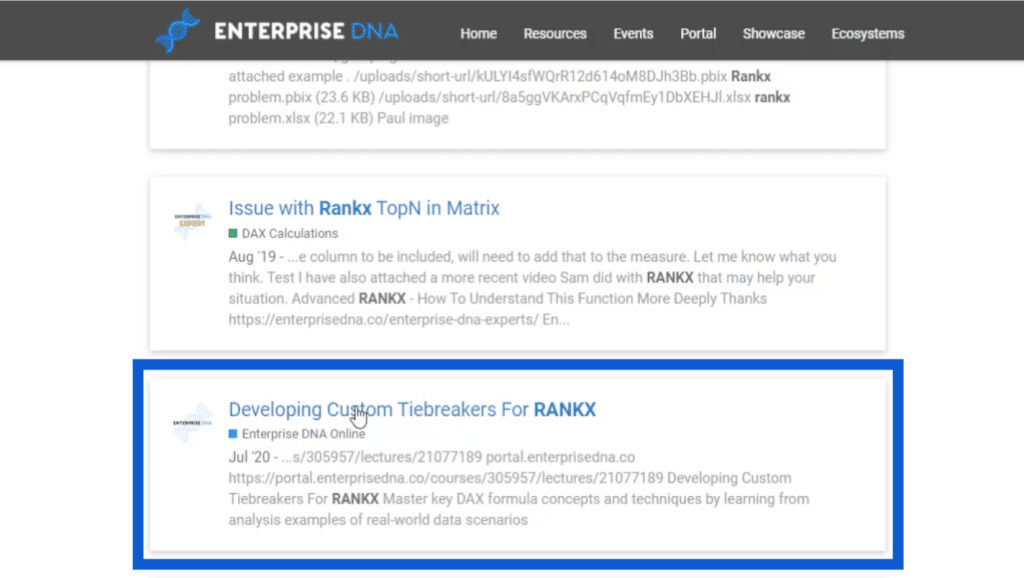
I’ll type in RANKX to show how much information you can get from the Forum alone. Based on the search results, there are over 50 discussions about the topic.
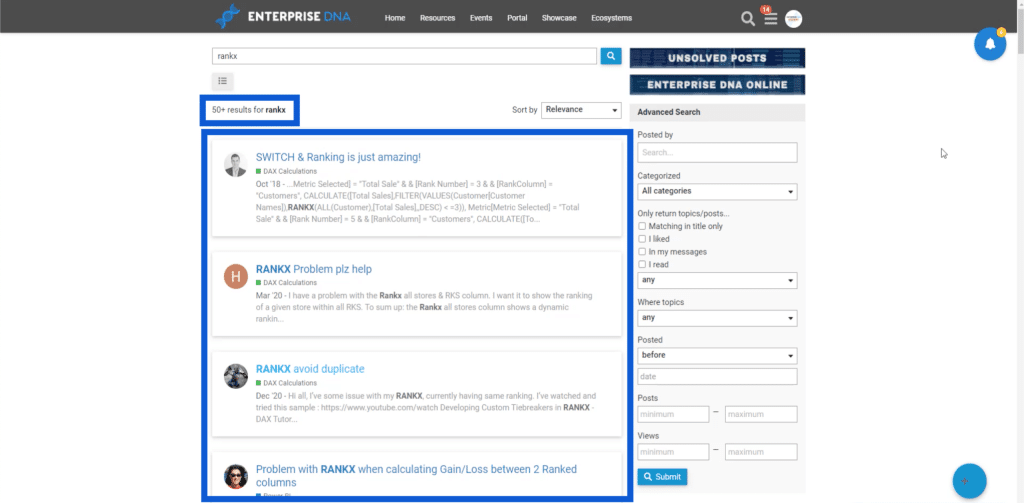
You’ll see a mix of great solutions on the questions being asked. This is a very collaborative community, that’s why you’ll see other people jumping into the discussions and sharing best practices.
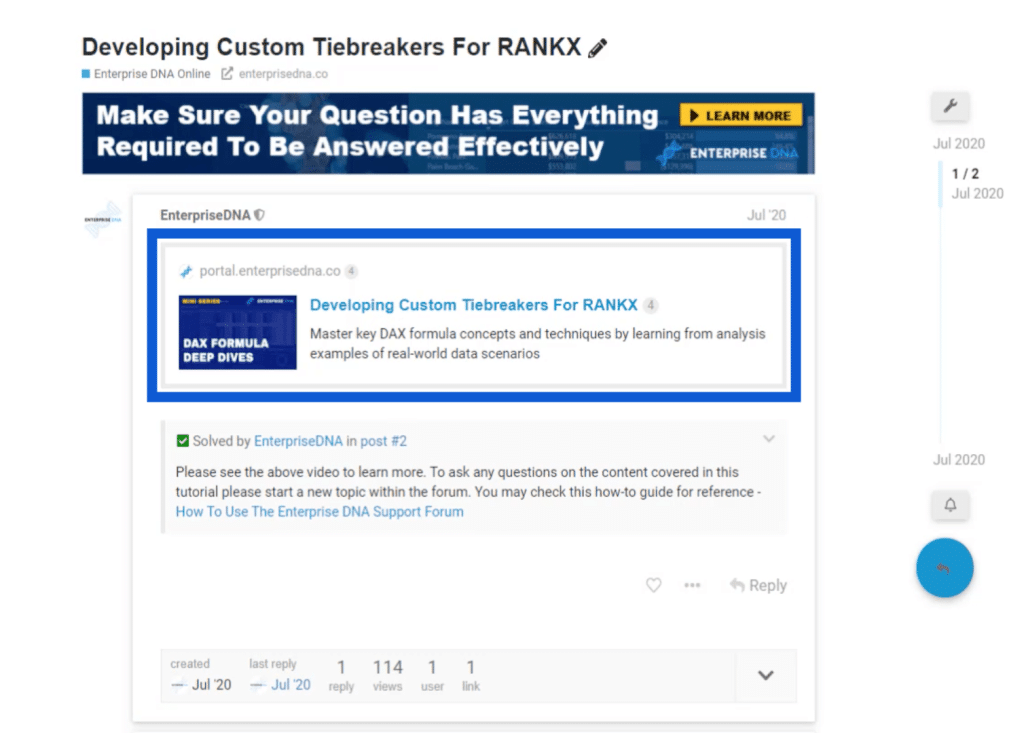
When I scroll down the results, I see this great content from Brian Julius, one of our Enterprise DNA Experts. This is about how to develop custom tiebreakers when using RANKX.

If I click on that, you’ll see that it gives you the link to the course where I can find even more information about the topic.
Visiting the Enterprise DNA Forum alone can already give you heaps of information especially if you feel stuck in your own ranking analysis. You can even get an Enterprise DNA membership and gain access to the rest of our learning platform so that you can develop your skills further as a Power BI user.
***** Related Links *****
RANKX Considerations – Power BI And DAX Formula Concepts
Show Top Or Bottom Results Using Ranking In Power BI
Extracting Unique Insights In Power BI Using Ranking DAX Measures
Conclusion
Power BI is such a well-rounded tool that allows users to gain as much insights as they can from the data they’re working with. In the scenario we discussed, you can get advanced ranking analysis in a seamless manner once we factor in techniques like measure branching.
It’s also great if you take advantage of the resources that we have here at Enterprise DNA. Even if you have advanced knowledge in creating reports and dashboards, there are always new tricks and techniques to learn.
All the best,
Jarrett


