In this tutorial, you’ll learn about Query Plan and Server Timings in DAX Studio. This is an overview of what happens behind the scenes whenever you run a DAX query.
You can find the Query Plan and Server Timings option in the Traces pane under the Home tab.

Query Plan In DAX Studio
When you click the Query Plan option, it creates a connection to the data model in either Power BI or SQL Server Analysis Services.
Query Plans are statements generated by the formula engine that defines the logical and physical flow of the task.
You can see the Output pane shows that the query trace has started.
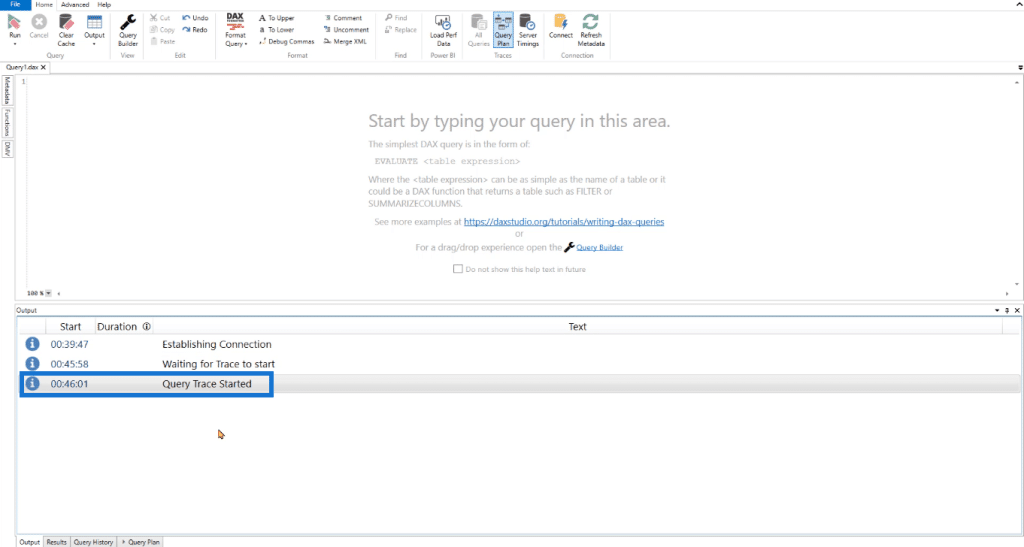
From here onwards, all the code you execute in your Tabular Model will be tracked by the query plan built by the formula engine.
Physical & Logical Query Plan
Clicking on the query plan option opens a new pane in the Output window. The query plan pane is divided into two sub-panes: the physical query plan and the logical query plan.

As an example, let’s write a DAX code that will EVALUATE the Products table. When you run this code, you’ll see some line items in both the physical and logical query plans.
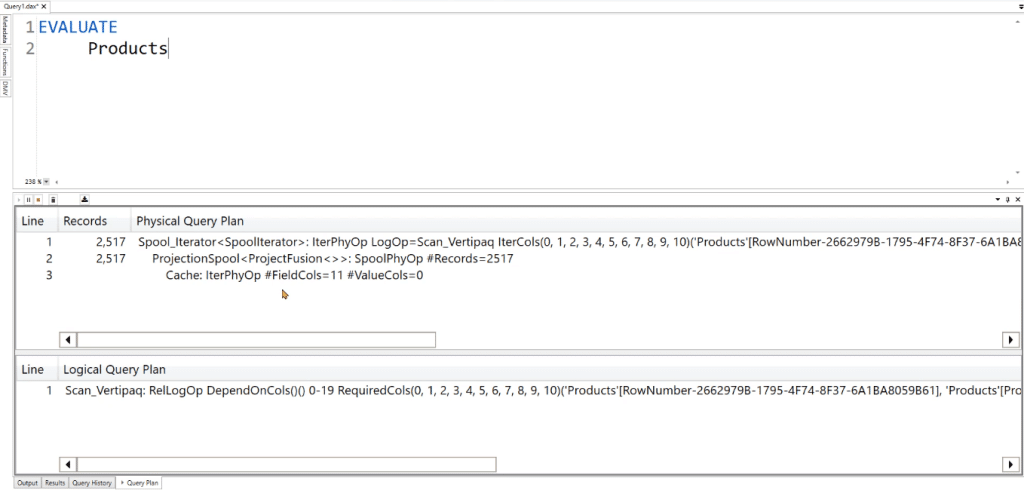
After you write your DAX code, the DAX parser checks the code for its validity and makes sure that there aren’t any mistakes. Then, the formula engine prepares a logical query plan. It also receives data from the storage engine.
Afterwards, the data cache is retrieved from the storage engine. This engine then prepares the physical query plan and executes it. When the execution process is done, you’ll get your result.
Server Timings In DAX Studio
When you click the Server Timings option, a new pane will appear in the Output window. This contains information regarding the CPU.
You can also see data for the formula engine (FE) and the storage engine (SE).

When you execute the same DAX code, the Server Timings pane displays new information.
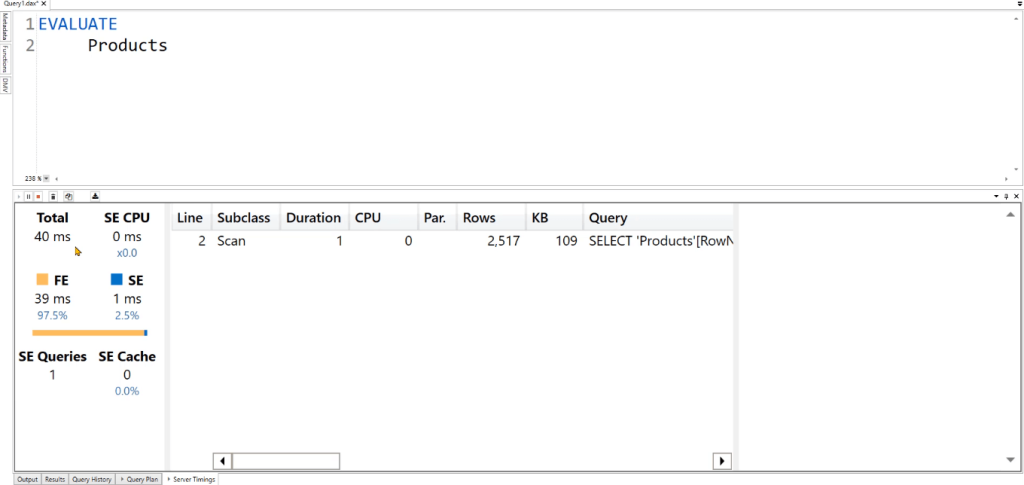
The Total indicates the total amount of time it takes to execute the query. If your CPU has multiple cores, then multiple segments can be scanned simultaneously. This is what the SE CPU represents.
The FE and SE shows how long it took for each engine to retrieve data and return the result back to DAX Studio.
The SE Queries shows the number of queries executed against VertiPaq or the DirectQuery storage engine. And lastly, SE Cache shows how much code is kept in the storage engine data cache.
The table also shows additional information regarding the query you executed.
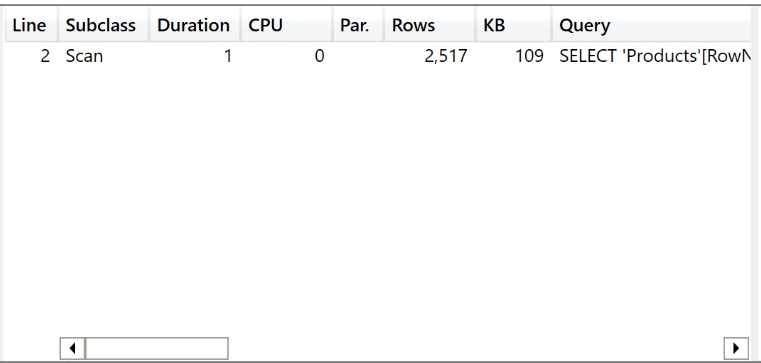
Each column represents the following:
- Line shows the line number of the query.
- Subclass shows the operator used.
- Duration shows how long it took the Storage Engine to execute the query.
- Rows show the number of rows in the generated table.
- KB shows the amount of RAM consumed by the table.
Breakdown Of The Process
When you click on the row in the table of the Server Timings pane, you can see a pseudo language of the query.
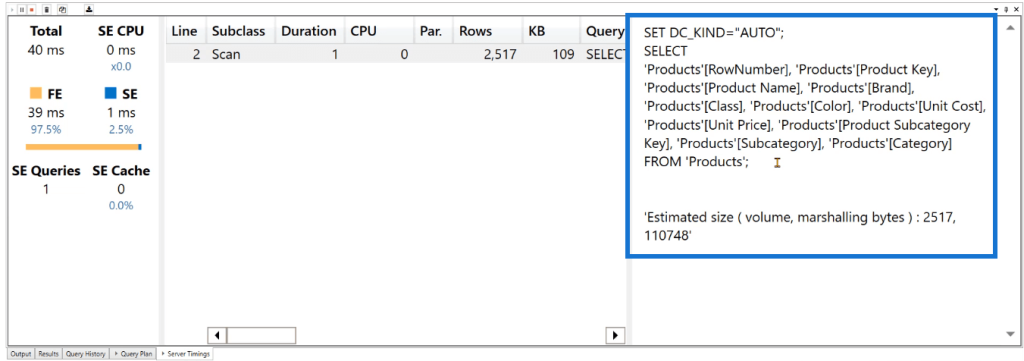
For this example, the storage engine returns a data cache of 2,500 rows back to the formula engine. Then, the formula engine prepares the physical query plan. Once the physical query plan is executed, you’ll get the result in the form of a table in DAX Studio.
The process and resulting table changes depends on the scenario you apply on your DAX code. You might use different functions or create a new calculated table. These will affect the processing speed of the engines in DAX Studio.
***** Related Links *****
Removing A Hidden Date Table In Power BI To Improve Performance
DAX Query In Power BI – Logical & Physical Query Plans
Configure Query Settings In Power BI DAX Studio
Conclusion
The query plan shows the list of instructions the database is following in order to execute the query. On the other hand, Server Timings shows specific metrics on the formula engine, storage engine, and data model.
By learning how these options are used, you gain greater understanding on what happens behind the scenes whenever you run a DAX code.
Enterprise DNA Experts


