What if you could know when your customers are likely to make their next purchase using predictive analytics in Power BI? You may watch the full video of this tutorial at the bottom of this blog.
By using predictive analytics techniques, we can try and predict when your clients are expected to buy your products and services.
Of course, there is going to be a little bit of work inside of Power BI to make all this work. But it will just showcase the incredible and powerful Power BI analytical features available to you when using DAX formulas correctly.
With Power BI, you can incorporate different formula and data modeling techniques to extract some very meaningful insights.
In this post, we’re going to discuss some predictive insight ideas. This is something that is very doable from a DAX perspective. Then we’ll discuss how we can use the data to predict customer behavior. Ultimately this can impact positively our financial bottom line.
Using Historical Data To Predict Customer Behavior
Before we dive in to our discussion, let us take a look at the historical data provided by the customer behavior table.
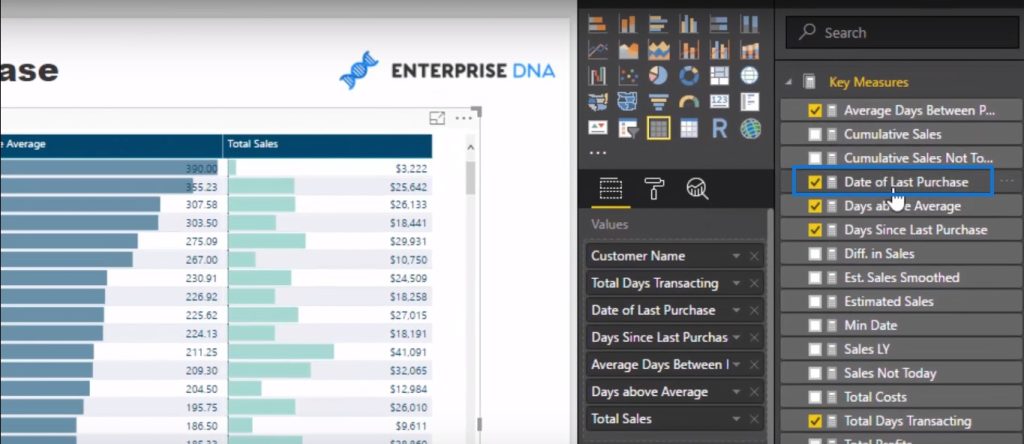
On top, you’ll see the Customer Name, Total Days Transacting, Date Of Last Purchase, Days Since Last Purchase, Average Days Between Purchases, Days Above Average, and Total Sales fields.

By using predictive analytics in Power BI, we can go look back in time and see when customers have actually purchased. We can also see how many times a person has transacted with us.
Based on the time frame they purchased, how likely are they to repurchase at any point in the near future?
The results from the answer to this question is a valuable insight.
What You Can Do With Historical Data
Simple predictive analytics in Power BI is not going to be 100% accurate and there’s a lot of intricacies around what could happen, but think about how you can use this insight.
If on average, a customer has purchased something from us 15 times over the last 2 years and they have done this every 40 or 50 days, you can do some marketing, make a sales call, or make sure they see an ad online to prompt them to take action.
There are so many great ways that you can utilize this insight. Even though it is not going to be perfect, it will give you an understanding of a customer’s purchasing decisions and you can come up with a marketing plan based on these decisions.
1. Determining The Last Transaction Date
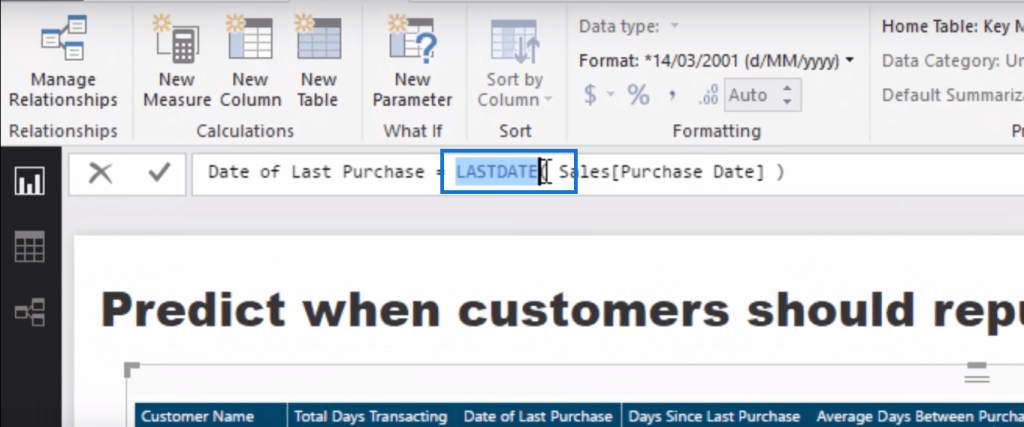
So let’s go through how I did it. I’m going to start with the actual last date of purchase. Let’s look at the formula.


2. Determining The Days Since Last Purchase
The next thing to do is to work out the days since the last purchase. What is the number of days since the last purchase? What’s the last actual transaction date in my data set? I just figure it out using this simple formula.

From this data, we can determine when the customer last purchased from us. That’s interesting and useful because you want to know when the customer last purchased from you, and then compare that to the average time frame between purchases.
Once you have that benchmark, that’s how you can discover customer trends. In this case, the customer Gregory Jackson has purchased every 61 days.
But he has not purchased anything for 451 days so there is something quite clearly wrong there. You can use this data to make changes to your marketing strategies to prompt this customer to become active again.

3. Determining The Average Days Between Purchases
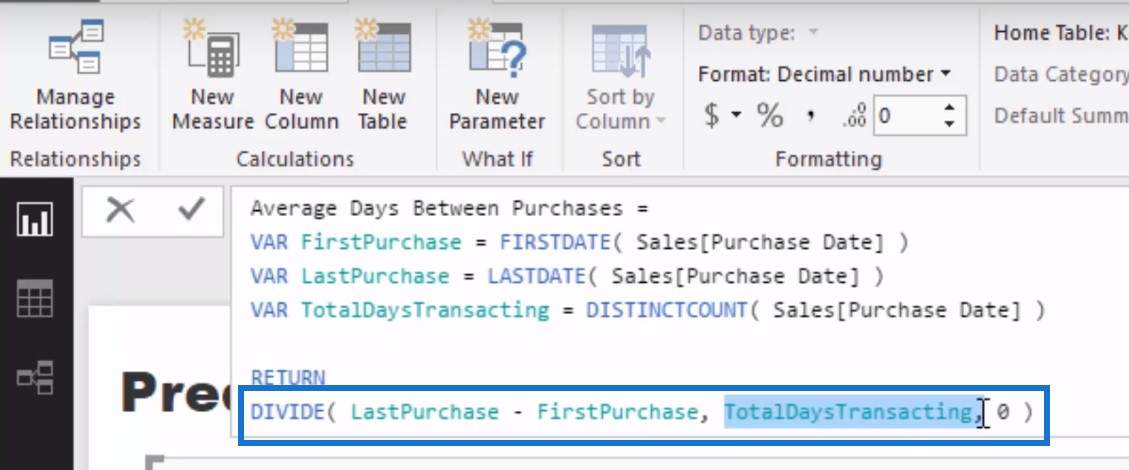
So this is the big part of this analysis: how do we work out the average days in between purchases? Although it is a combination of many things, it may be simpler than you think.
You can get just as good a projection, and it may not be perfect, but just as good, by visualizing this formula.

So all I did was that I went in and for every single customer, I worked out when was their last purchase versus when was their first purchase, and then I divided them by the total number of days that they transacted.

So think about that. So for each customer, we will figure out when was the first purchase they made, when was the last purchase they made, and then how many days did they actually transact with us.
Obviously, it is not perfect, but it is going to give you an estimate of the average days and purchases. When someone comes to you on a regular basis, then it is going to showcase you the average days between purchases in a logical way.
4. Determining The Days Above Average
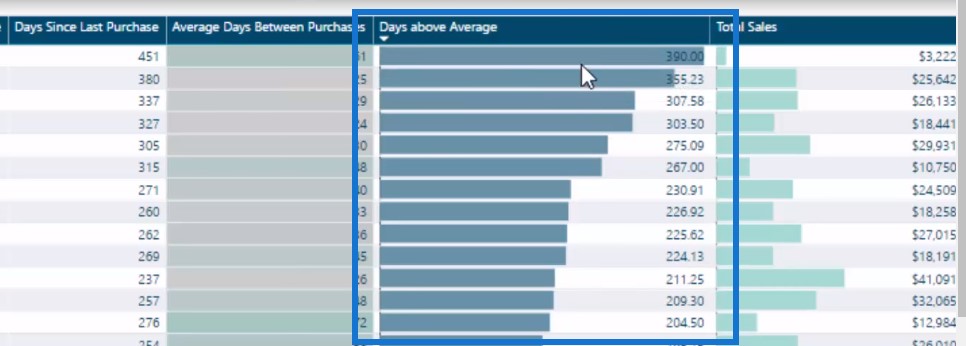
Then I created another measure which shows that if a customer is over their estimated average days, it will show me how many days they are actually over. This is what the Days Above Average column is showing.

My mind explodes with what you could do with this figure. Let’s say you are an online retailer, you figure out that a customer comes to you every 30 days.
So leading up to that date, you can send out some email marketing to them, or you can do some adverts on Facebook. This is a truly, truly great insight that you can use to improve customer retention rate.
Another example is this particular customer here. The average time between purchases is 98 days, while their last purchase was made 48 days ago.

In the days leading up to this customer’s next purchase, you can send out some marketing material to remind them of your business.
5. Determining The Profitability Of A Customer
Another measure we can use is your customers’ profitability. Using the Total Sales column, you can check which ones are your top customers.
You can also determine if it would greatly impact your business if you lost a particular customer. Using the example on the table below, losing Gregory Jackson as a customer won’t make a lot of impact because you only earned $3,222 in sales from him.
On the other hand, you want to retain Joshua Romero because he has been a very good customer so far. You can formulate a marketing plan and then reach out to him.
You can identify the customers that are most profitable to your business, and determine if they are purchasing as they should be. The Total Sales and the Days Above Average columns will show you how to identify these two figures in a real-time way.

***** Related Links *****
When Did Your Customers Make Their Last Purchase? – DAX Techniques in Power BI
How You Can Predict Profitability In The Future Using Power BI
Customer Trend Analysis in Power BI Using DAX
Conclusion
So I am going to round things off with this insight. The ability to integrate advanced predictive analytics in Power BI is powerful and can add a lot of value to your organization.
For instance, being able to make future business predictions can make your business operations more efficient and allow you to gain a competitive advantage over your competitors.
Take your time to review this video and learn a technique you can apply to predict future business scenarios.
If you want to learn more about some of the most advanced analytics techniques in Power BI, check out the link below from Enterprise DNA online.
Advanced Analytics in Power BI
Good luck with these techniques
Sam


