In this post, I’m going to show you how to do a conditional merge of tables in power query. For this particular example, we can actually do it the normal way, which is what we are going to start with. Then I will show you how to do a conditional merge.
Let’s see what we’re dealing with. First, we have the Usage table which gets set in the middle of the month.

Then we have a second table which is the Price table that gets set in the beginning of the month.

We want to know the price for a specific date, which is something we can do in DAX. Let’s duplicate the Usage table, go to Merge Queries, and then select the Price table.

As you can see from the image above, the dates from the two date columns do not match, which means we can’t merge tables normally. A normal merge makes use of the left outer or the right outer merge. Since there isn’t a match, we can’t do a normal merge.
What we’re going to do is a full outer merge because that will pick all rows from the Usage table and all rows from the Price table and put them all together. If there is no match, it will just add rows.
Because there are no matching dates, both tables get added this way:

Adding A Custom Column In Power Query
We can very easily add a custom column that says if the usage date is empty, then pick the date from the Price table; otherwise give me the date from the Usage table.

So we now have a complete column with dates.

In order to make some sense of this, we’ll sort the Dates custom column.

You can see that the first column is the usage while the third is the pricing. If we do a fill down on the cost column…

…we will actually get the date, the cost, and the usage.

This is a normal merge, but I think conditional merge can also be very useful in cases like this. So let me show you what we need to do in order to do a conditional merge. We will say that if the usage date is bigger than the pricing date, then get the number.
First, we’ll reference our Price table.

And then we click on Date Filters then Before.

If we choose February, it will show the 21st.

If it is March, it will have two rows because there are two prices that are less than.

If we choose April, then we will get this.

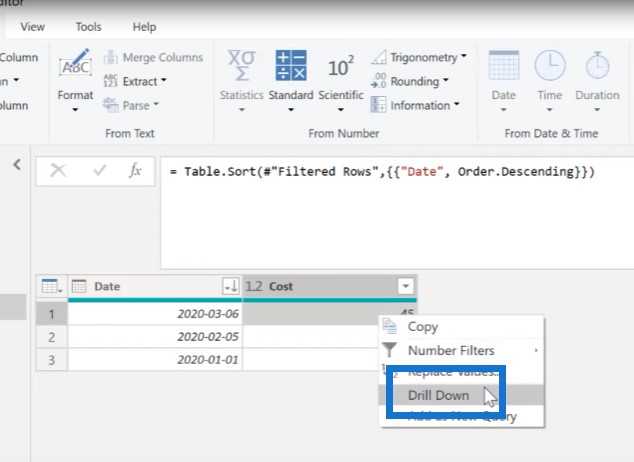
We always want to have the latest prices. So we’ll sort these in descending order and drill down.

So now we have the number that we want, which is 45.

Creating A Variable In Power Query
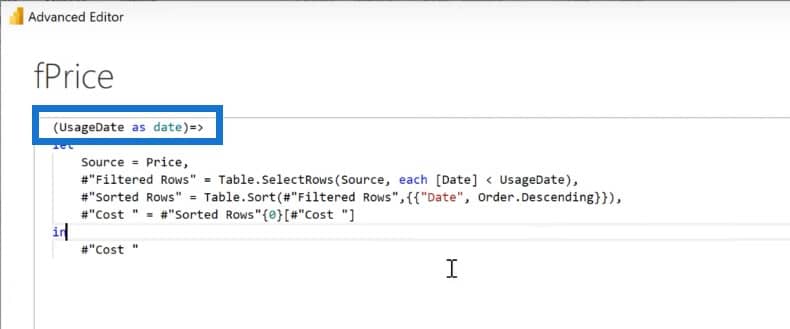
To move this into the Usage table, we’re going to create a function for price. Instead of feeding this date manually, we’ll have the Usage table fill that date.
We’ll go to the Advanced Editor and create the variable for the function, which is going to be UsageDate as date.

We’ll go to our Usage table and apply this function. This is the usage state that we’re going to feed to our function. We’ll go to the Add Column tab, click on Custom Invoke Function, and grab the variable where the column to feed is the usage date.


And there we have it. As you can see, it’s fairly easy to do a conditional merge solution in power query.

Conclusion
In today’s blog, we discussed how to merge tables with different columns in power query. If you enjoyed the content covered in this particular tutorial, please don’t forget to subscribe to the Enterprise DNA TV channel. We have a huge amount of content coming out all the time from myself and a range of content creators – all dedicated to improving the way that you use Power BI and the Power Platform.
Sam
***** Related Links *****
How To Merge Queries In Power BI
How To Dynamically Merge Columns In A Power Query Table
Power Query Best Practices For Your Data Model
***** Related Course Modules *****
Fundamentals in Power Query and M
Applied Problem Solving with Power Query/M
Power Query Series
***** Related Support Forum Posts *****
Cleaning Dirty Data In Power Query
Clearing Parameters Set In Power Query
GraphQL Query And Load To Power Query
For more on Power Query see here….


