This tutorial will discuss about the available features inside the Power Query Editor. You’ll learn how to access and maximize these features in order to improve your data development skills in Power BI. You’ll also learn how these power query features will help you build data reports more efficiently.
The Advanced Power Query Editor And Its Features
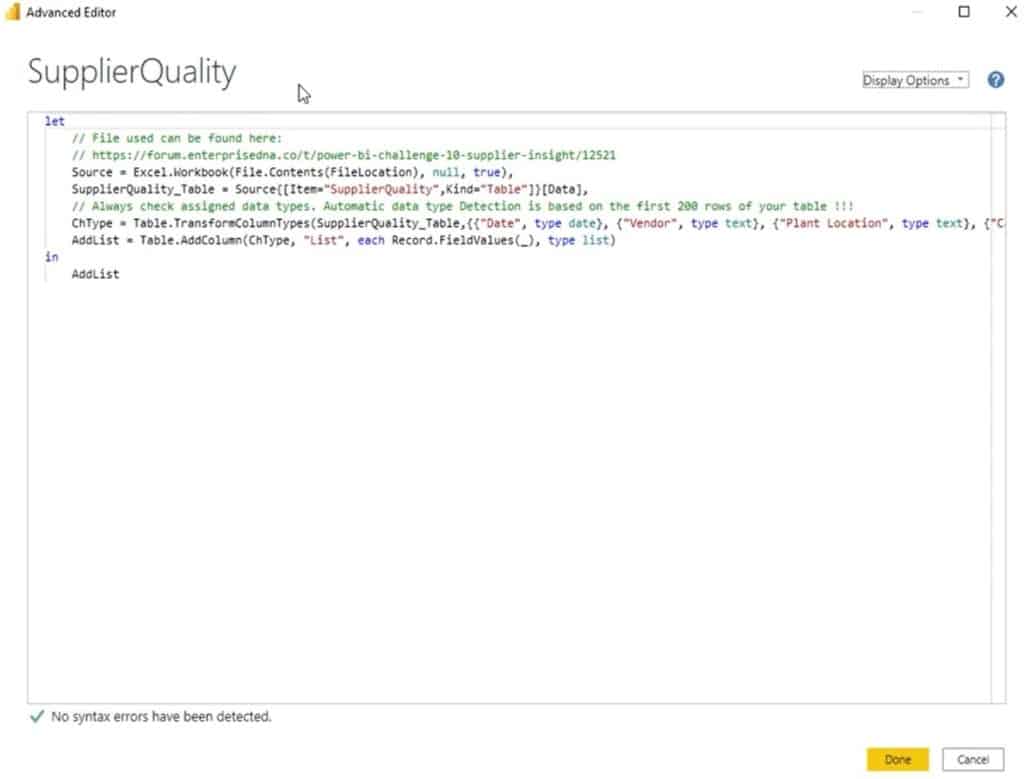
The first feature is the Advanced Editor window. To open the window, click Advanced Editor in the Home tab ribbon.

After that, the Advanced Editor window will appear on the screen.
The Power Query M Function Reference
In the top left corner, you’ll see the query name. Opposite that, you’ll find the Display Options and a question mark. If you click the question mark, you’ll be directed to the Power Query M function reference in your standard browser.
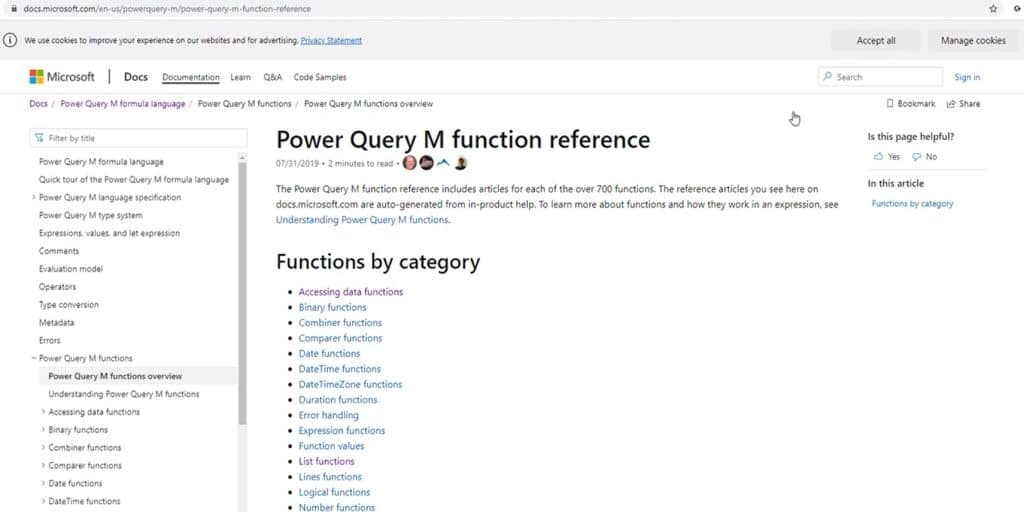
If you want to look up the available M functions or explore how these functions work, copy and paste them into the Advanced Editor window.
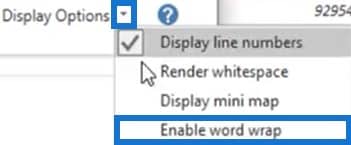
To access and set the display options, click the drop down button beside Display Options. You can show the line numbers for the syntax by selecting Display line numbers.

The syntax pane will then look like this.

The M code generated by the user interface is written in a single line. So if you want to see the full code, you have to scroll up or down frequently. But you can see the whole code without scrolling by selecting Enable word wrap in the Display Options.
You’ll then see that line 7 automatically indents the code when it is split into multiple lines.

To zoom in or out of the syntax pane, hold Ctrl + Shift keys then press – or +. If you want to have the default zoom, press Ctrl + 0. These zoom options can also be used in the Preview pane of the Query Editor.
Features In The Data Preview Section
The next feature that will be discussed is the Data Profile. If you go to the View tab, you’ll see the Data Preview section where all the available column profile options are.
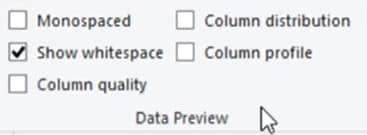
Column profiling is only performed on the top 1000 rows unless you change the settings in the status bar to scan the entire dataset. Doing so can have a performance impact so always check and make sure that you set it back to the top 1000 rows once you’re done.
When you hover over the green line directly below the column headers, you’ll see a preview indicating the number of Valid, Error, and Empty values.
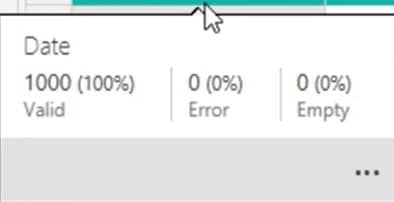
You can see that the total number of values in the preview is 1000. However, that changes if you scan the entire dataset. Do this by going to the status bar and changing the setting to scan the dataset.

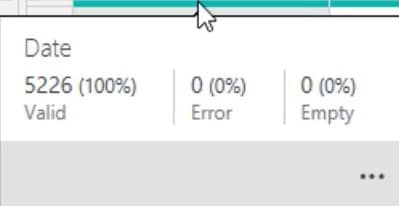
After that, when you hover over the green line again, you’ll see that the total number of values has changed to 5226.
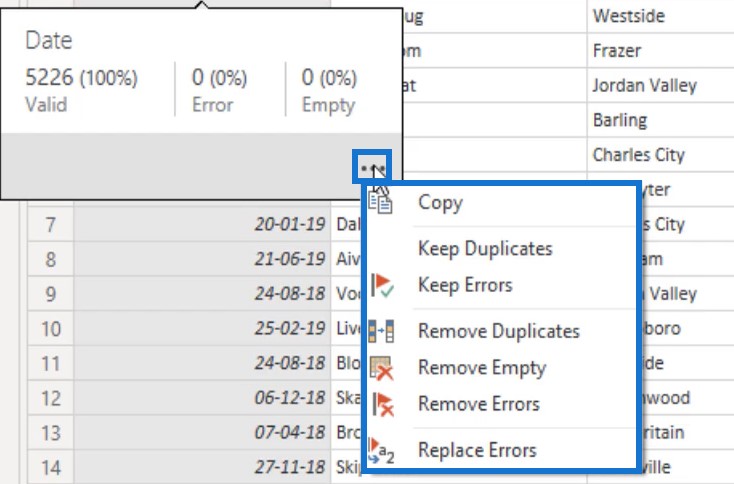
At the bottom right of the preview, there’s an ellipsis that opens a menu with options for your data.
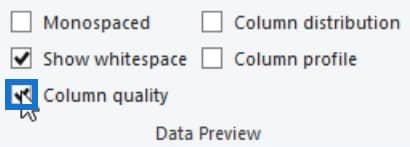
If you enable Column quality in the Data Preview section, you’ll see previews of the valid, error, and empty values in percentage in each column.

Enabling the Column Distribution in the same section will display the number of distinct and unique values. It can help determine if the data is consistent or not, and if it’s distributed evenly.

If you hover over the graph, you’ll see a preview with an ellipsis to access the menu.
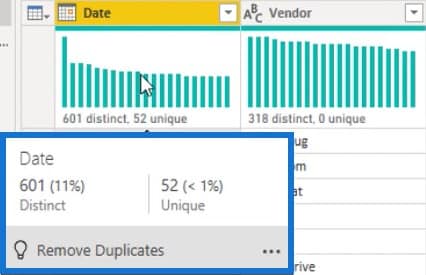
The Column Profile option lets you see the Column statistics and Value distribution which offers more details depending on the data type. The sample column selected is in date type.

Context Menus For Different Data Type
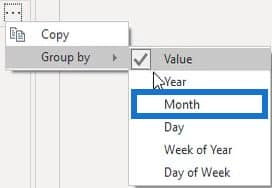
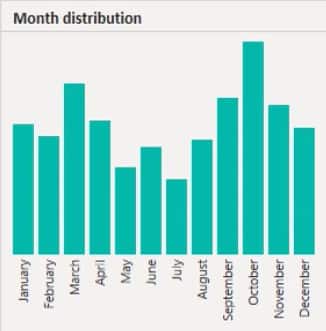
The ellipsis in the Value Distribution section lets you change the Group by setting. If you select Month, you’ll see that the graph changes to Month distribution.
If you select a column with a text type, the Group by settings in the ellipsis also changes.
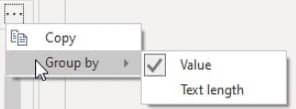
For a column with a numeric type, the Group by also has different settings.
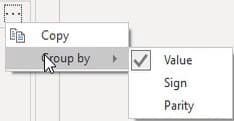
Remember to set the column profiling back to the top 1000 rows.

The Query Dependencies Feature
The next feature is the Query Dependency view.
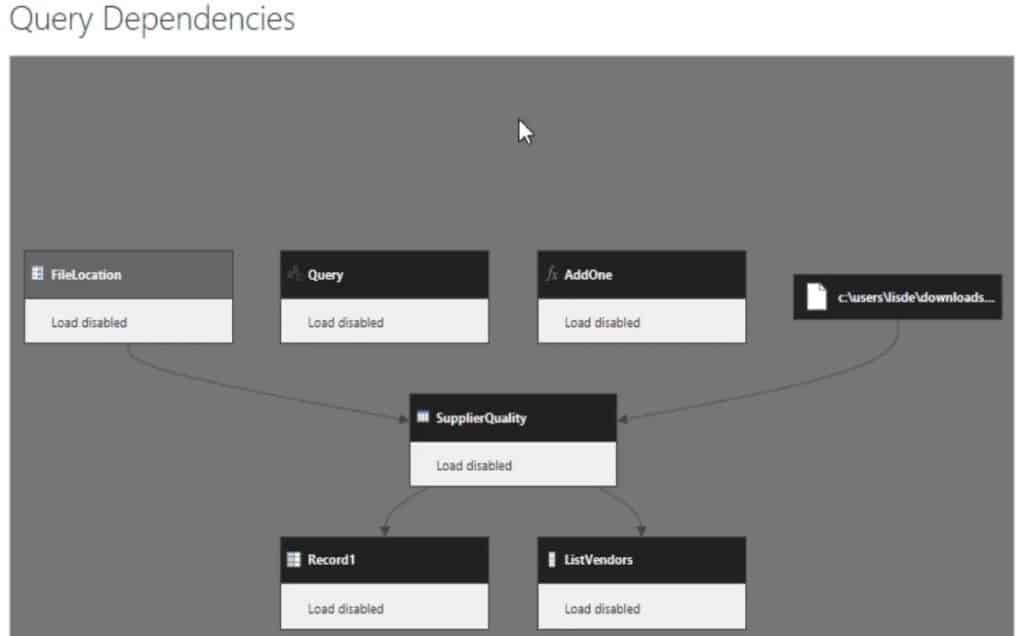
If you go to the View tab and select Query Dependencies, you’ll see the flow of data from one query to the next.
If you click on a query, all associated queries get highlighted. This makes it easier to follow the errors around the flow because you can see the load destination for all queries.
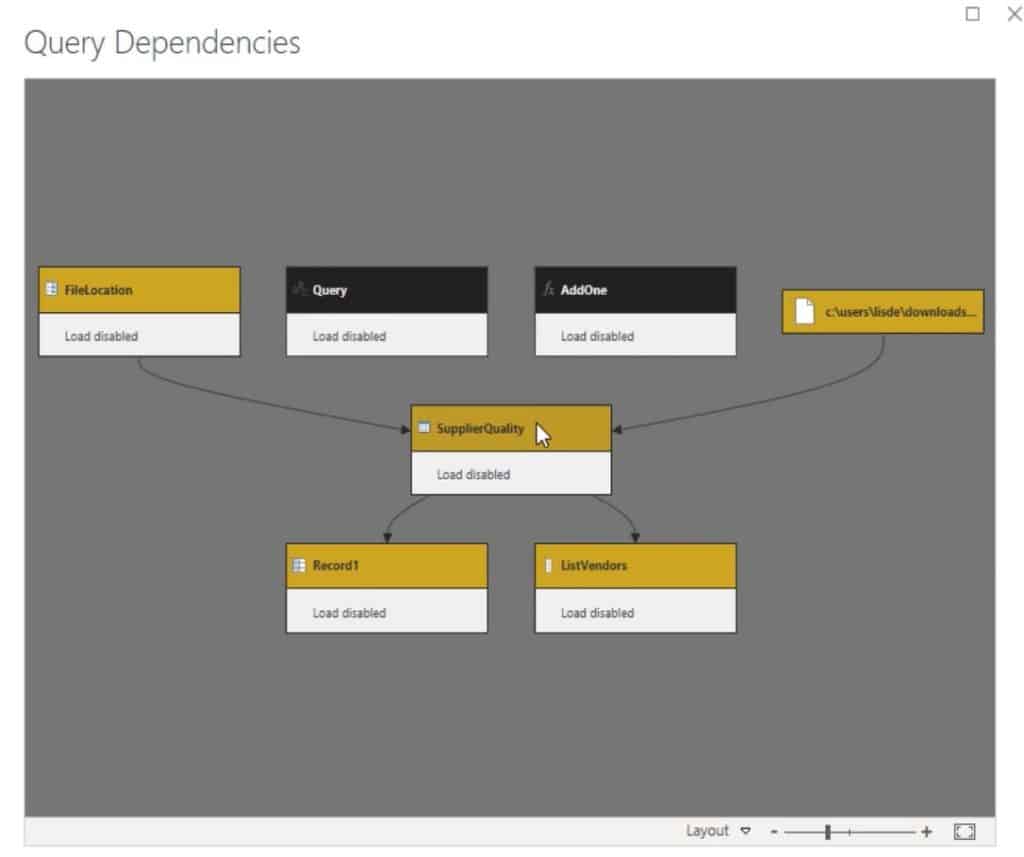
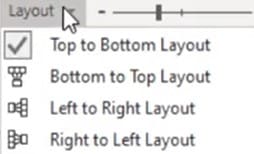
If you click on the Layout option, you can switch between the different viewing options depending on your personal preference.
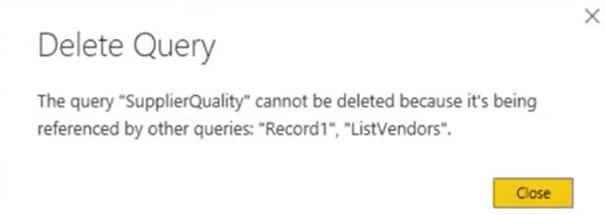
Power Query will never allow you to delete a query with dependencies. If you delete the SupplierQuality in the Queries pane, a notification will appear saying that it can’t be deleted because it has two dependencies: Record1 and ListVendors.
There are two ways to delete the query. The first is to delete the dependencies before deleting SupplierQuality. The second is to change the data source of the dependencies so that they won’t be dependent on the SupplierQuality.
***** Related Links *****
Creating A Custom Text Cleaning Function In Power Query
Combinatorial Analysis Using Power Query In Power BI
Power BI Unpivot Columns – Power Query Tutorial
Conclusion
The features inside the Power Query Editor are made to assist you in creating a compelling Power BI report. They provide additional data and information that you can use in your report or dashboard. They also help you monitor the flow of the queries and show how they are related to each other.
Melissa


