This tutorial will present a Power BI sample dashboard that contains transport, shipping, and logistics data.
The example that will be used in this tutorial is real-world logistics data from an Enterprise DNA member. You can see 4 different analysis segments with pictures.

Introducing The Power BI Sample Logistics Dashboard
This sample dashboard shows a seamless navigation experience.
If you hover your mouse over a picture, a text will appear based on the data it contains. In this example, the mouse is hovered over the picture with a truck and the word ROAD appears.
If you click the picture, it will take you to a different page that contains insights about shipping and transporting products via road. The details about the actual shipping like weight, origin and destination are also provided.

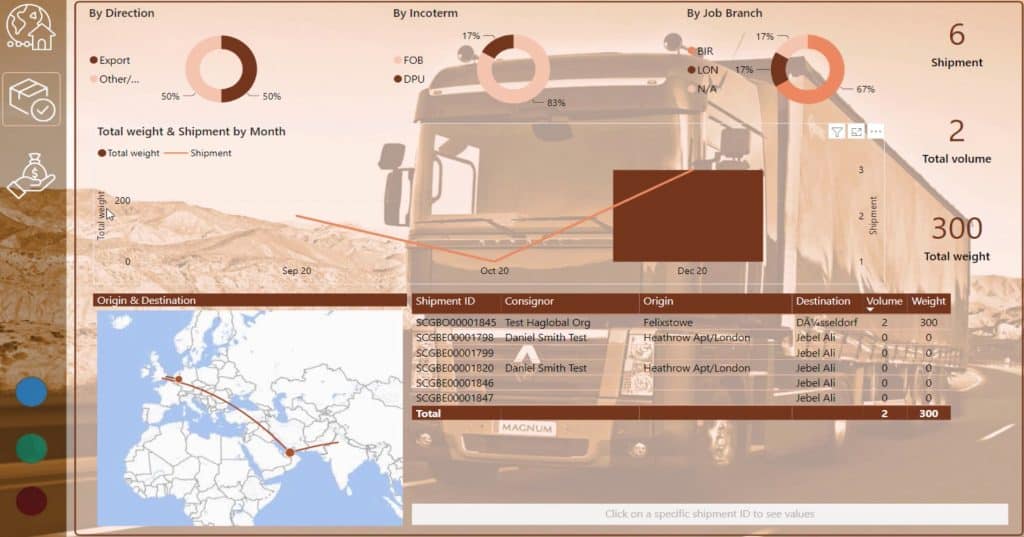
Using Filters To Tell A Story
When you’re assessing any dataset, you need to understand the story you’re trying to tell. The story changes depending on the chosen filters or dimensions.
Filtering data depends on your preference or on what you want to highlight. You can break data by location or company. In this example, the data is filtered depending on the transportation option.
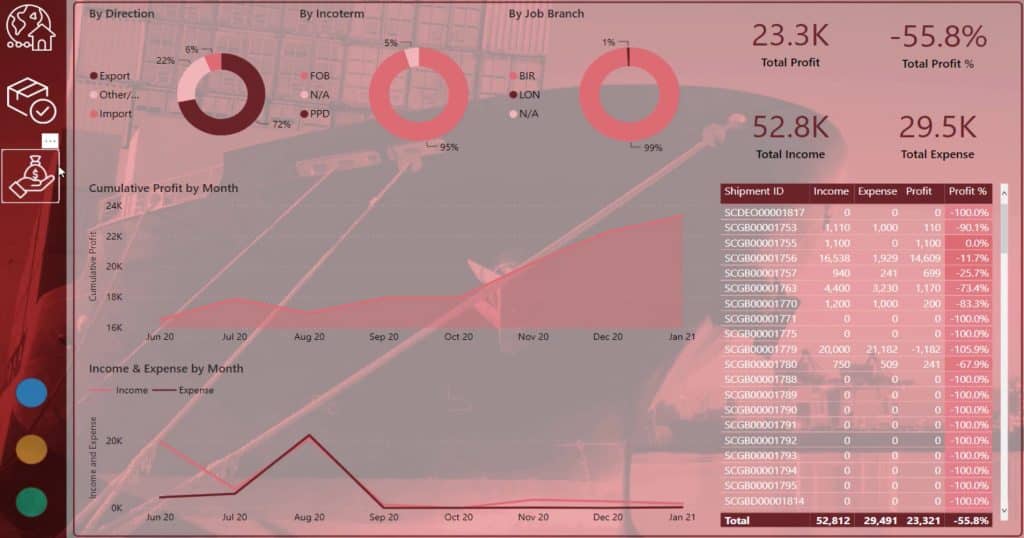
If you select a segment, you’ll see navigation icons on the left-hand side of the dashboard. The icons will show more insights and analysis of the selected segment. In this example, the Sea segment is used.

If you click the last icon, you’ll see data like Total Profit, Total Profit %, Total Income, and Total Expense. You’ll also see visuals that show data over time.
This is the logistic dataset used in the dashboard. This table consists of 224 rows and 121 columns.

For its data model, you’ll see that it has the waterfall format where the LookUp tables are at the top and the Fact tables at the bottom.
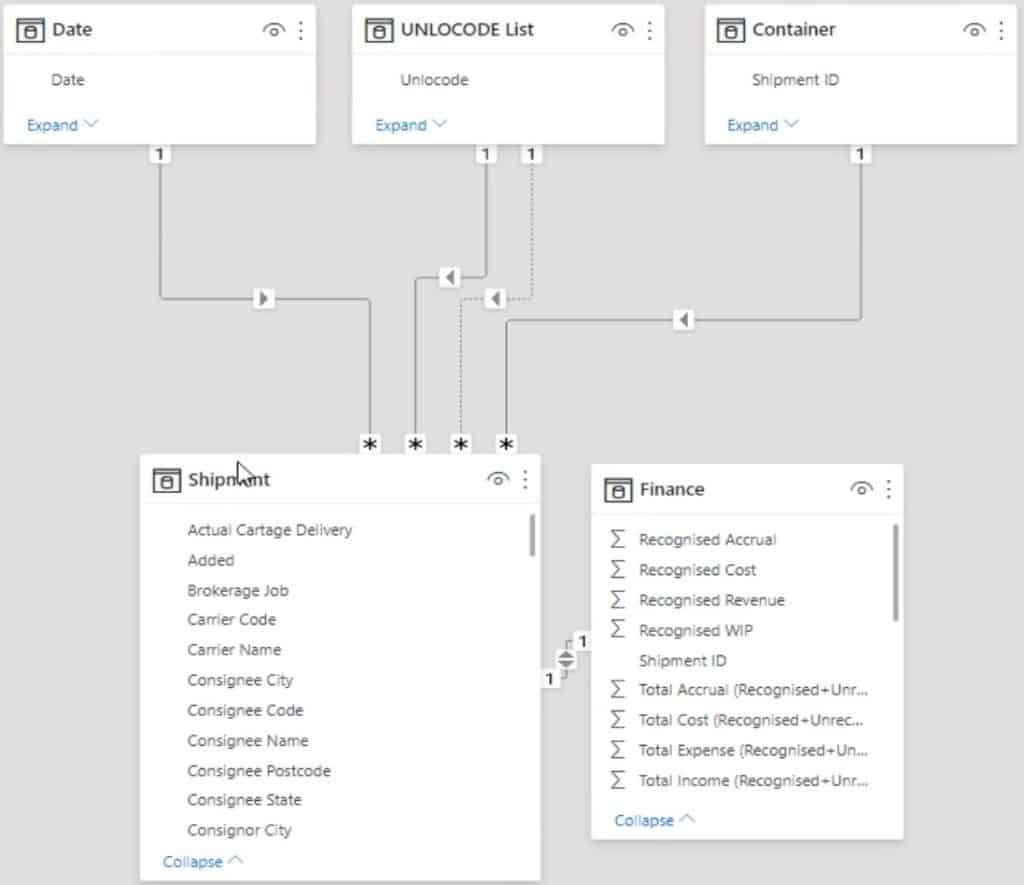
You’ll also notice that the Shipment table has a one-to-one relationship with the Finance table. Another way to do this is to create a LookUp table with the common column of the Fact tables, Shipment ID. Then, create a one-to-many relationship between the Lookup table and Shipment table.
With any logistics information, you need to have a line item with the shipment ID to gain transactional information from actual shipments. So the key data of the dataset is the Shipment ID.
Breaking Data Into Segments
With datasets like this, you need to break out the segments of information that make sense and have LookUp tables and filtering tables. Things that you can easily identify would make a good LookUp table. One example is locations because this dataset has codes containing the origin and destination of the shipments.
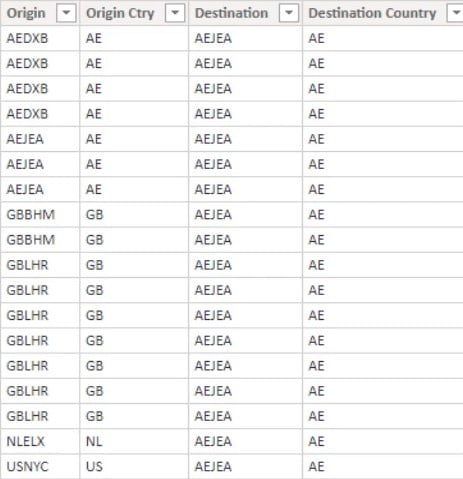
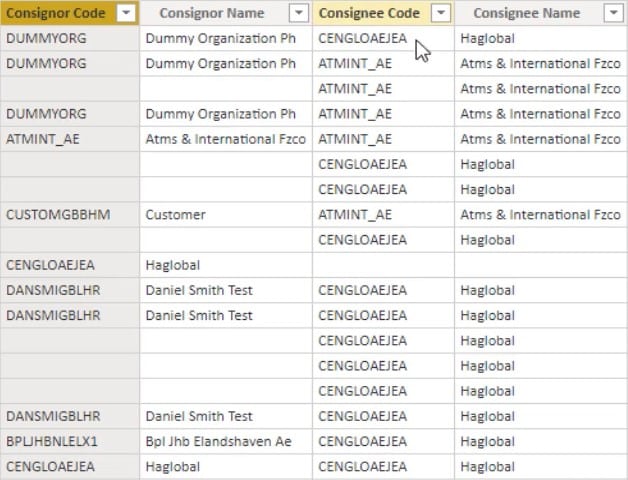
If you look at the table, you’ll see the consignors’ codes and names. You can also have a LookUp table with one unique index for consignors and then link that index back to the consignors’ codes. This will reduce the complexity in your model and the file size of this particular data.
You also need to look for columns with numeric values because that’s where you’re going to create your measures. You can create simple measures to calculate profit, weight and volume, and then filter them by the LookUp table dimensions.
By adding LookUp tables, your data model will have more LookUp tables flowing down to their respective indexes in the Shipment Fact table.
You can also combine and simplify the Fact tables by extracting out all text dimensions into relevant LookUp tables like customers, destinations, or types of goods. They will then become columns of unique values that can create additional dimensions that relate to them. This will also enable you to easily expand the analysis you’re doing such as utilizing time intelligence calculations, DAX formula patterns, or ranking techniques.
That’s how you build a compelling analysis inside Power BI. This report also shows the versatility of what you can do with any type of dataset in Power BI.
More Logistics Dashboard Samples In Power BI
You can check out some showcases for logistics data in the Power BI Challenge in the Enterprise DNA page. You can also download all the PBIX files if you want to practice and learn more dashboard techniques.
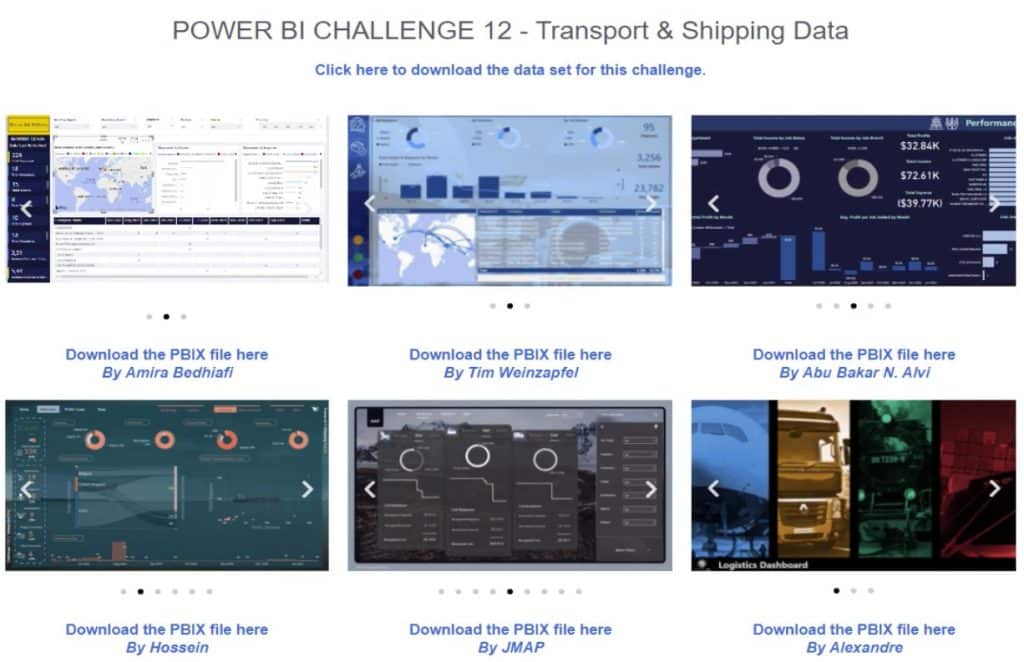
If you want to review what this sample dashboard looks like in a published web version, go to Power BI Showcase in the Enterprise DNA website and select Logistics Dashboard.

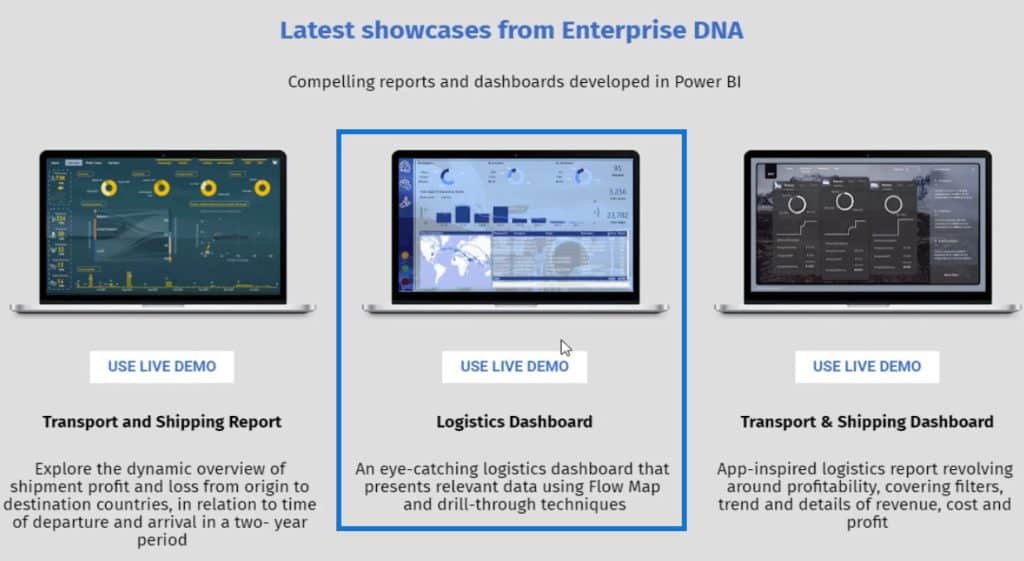
If you want to repurpose the report, you can use the model and replace it with your own dataset. In that way, you can benefit and leverage all the logic that has been built inside the dashboard. You can also improve it by modifying the model and calculations, and organising it to your preference.
Conclusion
***** Related Links *****
Business Metrics In Power BI Reports To Achieve Logistics Insights
Logistics Insights For Power BI – DAX And Data Modeling Overview
Reporting Apps Using Power BI For Transport & Shipping
A great data report gives the best information and insights. It must contain compelling visualizations to give users the best navigation experience. Utilize and maximize all the available tools in Power BI to create a data report and improve your data development skills.
Sam


